The blow fill seal technology market is projected to grow from USD 3.8 billion in 2025 to USD 7.6 billion by 2035, registering a CAGR of 7.2%. This growth is driven by increasing demand for sterile pharmaceutical packaging solutions and aseptic manufacturing processes, where blow fill seal (BFS) technology plays a pivotal role in ensuring contamination-free and preservative-free packaging formats. The pharmaceuticals application segment is the largest, accounting for 56.0% of demand, reflecting the widespread adoption of BFS systems in injectable medications, respiratory care, and ophthalmic solutions.
The ampoules product segment is expected to dominate, accounting for 47.0% of the market, driven by their superior hermetic sealing properties, break-resistance, and sterility assurance, making them essential in sterile drug production. BFS systems are increasingly adopted for single-dose, preservative-free applications across biological drugs, vaccines, and specialized therapeutic packaging. India leads market growth with a 9.3% CAGR, driven by the country’s expanding pharmaceutical production capabilities and increasing generic drug manufacturing. China follows with 8.4% CAGR, supported by its rapidly modernizing pharmaceutical industry and growing adoption of advanced aseptic packaging technologies. Meanwhile, the United States (6.7%) and Germany (6.2%) show steady growth, focusing on biological drug production and advanced aseptic processing.
The growing trend of automation and efficiency in manufacturing processes is contributing to the popularity of BFS technology. The integrated process of blow molding, filling, and sealing reduces the need for multiple machines and manual labor, resulting in lower operational costs and higher production speeds. Manufacturers are increasingly adopting BFS systems to streamline production, reduce the risk of human error, and meet the growing demand for high-volume packaging. This efficiency makes BFS technology particularly attractive for industries that require large-scale packaging, such as pharmaceuticals and food production.
BFS technology is seeing increased use in the food and beverage sector. The ability to package liquids, sauces, and other consumable products in tamper-evident, airtight containers makes BFS technology ideal for extending product shelf life and maintaining product quality. As consumer demand for convenience and longer shelf life increases, BFS technology is playing a key role in ensuring that food and beverage products are safely packaged while minimizing preservatives and other additives. Additionally, BFS technology’s ability to create lightweight and durable packaging is making it a favorable choice for companies aiming to reduce packaging costs and improve sustainability.
Regulatory compliance is another challenge that manufacturers must navigate when using BFS technology, particularly in the pharmaceutical and food sectors. The strict requirements for sterility, safety, and quality control in these industries necessitate careful monitoring of the production process. Manufacturers must invest in continuous training, advanced quality control systems, and compliance with international regulations to meet these standards.
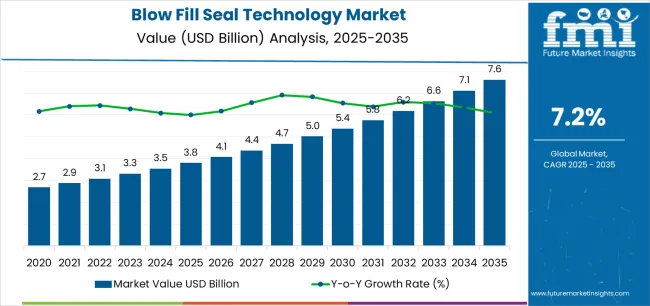
| Metric | Value |
|---|---|
| Estimated Value in (2025E) | USD 3.8 billion |
| Forecast Value in (2035F) | USD 7.6 billion |
| Forecast CAGR (2025 to 2035) | 7.2% |
Market expansion is being supported by the increasing global demand for sterile pharmaceutical packaging solutions and the corresponding need for manufacturing technologies that can provide superior contamination control and aseptic processing capabilities while enabling preservative-free formulations and regulatory compliance across various pharmaceutical and biotechnology production applications. Modern pharmaceutical manufacturers and contract packaging organizations are increasingly focused on implementing production technologies that can eliminate human intervention during filling operations, prevent microbial contamination, and provide validated sterile processing throughout integrated automated manufacturing systems. Blow fill seal technology's proven ability to deliver exceptional sterility assurance against external contamination, enable single-step container formation and filling, and support regulatory compliance make them essential manufacturing platforms for contemporary pharmaceutical production and specialty drug packaging operations.
The growing emphasis on patient safety and manufacturing efficiency is driving demand for BFS systems that can support high-volume pharmaceutical production requirements, improve product sterility profiles, and enable automated aseptic processing formats. Manufacturers' preference for packaging that combines effective contamination barriers with processing speed and operational efficiency is creating opportunities for innovative blow fill seal implementations. The rising influence of biological drugs and preservative-free formulations is also contributing to increased demand for BFS technology that can provide integrated sterility, minimal product exposure, and reliable performance across complex pharmaceutical manufacturing operations.
The blow fill seal technology market is poised for rapid growth and transformation. As industries across pharmaceuticals, biotechnology, ophthalmology, respiratory care, and veterinary medicine seek packaging that delivers exceptional sterility assurance, contamination prevention, and manufacturing efficiency, BFS technology is gaining prominence not just as alternative packaging but as strategic enablers of drug safety and production optimization.
Rising pharmaceutical production in Asia-Pacific and expanding generic drug manufacturing globally amplify demand, while manufacturers are leveraging innovations in barrier polymer formulations, multi-chamber container designs, and integrated inspection systems.
Pathways like biological drug compatible systems, multi-dose BFS formats, and application-specific container geometries promise strong margin uplift, especially in high-value segments. Geographic expansion and vertical integration will capture volume, particularly where local pharmaceutical manufacturing capabilities and regulatory expertise are critical. Regulatory pressures around sterility assurance requirements, contamination risk mitigation, preservative-free drug standards, and pharmaceutical quality control give structural support.
The market is segmented by product type, application, container capacity, material type, end-use industry, and region. By product type, the market is divided into vials, ampoules, bottles, and others. By application, it covers pharmaceuticals, ophthalmology, respiratory care, veterinary medicine, and others. By container capacity, the market is segmented into small volume (less than 10ml), medium volume (10-100ml), and large volume (above 100ml). The material type includes polyethylene (PE), polypropylene (PP), and others. By end-use industry, it is categorized into pharmaceutical manufacturing, contract packaging, biotechnology, and others. Regionally, the market is divided into North America, Europe, East Asia, South Asia & Pacific, Latin America, and the Middle East & Africa.
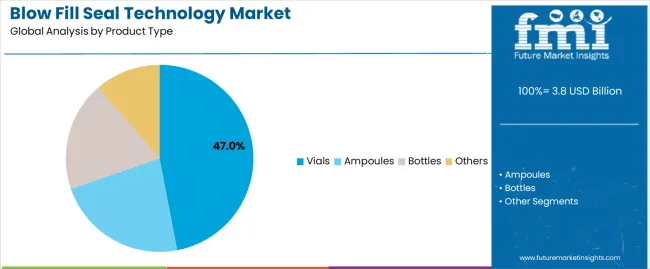
The ampoules segment is projected to account for 47.0% of the blow fill seal technology market in 2025, reaffirming its position as the leading product category. Pharmaceutical manufacturers and contract packaging organizations increasingly utilize BFS ampoules for their superior hermetic sealing properties when processed through integrated molding technologies, excellent break-resistance characteristics, and sterility assurance in applications ranging from injectable medication packaging to preservative-free ophthalmic solution containers. BFS ampoule technology's advanced single-dose delivery capabilities and consistent dimensional accuracy directly address the pharmaceutical requirements for reliable drug protection in sterile administration environments.
This product segment forms the foundation of modern aseptic pharmaceutical packaging operations, as it represents the container type with the greatest regulatory acceptance and established clinical demand across multiple therapeutic categories and administration routes. Manufacturer investments in enhanced polymer barrier technologies and automated inspection compatibility continue to strengthen adoption among pharmaceutical producers and specialty drug manufacturers. With companies prioritizing patient safety and manufacturing efficiency, BFS ampoules align with both sterility assurance requirements and production cost optimization objectives, making them the central component of comprehensive pharmaceutical packaging strategies.
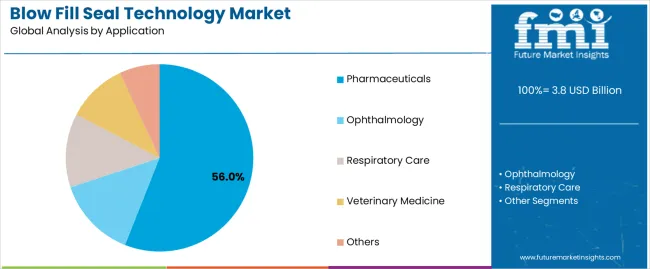
Pharmaceutical applications are projected to represent 56.0% of blow fill seal technology demand in 2025, underscoring their critical role as the primary industrial consumers of BFS manufacturing systems for sterile drug production, injectable medication packaging, and preservative-free pharmaceutical formulation. Pharmaceutical manufacturers prefer BFS technology for their exceptional contamination prevention capabilities, integrated aseptic processing characteristics, and ability to eliminate secondary filling contamination while ensuring regulatory compliance with sterile drug production standards. Positioned as essential manufacturing platforms for modern pharmaceutical operations, BFS systems offer both sterility advantages and production efficiency benefits.
The segment is supported by continuous innovation in process validation methodologies and the growing availability of specialized container designs that enable multi-dose formats with enhanced barrier performance and validated sterilization processes. Pharmaceutical companies are investing in dedicated BFS production lines to support large-volume generic drug manufacturing and specialized therapeutic packaging. As biological drug demand becomes more prevalent and preservative-free formulation requirements increase, pharmaceutical applications will continue to dominate the end-use market while supporting advanced aseptic manufacturing utilization and quality assurance strategies.
The market is advancing rapidly due to increasing demand for sterile pharmaceutical packaging and growing adoption of integrated aseptic manufacturing solutions that provide superior contamination control and process efficiency while enabling preservative-free drug formulations across diverse pharmaceutical and biotechnology production applications. The market faces challenges, including high initial capital investment requirements, polymer material limitation concerns, and the need for specialized validation expertise and regulatory compliance capabilities. Innovation in barrier polymer formulations and multi-chamber container development continues to influence product design and market expansion patterns.
The growing adoption of temperature-controlled processing equipment, protein-compatible polymer formulations, and specialized cooling systems is enabling manufacturers to produce BFS containers suitable for biological products with superior stability characteristics, enhanced compatibility properties, and validated sterilization functionalities. Advanced biological drug systems provide improved product protection while allowing more efficient cold chain integration and consistent performance across various storage conditions and distribution applications. Manufacturers are increasingly recognizing the competitive advantages of biological drug compatible BFS capabilities for therapeutic diversification and premium pharmaceutical positioning.
Modern BFS equipment producers are incorporating automated visual inspection systems, integrated particle detection mechanisms, and real-time process monitoring capabilities to enhance quality assurance, enable regulatory compliance, and deliver value-added solutions to pharmaceutical and contract manufacturing customers. These technologies improve production reliability while enabling new quality control capabilities, including 100% container inspection, defect identification, and automated rejection functionality. Advanced inspection integration also allows manufacturers to support stringent pharmaceutical regulatory requirements and production validation beyond traditional manual inspection approaches.
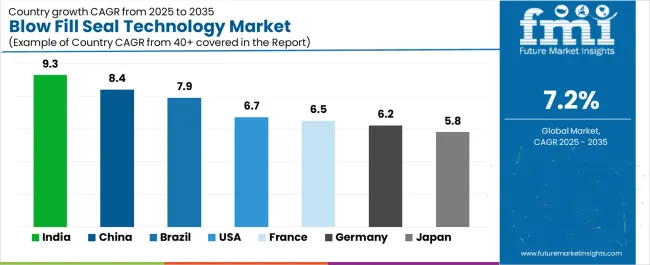
| Country | CAGR (2025-2035) |
|---|---|
| India | 9.3% |
| China | 8.4% |
| USA | 6.7% |
| Brazil | 7.9% |
| Germany | 6.2% |
| Japan | 5.8% |
| France | 6.5% |
The market is experiencing strong growth globally, with India leading at a 9.3% CAGR through 2035, driven by the expanding pharmaceutical manufacturing sector, growing generic drug production capabilities, and significant investment in sterile production infrastructure development. China follows at 8.4%, supported by rapid pharmaceutical industry modernization, increasing biopharmaceutical manufacturing capacity, and growing domestic drug development capabilities. The USA shows growth at 6.7%, emphasizing biological drug production innovation and contract manufacturing development. Brazil records 7.9%, focusing on pharmaceutical market expansion and local generic drug manufacturing growth. Germany demonstrates 6.2% growth, prioritizing pharmaceutical manufacturing excellence and advanced aseptic processing technology. Japan exhibits 5.8% growth, emphasizing precision pharmaceutical packaging and quality sterile production systems. France shows 6.5% growth, supported by pharmaceutical innovation centers and specialty drug manufacturing concentration.
The report covers an in-depth analysis of 40+ countries, Top-performing countries are highlighted below.
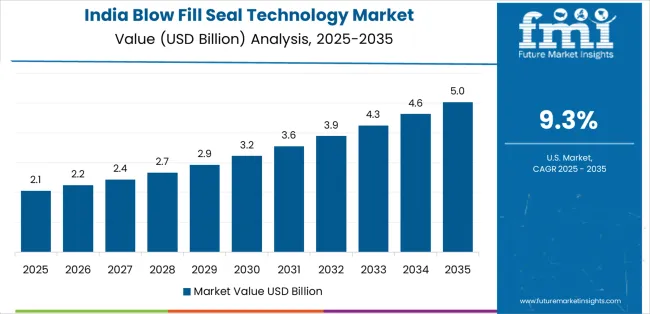
Demand for blow fill seal technology in India is projected to exhibit exceptional growth with a CAGR of 9.3% through 2035, driven by expanding pharmaceutical production capacity and rapidly growing generic drug manufacturing supported by government initiatives promoting domestic pharmaceutical excellence. The country's strong position in sterile injectable production and increasing investment in aseptic manufacturing infrastructure are creating substantial demand for integrated BFS manufacturing solutions. Major pharmaceutical companies and contract manufacturers are establishing comprehensive BFS production capabilities to serve both domestic pharmaceutical demand and global export markets.
Demand for blow fill seal technology in China is expanding at a CAGR of 8.4%, supported by the country's massive pharmaceutical market, expanding biological drug production activities, and increasing adoption of advanced aseptic packaging technologies. The country's government initiatives promoting pharmaceutical quality standards and growing healthcare infrastructure are driving requirements for sophisticated sterile packaging capabilities. International equipment suppliers and domestic technology providers are establishing extensive production and technical service capabilities to address the growing demand for BFS manufacturing systems.
Demand for blow fill seal technology the USA is expanding at a CAGR of 6.7%, supported by the country's advanced pharmaceutical manufacturing capabilities, strong emphasis on biological drug production technologies, and robust demand for high-performance sterile packaging in pharmaceutical and biotechnology applications. The nation's mature pharmaceutical sector and innovation-focused operations are driving sophisticated aseptic BFS systems throughout the production landscape. Leading equipment manufacturers and technology providers are investing extensively in advanced inspection systems and biological drug compatible formulations to serve both domestic and international markets.
The blow fill seal technology industry in Brazil is growing at a CAGR of 7.9%, driven by the country's expanding pharmaceutical industry, growing generic drug manufacturing sector, and increasing investment in sterile production infrastructure development. Brazil's large population base and commitment to healthcare access expansion are supporting demand for affordable pharmaceutical packaging solutions across multiple therapeutic segments. Manufacturers are establishing comprehensive production capabilities to serve the growing domestic market and regional pharmaceutical distribution opportunities.
The blow fill seal technology industry in Germany is expanding at a CAGR of 6.2%, supported by the country's pharmaceutical industry leadership, advanced manufacturing capabilities, and strategic focus on high-quality sterile drug production. Germany's engineering excellence and pharmaceutical innovation are driving demand for BFS systems in specialty drug manufacturing, contract packaging services, and export-oriented pharmaceutical production applications. Manufacturers are investing in comprehensive technology validation capabilities to serve both domestic pharmaceutical companies and international specialty markets.
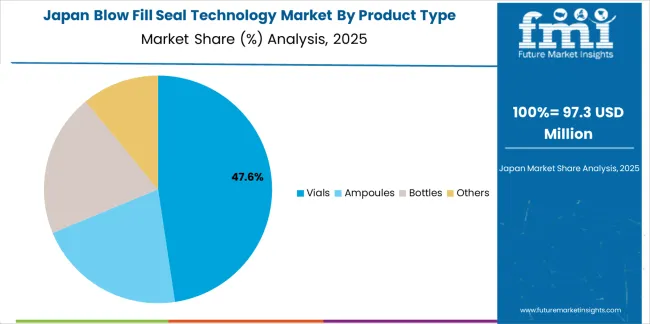
The blow fill seal technology market in Japan is growing at a CAGR of 5.8%, driven by the country's expertise in precision pharmaceutical production, emphasis on quality assurance systems, and strong position in ophthalmic and specialty drug packaging. Japan's established pharmaceutical technology capabilities and commitment to regulatory excellence are supporting investment in advanced BFS manufacturing systems throughout major production centers. Industry leaders are establishing comprehensive validation protocols to serve domestic pharmaceutical requirements and precision drug export markets.
The blow fill seal technology industry in France is expanding at a CAGR of 6.5%, supported by the country's pharmaceutical research concentration, growing biological drug manufacturing sector, and strategic position in European pharmaceutical production networks. France's innovation capabilities and integrated pharmaceutical infrastructure are driving demand for advanced BFS systems in specialty drug packaging, biological product manufacturing, and novel therapeutic delivery applications. Leading manufacturers are investing in specialized processing capabilities to serve the sophisticated requirements of pharmaceutical innovation and specialty production industries.
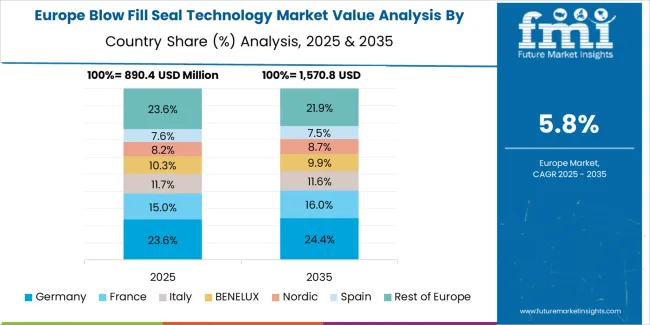
The market in Europe is projected to grow from USD 1.1 billion in 2025 to USD 2.2 billion by 2035, registering a CAGR of 7.4% over the forecast period. Germany is expected to maintain its leadership position with a 33.0% market share in 2025, declining slightly to 32.5% by 2035, supported by its strong pharmaceutical manufacturing industry, advanced aseptic processing capabilities, and comprehensive contract packaging sector serving diverse BFS applications across Europe.
France follows with a 21.0% share in 2025, projected to reach 21.5% by 2035, driven by robust demand for BFS technology in biological drug production, specialty pharmaceutical packaging, and innovative therapeutic delivery applications, combined with established pharmaceutical research infrastructure and contract manufacturing expertise. The United Kingdom holds a 17.0% share in 2025, expected to reach 17.3% by 2035, supported by strong pharmaceutical industry and growing contract manufacturing activities. Italy commands a 12.0% share in 2025, projected to reach 12.2% by 2035, while Spain accounts for 7.5% in 2025, expected to reach 7.8% by 2035. Switzerland maintains a 4.0% share in 2025, growing to 4.2% by 2035. The Rest of Europe region, including Nordic countries, Eastern Europe, Belgium, Netherlands, and other nations, is anticipated to maintain momentum, with its collective share moving from 5.5% to 4.5% by 2035, attributed to increasing pharmaceutical manufacturing in Eastern Europe and growing biological drug production in Nordic countries implementing advanced sterile packaging programs.
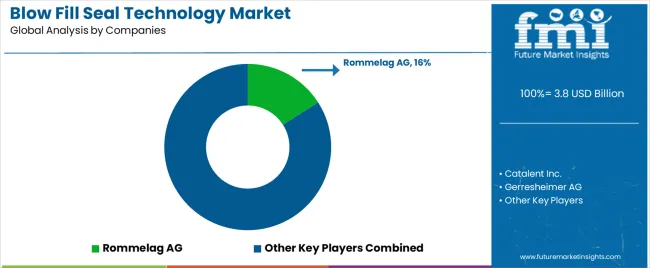
The Blow Fill Seal (BFS) Technology Market features 10–15 players with moderate concentration, where the top three companies collectively hold around 40–48% of global market share, driven by innovative production techniques, stringent regulatory compliance, and long-term relationships with the pharmaceutical and biotechnology industries. The leading company, Rommelag AG, commands 16% of the market share, supported by its pioneering BFS technology used for packaging liquid pharmaceuticals, vaccines, and biologics. Competition focuses on production efficiency, sterility, customization, and scalability rather than price competition.
Market leaders such as Rommelag AG, Catalent Inc., and Gerresheimer AG maintain strong positions by offering advanced BFS systems that allow for sterile, single-dose packaging in a range of formats. Their strengths include cutting-edge manufacturing technology, high-quality production systems, and strong customer relationships with pharmaceutical giants. These companies differentiate by providing customized solutions for high-quality, low-volume production, especially for parenteral drugs, biologics, and vaccines.
Challenger companies like Recipharm AB, Unither Pharmaceuticals, and Weiler Engineering Inc. compete by specializing in niche BFS solutions for specific applications, including small-scale biologics production, sterile liquids, and medical devices.
Additional pressure comes from regional and specialized players such as Takeda Pharmaceutical Company, Nipro Corporation, and The Ritedose Corporation, which strengthen their positions by offering flexible, cost-effective BFS solutions for emerging markets and expanding production capabilities to meet growing demand.
| Items | Values |
|---|---|
| Quantitative Units (2025) | USD 3.8 billion |
| Product Type | Vials, Ampoules, Bottles, Others |
| Application | Pharmaceuticals, Ophthalmology, Respiratory Care, Veterinary Medicine, Others |
| Container Capacity | Small Volume (Less than 10ml), Medium Volume (10-100ml), Large Volume (Above 100ml) |
| Material Type | Polyethylene (PE), Polypropylene (PP), Others |
| End-Use Industry | Pharmaceutical Manufacturing, Contract Packaging, Biotechnology, Others |
| Regions Covered | North America, Europe, East Asia, South Asia & Pacific, Latin America, Middle East & Africa |
| Countries Covered | United States, Canada, United Kingdom, Germany, France, China, Japan, South Korea, India, Brazil, Australia and 40+ countries |
| Key Companies Profiled |
Rommelag AG, Catalent Inc., Gerresheimer AG, Recipharm AB, Unither Pharmaceuticals, Weiler Engineering Inc., Takeda Pharmaceutical Company, Nipro Corporation, The Ritedose Corporation, Asept Pak Inc. |
| Additional Attributes | Dollar sales by product type and application category, regional demand trends, competitive landscape, technological advancements in barrier polymer systems, container design development, inspection equipment innovation, and pharmaceutical manufacturing integration |
Product Type
The global blow fill seal technology market is estimated to be valued at USD 3.8 billion in 2025.
The market size for the blow fill seal technology market is projected to reach USD 7.6 billion by 2035.
The blow fill seal technology market is expected to grow at a 7.2% CAGR between 2025 and 2035.
The key product types in blow fill seal technology market are vials, ampoules, bottles and others.
In terms of application, pharmaceuticals segment to command 56.0% share in the blow fill seal technology market in 2025.


Our Research Products

The "Full Research Suite" delivers actionable market intel, deep dives on markets or technologies, so clients act faster, cut risk, and unlock growth.

The Leaderboard benchmarks and ranks top vendors, classifying them as Established Leaders, Leading Challengers, or Disruptors & Challengers.

Locates where complements amplify value and substitutes erode it, forecasting net impact by horizon

We deliver granular, decision-grade intel: market sizing, 5-year forecasts, pricing, adoption, usage, revenue, and operational KPIs—plus competitor tracking, regulation, and value chains—across 60 countries broadly.

Spot the shifts before they hit your P&L. We track inflection points, adoption curves, pricing moves, and ecosystem plays to show where demand is heading, why it is changing, and what to do next across high-growth markets and disruptive tech

Real-time reads of user behavior. We track shifting priorities, perceptions of today’s and next-gen services, and provider experience, then pace how fast tech moves from trial to adoption, blending buyer, consumer, and channel inputs with social signals (#WhySwitch, #UX).

Partner with our analyst team to build a custom report designed around your business priorities. From analysing market trends to assessing competitors or crafting bespoke datasets, we tailor insights to your needs.
Supplier Intelligence
Discovery & Profiling
Capacity & Footprint
Performance & Risk
Compliance & Governance
Commercial Readiness
Who Supplies Whom
Scorecards & Shortlists
Playbooks & Docs
Category Intelligence
Definition & Scope
Demand & Use Cases
Cost Drivers
Market Structure
Supply Chain Map
Trade & Policy
Operating Norms
Deliverables
Buyer Intelligence
Account Basics
Spend & Scope
Procurement Model
Vendor Requirements
Terms & Policies
Entry Strategy
Pain Points & Triggers
Outputs
Pricing Analysis
Benchmarks
Trends
Should-Cost
Indexation
Landed Cost
Commercial Terms
Deliverables
Brand Analysis
Positioning & Value Prop
Share & Presence
Customer Evidence
Go-to-Market
Digital & Reputation
Compliance & Trust
KPIs & Gaps
Outputs
Full Research Suite comprises of:
Market outlook & trends analysis
Interviews & case studies
Strategic recommendations
Vendor profiles & capabilities analysis
5-year forecasts
8 regions and 60+ country-level data splits
Market segment data splits
12 months of continuous data updates
DELIVERED AS:
PDF EXCEL ONLINE
Blow Fill Seal Technology Industry Analysis in Western Europe Size and Share Forecast Outlook 2025 to 2035
Blow Fill Seal Technology Industry Analysis in Korea Size and Share Forecast Outlook 2025 to 2035
Key Players & Market Share in the Blow-Fill-Seal Technology Industry
Japan Blow Fill Seal Technology Market Insights – Growth & Forecast 2023-2033
Blow-fill-seal Equipment Market Size and Share Forecast Outlook 2025 to 2035
Filling and Sealing Machine Market Size and Share Forecast Outlook 2025 to 2035
Form-Fill-Seal (FFS) Films Market Size and Share Forecast Outlook 2025 to 2035
Pick Fill Seal Machines Market Size, Share & Forecast 2025 to 2035
Form Fill Seal Equipment Market by Equipment Type from 2025 to 2035
Market Positioning & Share in the Form Fill Seal Machine Industry
Market Share Distribution Among Form Fill Seal Equipment Manufacturers
Competitive Overview of Form-Fill-Seal (FFS) Films Suppliers
Form Fill Seal Machine Market Analysis by Semi-automatic and Automatic Through 2034
Cup Fill and Seal Machine Market by Automation Level from 2025 to 2035
Industry Share Analysis for Cup Fill and Seal Machine Companies
Thermoform Fill Sealing Machine Market Size and Share Forecast Outlook 2025 to 2035
Industry Share Analysis for Thermoform Fill Sealing Machine Providers
Carton Form Fill Seal Machine Market
Vertical Form Fill Seal VFFS Machine Market Size and Share Forecast Outlook 2025 to 2035
Tubular Form Fill and Seal Machines Market Size and Share Forecast Outlook 2025 to 2035

Thank you!
You will receive an email from our Business Development Manager. Please be sure to check your SPAM/JUNK folder too.
Chat With
MaRIA