Blow Fill Seal (BFS) Technology Market Size and Share Forecast Outlook in Korea From 2023 to 2033

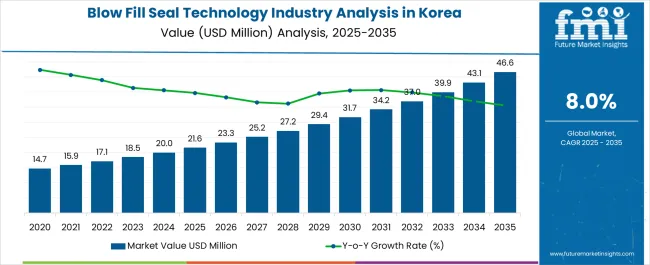
The adoption of blow fill seal (BFS) technology in Korea is poised to surge at an 8.0% CAGR through 2033. Initially, the demand for blow fill seal technology in Korea is projected to increase substantially, surpassing a value of USD 18.5 million in 2023. Looking forward to 2033, the analysis of BFS technology adoption in Korea suggests it is on track to reach a valuation of USD 39.9 million.

Attributes Details
Industry Size in Korea in 2023 USD 18.5 million
Expected Industry Size of Korea by 2033 USD 39.9 million
Forecasted CAGR between 2023 to 2033 8.0%

Top Trends Supporting the Adoption of Blow Fill Seal Technology in Korea Through 2033

  • Korea-based pharmaceutical businesses are rapidly turning to outsourcing and contract manufacturing services. This is pushing BFS technology suppliers to offer a broad portfolio of services to respond to this expanding trend. It is thereby strengthening their competitive position and efficiency.
  • The sudden necessity of vaccine production during the COVID-19 pandemic has highlighted the importance of BFS technology in aseptic vaccine filling. This has resulted in a greater emphasis on using BFS technology for speedy and efficient vaccine production.
  • Businesses use digital twin technology to make virtual clones of their BFS operations to achieve operational excellence. This allows for real-time monitoring, simulations, and predictive maintenance, resulting in more efficient production and less downtime.
  • The integration of BFS technology and pharmaceutical 3D printing is transforming drug production. This cutting-edge technique enables the on-demand manufacturing of personalized dosage forms and medication delivery systems to meet the demands of specific patients.
  • AI and machine learning are being linked into BFS machinery to automate quality control procedures. This helps in spotting abnormalities and forecasting maintenance requirements, ultimately improving operating efficiency and product quality.
  • Sustainability goals in Korea are driving the sourcing of ecologically appropriate raw materials for BFS manufacturing. The primary focus is to reduce environmental impact by using recyclable or biodegradable materials.
  • BFS technology is evolving to complement telehealth activities by enabling aseptic medicine production and direct-to-patient delivery. This method is particularly useful for controlling chronic diseases and increasing patient access to drugs.

Top Market Insights on Emerging Opportunities in Korea’s Blow Fill Seal Technology Market

  • As the field of sophisticated medicines such as gene and cell therapies grows, BFS technology can be used as an aseptic packaging for these sophisticated treatments. This provides unique opportunities for innovation.
  • The global halal and kosher drug industry is expanding. BFS technology vendors in Korea can capitalize on this potential by providing specific, compliant packaging solutions.
  • By integrating IoT and smart packaging capabilities, BFS technology suppliers can capitalize on the increased need for real-time product tracking. This includes remote monitoring and seamless traceability solutions.
  • Exploring prospects in contract manufacturing and outsourcing, focusing on BFS technology, allows businesses to respond to the demands of other players in the pharmaceutical and healthcare industries. This, in turn, boosts corporate growth.
  • The demand for health and wellness supplements is expanding. Korea-based BFS suppliers can look for ways to adapt BFS technology for effective and hygienic product packaging.
  • Korea's clinical trial industry is booming. There is an opportunity to provide specific BFS packaging for clinical trial supplies, improving efficiency and aseptic medication handling.
  • Expanding into cosmetics and beauty product packaging provides BFS technology vendors with new prospects. This leverages the technology's aseptic and efficient properties in Korea's burgeoning beauty sector.

Blow Fill Seal Technology Industry Analysis by Top Investment Segments in Korea

Recyclability Factors of PE Boost Adoption Across Multiple Industries in Korea

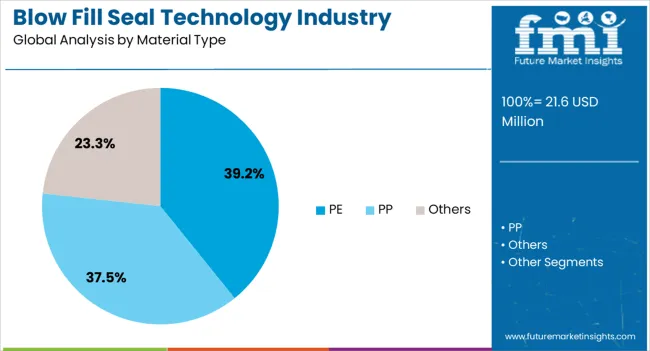
The demand outlook for BFS technology in Korea suggests that polyethylene (PE) is widely preferred, accounting for 60.6% of industry share in 2023. PE's malleability makes it ideal for the complicated molding procedures required in BFS technology. Its ability to be molded into various container forms meets the diverse packaging needs of pharmaceutical products, facilitating flexibility and customization in the manufacturing process.

Leading Material for Blow Fill Seal (BFS) Technology in Korea PE
Total Value Share (2023) 60.6%

The lightweight qualities of PE lead to easier handling and lower transportation costs. Its user-friendly features improve operational efficiency and logistical ease, meeting the demands of standardized supply chain management. Furthermore, many types of PE materials are recyclable, aligning with Korea’s sustainability aims and regulatory requirements for environmentally friendly packaging solutions. This characteristic promotes PE in the BFS technology industry as a sustainable and compliant choice that meets growing environmental criteria.

BFS Technology is Pioneering Customized Solutions for Pharmaceutical Packaging Needs

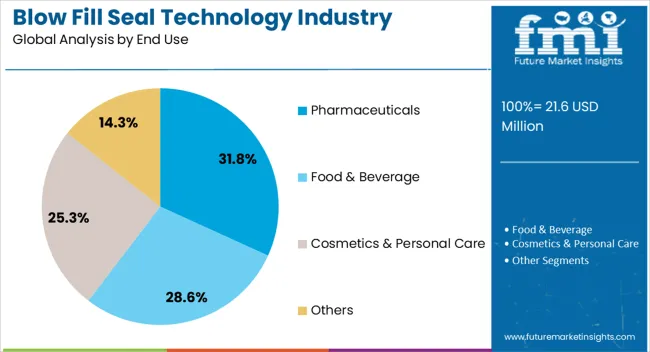
The demand outlook for BFS technology in Korea indicates that pharmaceuticals are the leading end use and captures 97.6% of the industry shares in 2023. The adaptability of BFS technology to meet the demands of the pharmaceutical sector for customized packaging solutions, including variable container sizes, shapes, and volumes, illustrates its versatility. This adaptability is crucial in addressing the diverse needs of the pharmaceutical industry.

Leading End Use for Blow Fill Seal (BFS) Technology in Korea Pharmaceuticals
Total Value Share (2023) 97.6%

The booming pharmaceutical industry in Korea is experiencing an enormous spike in demand for a wide range of pharmaceutical products. The potential of BFS technology to effectively handle this expanding demand, including the manufacturing of over-the-counter and prescription pharmaceuticals, positions it as an invaluable tool for the industry's expansion goals.
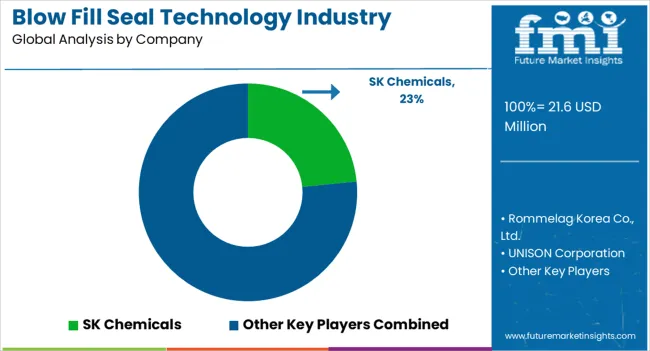
Key Competitive Landscape of Blow Fill Seal Technology in Korea

The competitive landscape of the blow fill seal (BFS) technology industry in Korea is characterized by a mix of international leaders, regional rivals, and adept innovators. Quality, regulatory compliance, and innovation are critical, and firms that excel in these areas are likely to prosper in Korea's competitive pharmaceutical packaging industry. Companies are increasingly focusing on sustainable materials and packaging solutions, which give them a competitive advantage. Sustainability fits with global trends and environmental laws, giving Korea’s eco-friendly BFS providers a competitive edge.

Strategies for Key Players to Tap into Potential Growth Opportunities

  • Prioritize customization capabilities to meet a wide range of customer requirements, particularly in niche sectors such as pediatric pharmaceuticals and customized healthcare.
  • Increase the array of bespoke BFS solutions available to meet the ever-changing demands of the pharmaceutical, cosmetic, and food and beverage sectors.
  • To maintain a competitive advantage, devote resources to research and development, with an emphasis on automation, smart packaging, and sustainable materials.
  • Provide patient-centric, remote healthcare delivery packaging alternatives in order to support the telehealth trend.
  • Streamline manufacturing processes to lower costs, allowing for competitive pricing and profitability.

Recent Developments Observed in Blow Fill Seal (BFS) Technology in Korea

  • West Pharmaceutical Services, Inc. (West), a global leader in innovative injectable drug administration solutions, announced the expansion of its complete containment solution, Ready PackTM, in South Korea in April 2023 at the 18th Korea International CosmeticPharmaceuticalBio Process & Technology Exhibition (COPHEX 2023). Corning® Valor® RTU Vials, which use Stevanato Group's EZ-fill® technology, are included in the expansion.
  • At PackEx India 2022, Jupack, a Korean packaging business, showcased its latest technologies. The firm manufactures a variety of food packaging equipment such as granules, powders, and liquids and provides the whole manufacturing line in a turn-key approach.

Leading Suppliers of Blow Fill Seal (BFS) Technology in Korea

  • SK Chemicals
  • Rommelag Korea Co., Ltd.
  • UNISON Corporation
  • SHINJIN KOREA CO., LTD.
  • Korea BFS Co., Ltd.
  • KORIL
  • Hanmi Pharmaceutical Co., Ltd.
  • HANWHA Corporation
  • Kanglim Co., Ltd.
  • DAIHAN Pharmaceutical Co., Ltd.

Key Shifting Preferences Covered in Korea Blow Fill Seal Technology Market Report

Attribute Details
Estimated Industry Size in 2023 USD 18.5 million
Projected Industry Size by 2033 USD 39.9 million
Anticipated CAGR between 2023 to 2033 8.0% CAGR
Historical Analysis of Demand for Blow Fill Seal (BFS) Technology in Korea 2018 to 2022
Demand Forecast for Blow Fill Seal (BFS) Technology in Korea 2023 to 2033
Report Coverage Industry Size, Industry Trends, Analysis of key factors influencing Blow Fill Seal (BFS) Technology Adoption in Korea, Insights on Global Players and their Industry Strategy in Korea, Ecosystem Analysis of Local and Regional Korean Manufacturers
Key Cities Analyzed While Studying Opportunities in Blow Fill Seal (BFS) Technology in Korea South Gyeongsang, North Jeolla, South Jeolla, Jeju
Key Companies Profiled SK Chemicals; Rommelag Korea Co., Ltd.; UNISON Corporation; SHINJIN KOREA CO., LTD.; Korea BFS Co., Ltd.; KORIL; Hanmi Pharmaceutical Co., Ltd.; HANWHA Corporation; Kanglim Co., Ltd.; DAIHAN Pharmaceutical Co., Ltd.

Top Segments Studied in the Korea Blow Fill Seal Technology Market Research Report

By Product Type:

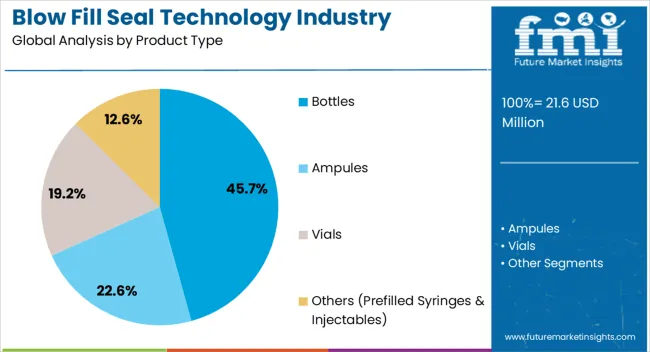
  • Bottles
    • 0.2 to 100 ml
    • 100 to 500 ml
    • Above 500 ml
  • Ampules
    • 0.1 to 10 ml
    • 10 to 100 ml
  • Vials
    • 0.1 to 10 ml
    • 10 ml to 50 ml
  • Others (Prefilled Syringes & Injectables)

By Material Type:

  • PE
    • LDPE
    • HDPE
  • PP
  • Others

By End Use:

  • Pharmaceuticals
    • Ophthalmic
    • Injectables
    • Biologics
    • Wound Care
    • Respiratory
  • Food & Beverage
  • Cosmetics & Personal Care
  • Others

By Cities/Provinces:

  • South Gyeongsang
  • North Jeolla
  • South Jeolla
  • Jeju

Table of Content

  • 1. Executive Summary
  • 2. Market Overview
  • 3. Market Background
  • 4. Industry Analysis and Outlook 2018 to 2022 and Forecast, 2023 to 2033
  • 5. Industry Analysis and Outlook 2018 to 2022 and Forecast 2023 to 2033, By Product Type
    • 5.1. Bottles
      • 5.1.1. 0.2-100ML
      • 5.1.2. 100-500ML
      • 5.1.3. Above 500ml
    • 5.2. Ampules
      • 5.2.1. 0.1-10ml
      • 5.2.2. 10-100ml
    • 5.3. Vials
      • 5.3.1. 0.1-10ml
      • 5.3.2. 10-50ml
    • 5.4. Others (prefilled syringes & Injectables)
  • 6. Industry Analysis and Outlook 2018 to 2022 and Forecast 2023 to 2033, By Material
    • 6.1. PE
      • 6.1.1. LDPE
      • 6.1.2. HDPE
    • 6.2. PP
    • 6.3. Others
  • 7. Industry Analysis and Outlook 2018 to 2022 and Forecast 2023 to 2033, By End Use
    • 7.1. Pharmaceuticals
      • 7.1.1. Ophthalmic
      • 7.1.2. Injectables
      • 7.1.3. Biologics
      • 7.1.4. Wound Care
      • 7.1.5. Respiratory
    • 7.2. Food & Beverage
    • 7.3. Cosmetics & Personal Care
    • 7.4. Others
  • 8. Industry Analysis and Outlook 2018 to 2022 and Forecast 2023 to 2033, By Region
    • 8.1. South Gyeongsang
    • 8.2. North Jeolla
    • 8.3. South Jeolla
    • 8.4. Jeju
    • 8.5. Rest of Korea
  • 9. South Gyeongsang Industry Analysis and Outlook 2018 to 2022 and Forecast 2023 to 2033
  • 10. North Jeolla Industry Analysis and Outlook 2018 to 2022 and Forecast 2023 to 2033
  • 11. South Jeolla Industry Analysis and Outlook 2018 to 2022 and Forecast 2023 to 2033
  • 12. Jeju Industry Analysis and Outlook 2018 to 2022 and Forecast 2023 to 2033
  • 13. Rest of Industry Analysis and Outlook 2018 to 2022 and Forecast 2023 to 2033
  • 14. Market Structure Analysis
  • 15. Competition Analysis
    • 15.1. Unither Pharmaceuticals
    • 15.2. HealthStar
    • 15.3. SIFI Spa
    • 15.4. QuadroPack
    • 15.5. Weiler Engineering Inc.
    • 15.6. GlaxoSmithKline plc
    • 15.7. Takeda Pharmaceuticals International AG
    • 15.8. Nephron Pharmaceuticals Corporation
    • 15.9. Horizon Pharmaceutical Inc
    • 15.10. Brevetti Angela S.R.L
    • 15.11. Recipharm AB
    • 15.12. Laboratorios SALVAT, S.A
    • 15.13. The Ritedose Corporation
    • 15.14. Unicep Packaging, LLC
    • 15.15. Pharmapack Co. Ltd
  • 16. Assumptions & Acronyms Used
  • 17. Research Methodology

List of Tables

Table 1: Industry Analysis and Outlook Value (US$ Million) Forecast by Region, 2018 to 2033

Table 2: Industry Analysis and Outlook Volume (Units) Forecast by Region, 2018 to 2033

Table 3: Industry Analysis and Outlook Value (US$ Million) Forecast by Product Type, 2018 to 2033

Table 4: Industry Analysis and Outlook Volume (Units) Forecast by Product Type, 2018 to 2033

Table 5: Industry Analysis and Outlook Value (US$ Million) Forecast by Material Type, 2018 to 2033

Table 6: Industry Analysis and Outlook Volume (Units) Forecast by Material Type, 2018 to 2033

Table 7: Industry Analysis and Outlook Value (US$ Million) Forecast by End Use, 2018 to 2033

Table 8: Industry Analysis and Outlook Volume (Units) Forecast by End Use, 2018 to 2033

Table 9: South Gyeongsang Industry Analysis and Outlook Value (US$ Million) Forecast by Product Type, 2018 to 2033

Table 10: South Gyeongsang Industry Analysis and Outlook Volume (Units) Forecast by Product Type, 2018 to 2033

Table 11: South Gyeongsang Industry Analysis and Outlook Value (US$ Million) Forecast by Material Type, 2018 to 2033

Table 12: South Gyeongsang Industry Analysis and Outlook Volume (Units) Forecast by Material Type, 2018 to 2033

Table 13: South Gyeongsang Industry Analysis and Outlook Value (US$ Million) Forecast by End Use, 2018 to 2033

Table 14: South Gyeongsang Industry Analysis and Outlook Volume (Units) Forecast by End Use, 2018 to 2033

Table 15: North Jeolla Industry Analysis and Outlook Value (US$ Million) Forecast by Product Type, 2018 to 2033

Table 16: North Jeolla Industry Analysis and Outlook Volume (Units) Forecast by Product Type, 2018 to 2033

Table 17: North Jeolla Industry Analysis and Outlook Value (US$ Million) Forecast by Material Type, 2018 to 2033

Table 18: North Jeolla Industry Analysis and Outlook Volume (Units) Forecast by Material Type, 2018 to 2033

Table 19: North Jeolla Industry Analysis and Outlook Value (US$ Million) Forecast by End Use, 2018 to 2033

Table 20: North Jeolla Industry Analysis and Outlook Volume (Units) Forecast by End Use, 2018 to 2033

Table 21: South Jeolla Industry Analysis and Outlook Value (US$ Million) Forecast by Product Type, 2018 to 2033

Table 22: South Jeolla Industry Analysis and Outlook Volume (Units) Forecast by Product Type, 2018 to 2033

Table 23: South Jeolla Industry Analysis and Outlook Value (US$ Million) Forecast by Material Type, 2018 to 2033

Table 24: South Jeolla Industry Analysis and Outlook Volume (Units) Forecast by Material Type, 2018 to 2033

Table 25: South Jeolla Industry Analysis and Outlook Value (US$ Million) Forecast by End Use, 2018 to 2033

Table 26: South Jeolla Industry Analysis and Outlook Volume (Units) Forecast by End Use, 2018 to 2033

Table 27: Jeju Industry Analysis and Outlook Value (US$ Million) Forecast by Product Type, 2018 to 2033

Table 28: Jeju Industry Analysis and Outlook Volume (Units) Forecast by Product Type, 2018 to 2033

Table 29: Jeju Industry Analysis and Outlook Value (US$ Million) Forecast by Material Type, 2018 to 2033

Table 30: Jeju Industry Analysis and Outlook Volume (Units) Forecast by Material Type, 2018 to 2033

Table 31: Jeju Industry Analysis and Outlook Value (US$ Million) Forecast by End Use, 2018 to 2033

Table 32: Jeju Industry Analysis and Outlook Volume (Units) Forecast by End Use, 2018 to 2033

Table 33: Rest of Industry Analysis and Outlook Value (US$ Million) Forecast by Product Type, 2018 to 2033

Table 34: Rest of Industry Analysis and Outlook Volume (Units) Forecast by Product Type, 2018 to 2033

Table 35: Rest of Industry Analysis and Outlook Value (US$ Million) Forecast by Material Type, 2018 to 2033

Table 36: Rest of Industry Analysis and Outlook Volume (Units) Forecast by Material Type, 2018 to 2033

Table 37: Rest of Industry Analysis and Outlook Value (US$ Million) Forecast by End Use, 2018 to 2033

Table 38: Rest of Industry Analysis and Outlook Volume (Units) Forecast by End Use, 2018 to 2033

List of Figures

Figure 1: Industry Analysis and Outlook Value (US$ Million) by Product Type, 2023 to 2033

Figure 2: Industry Analysis and Outlook Value (US$ Million) by Material Type, 2023 to 2033

Figure 3: Industry Analysis and Outlook Value (US$ Million) by End Use, 2023 to 2033

Figure 4: Industry Analysis and Outlook Value (US$ Million) by Region, 2023 to 2033

Figure 5: Industry Analysis and Outlook Value (US$ Million) Analysis by Region, 2018 to 2033

Figure 6: Industry Analysis and Outlook Volume (Units) Analysis by Region, 2018 to 2033

Figure 7: Industry Analysis and Outlook Value Share (%) and BPS Analysis by Region, 2023 to 2033

Figure 8: Industry Analysis and Outlook Y-o-Y Growth (%) Projections by Region, 2023 to 2033

Figure 9: Industry Analysis and Outlook Value (US$ Million) Analysis by Product Type, 2018 to 2033

Figure 10: Industry Analysis and Outlook Volume (Units) Analysis by Product Type, 2018 to 2033

Figure 11: Industry Analysis and Outlook Value Share (%) and BPS Analysis by Product Type, 2023 to 2033

Figure 12: Industry Analysis and Outlook Y-o-Y Growth (%) Projections by Product Type, 2023 to 2033

Figure 13: Industry Analysis and Outlook Value (US$ Million) Analysis by Material Type, 2018 to 2033

Figure 14: Industry Analysis and Outlook Volume (Units) Analysis by Material Type, 2018 to 2033

Figure 15: Industry Analysis and Outlook Value Share (%) and BPS Analysis by Material Type, 2023 to 2033

Figure 16: Industry Analysis and Outlook Y-o-Y Growth (%) Projections by Material Type, 2023 to 2033

Figure 17: Industry Analysis and Outlook Value (US$ Million) Analysis by End Use, 2018 to 2033

Figure 18: Industry Analysis and Outlook Volume (Units) Analysis by End Use, 2018 to 2033

Figure 19: Industry Analysis and Outlook Value Share (%) and BPS Analysis by End Use, 2023 to 2033

Figure 20: Industry Analysis and Outlook Y-o-Y Growth (%) Projections by End Use, 2023 to 2033

Figure 21: Industry Analysis and Outlook Attractiveness by Product Type, 2023 to 2033

Figure 22: Industry Analysis and Outlook Attractiveness by Material Type, 2023 to 2033

Figure 23: Industry Analysis and Outlook Attractiveness by End Use, 2023 to 2033

Figure 24: Industry Analysis and Outlook Attractiveness by Region, 2023 to 2033

Figure 25: South Gyeongsang Industry Analysis and Outlook Value (US$ Million) by Product Type, 2023 to 2033

Figure 26: South Gyeongsang Industry Analysis and Outlook Value (US$ Million) by Material Type, 2023 to 2033

Figure 27: South Gyeongsang Industry Analysis and Outlook Value (US$ Million) by End Use, 2023 to 2033

Figure 28: South Gyeongsang Industry Analysis and Outlook Value (US$ Million) Analysis by Product Type, 2018 to 2033

Figure 29: South Gyeongsang Industry Analysis and Outlook Volume (Units) Analysis by Product Type, 2018 to 2033

Figure 30: South Gyeongsang Industry Analysis and Outlook Value Share (%) and BPS Analysis by Product Type, 2023 to 2033

Figure 31: South Gyeongsang Industry Analysis and Outlook Y-o-Y Growth (%) Projections by Product Type, 2023 to 2033

Figure 32: South Gyeongsang Industry Analysis and Outlook Value (US$ Million) Analysis by Material Type, 2018 to 2033

Figure 33: South Gyeongsang Industry Analysis and Outlook Volume (Units) Analysis by Material Type, 2018 to 2033

Figure 34: South Gyeongsang Industry Analysis and Outlook Value Share (%) and BPS Analysis by Material Type, 2023 to 2033

Figure 35: South Gyeongsang Industry Analysis and Outlook Y-o-Y Growth (%) Projections by Material Type, 2023 to 2033

Figure 36: South Gyeongsang Industry Analysis and Outlook Value (US$ Million) Analysis by End Use, 2018 to 2033

Figure 37: South Gyeongsang Industry Analysis and Outlook Volume (Units) Analysis by End Use, 2018 to 2033

Figure 38: South Gyeongsang Industry Analysis and Outlook Value Share (%) and BPS Analysis by End Use, 2023 to 2033

Figure 39: South Gyeongsang Industry Analysis and Outlook Y-o-Y Growth (%) Projections by End Use, 2023 to 2033

Figure 40: South Gyeongsang Industry Analysis and Outlook Attractiveness by Product Type, 2023 to 2033

Figure 41: South Gyeongsang Industry Analysis and Outlook Attractiveness by Material Type, 2023 to 2033

Figure 42: South Gyeongsang Industry Analysis and Outlook Attractiveness by End Use, 2023 to 2033

Figure 43: North Jeolla Industry Analysis and Outlook Value (US$ Million) by Product Type, 2023 to 2033

Figure 44: North Jeolla Industry Analysis and Outlook Value (US$ Million) by Material Type, 2023 to 2033

Figure 45: North Jeolla Industry Analysis and Outlook Value (US$ Million) by End Use, 2023 to 2033

Figure 46: North Jeolla Industry Analysis and Outlook Value (US$ Million) Analysis by Product Type, 2018 to 2033

Figure 47: North Jeolla Industry Analysis and Outlook Volume (Units) Analysis by Product Type, 2018 to 2033

Figure 48: North Jeolla Industry Analysis and Outlook Value Share (%) and BPS Analysis by Product Type, 2023 to 2033

Figure 49: North Jeolla Industry Analysis and Outlook Y-o-Y Growth (%) Projections by Product Type, 2023 to 2033

Figure 50: North Jeolla Industry Analysis and Outlook Value (US$ Million) Analysis by Material Type, 2018 to 2033

Figure 51: North Jeolla Industry Analysis and Outlook Volume (Units) Analysis by Material Type, 2018 to 2033

Figure 52: North Jeolla Industry Analysis and Outlook Value Share (%) and BPS Analysis by Material Type, 2023 to 2033

Figure 53: North Jeolla Industry Analysis and Outlook Y-o-Y Growth (%) Projections by Material Type, 2023 to 2033

Figure 54: North Jeolla Industry Analysis and Outlook Value (US$ Million) Analysis by End Use, 2018 to 2033

Figure 55: North Jeolla Industry Analysis and Outlook Volume (Units) Analysis by End Use, 2018 to 2033

Figure 56: North Jeolla Industry Analysis and Outlook Value Share (%) and BPS Analysis by End Use, 2023 to 2033

Figure 57: North Jeolla Industry Analysis and Outlook Y-o-Y Growth (%) Projections by End Use, 2023 to 2033

Figure 58: North Jeolla Industry Analysis and Outlook Attractiveness by Product Type, 2023 to 2033

Figure 59: North Jeolla Industry Analysis and Outlook Attractiveness by Material Type, 2023 to 2033

Figure 60: North Jeolla Industry Analysis and Outlook Attractiveness by End Use, 2023 to 2033

Figure 61: South Jeolla Industry Analysis and Outlook Value (US$ Million) by Product Type, 2023 to 2033

Figure 62: South Jeolla Industry Analysis and Outlook Value (US$ Million) by Material Type, 2023 to 2033

Figure 63: South Jeolla Industry Analysis and Outlook Value (US$ Million) by End Use, 2023 to 2033

Figure 64: South Jeolla Industry Analysis and Outlook Value (US$ Million) Analysis by Product Type, 2018 to 2033

Figure 65: South Jeolla Industry Analysis and Outlook Volume (Units) Analysis by Product Type, 2018 to 2033

Figure 66: South Jeolla Industry Analysis and Outlook Value Share (%) and BPS Analysis by Product Type, 2023 to 2033

Figure 67: South Jeolla Industry Analysis and Outlook Y-o-Y Growth (%) Projections by Product Type, 2023 to 2033

Figure 68: South Jeolla Industry Analysis and Outlook Value (US$ Million) Analysis by Material Type, 2018 to 2033

Figure 69: South Jeolla Industry Analysis and Outlook Volume (Units) Analysis by Material Type, 2018 to 2033

Figure 70: South Jeolla Industry Analysis and Outlook Value Share (%) and BPS Analysis by Material Type, 2023 to 2033

Figure 71: South Jeolla Industry Analysis and Outlook Y-o-Y Growth (%) Projections by Material Type, 2023 to 2033

Figure 72: South Jeolla Industry Analysis and Outlook Value (US$ Million) Analysis by End Use, 2018 to 2033

Figure 73: South Jeolla Industry Analysis and Outlook Volume (Units) Analysis by End Use, 2018 to 2033

Figure 74: South Jeolla Industry Analysis and Outlook Value Share (%) and BPS Analysis by End Use, 2023 to 2033

Figure 75: South Jeolla Industry Analysis and Outlook Y-o-Y Growth (%) Projections by End Use, 2023 to 2033

Figure 76: South Jeolla Industry Analysis and Outlook Attractiveness by Product Type, 2023 to 2033

Figure 77: South Jeolla Industry Analysis and Outlook Attractiveness by Material Type, 2023 to 2033

Figure 78: South Jeolla Industry Analysis and Outlook Attractiveness by End Use, 2023 to 2033

Figure 79: Jeju Industry Analysis and Outlook Value (US$ Million) by Product Type, 2023 to 2033

Figure 80: Jeju Industry Analysis and Outlook Value (US$ Million) by Material Type, 2023 to 2033

Figure 81: Jeju Industry Analysis and Outlook Value (US$ Million) by End Use, 2023 to 2033

Figure 82: Jeju Industry Analysis and Outlook Value (US$ Million) Analysis by Product Type, 2018 to 2033

Figure 83: Jeju Industry Analysis and Outlook Volume (Units) Analysis by Product Type, 2018 to 2033

Figure 84: Jeju Industry Analysis and Outlook Value Share (%) and BPS Analysis by Product Type, 2023 to 2033

Figure 85: Jeju Industry Analysis and Outlook Y-o-Y Growth (%) Projections by Product Type, 2023 to 2033

Figure 86: Jeju Industry Analysis and Outlook Value (US$ Million) Analysis by Material Type, 2018 to 2033

Figure 87: Jeju Industry Analysis and Outlook Volume (Units) Analysis by Material Type, 2018 to 2033

Figure 88: Jeju Industry Analysis and Outlook Value Share (%) and BPS Analysis by Material Type, 2023 to 2033

Figure 89: Jeju Industry Analysis and Outlook Y-o-Y Growth (%) Projections by Material Type, 2023 to 2033

Figure 90: Jeju Industry Analysis and Outlook Value (US$ Million) Analysis by End Use, 2018 to 2033

Figure 91: Jeju Industry Analysis and Outlook Volume (Units) Analysis by End Use, 2018 to 2033

Figure 92: Jeju Industry Analysis and Outlook Value Share (%) and BPS Analysis by End Use, 2023 to 2033

Figure 93: Jeju Industry Analysis and Outlook Y-o-Y Growth (%) Projections by End Use, 2023 to 2033

Figure 94: Jeju Industry Analysis and Outlook Attractiveness by Product Type, 2023 to 2033

Figure 95: Jeju Industry Analysis and Outlook Attractiveness by Material Type, 2023 to 2033

Figure 96: Jeju Industry Analysis and Outlook Attractiveness by End Use, 2023 to 2033

Figure 97: Rest of Industry Analysis and Outlook Value (US$ Million) by Product Type, 2023 to 2033

Figure 98: Rest of Industry Analysis and Outlook Value (US$ Million) by Material Type, 2023 to 2033

Figure 99: Rest of Industry Analysis and Outlook Value (US$ Million) by End Use, 2023 to 2033

Figure 100: Rest of Industry Analysis and Outlook Value (US$ Million) Analysis by Product Type, 2018 to 2033

Figure 101: Rest of Industry Analysis and Outlook Volume (Units) Analysis by Product Type, 2018 to 2033

Figure 102: Rest of Industry Analysis and Outlook Value Share (%) and BPS Analysis by Product Type, 2023 to 2033

Figure 103: Rest of Industry Analysis and Outlook Y-o-Y Growth (%) Projections by Product Type, 2023 to 2033

Figure 104: Rest of Industry Analysis and Outlook Value (US$ Million) Analysis by Material Type, 2018 to 2033

Figure 105: Rest of Industry Analysis and Outlook Volume (Units) Analysis by Material Type, 2018 to 2033

Figure 106: Rest of Industry Analysis and Outlook Value Share (%) and BPS Analysis by Material Type, 2023 to 2033

Figure 107: Rest of Industry Analysis and Outlook Y-o-Y Growth (%) Projections by Material Type, 2023 to 2033

Figure 108: Rest of Industry Analysis and Outlook Value (US$ Million) Analysis by End Use, 2018 to 2033

Figure 109: Rest of Industry Analysis and Outlook Volume (Units) Analysis by End Use, 2018 to 2033

Figure 110: Rest of Industry Analysis and Outlook Value Share (%) and BPS Analysis by End Use, 2023 to 2033

Figure 111: Rest of Industry Analysis and Outlook Y-o-Y Growth (%) Projections by End Use, 2023 to 2033

Figure 112: Rest of Industry Analysis and Outlook Attractiveness by Product Type, 2023 to 2033

Figure 113: Rest of Industry Analysis and Outlook Attractiveness by Material Type, 2023 to 2033

Figure 114: Rest of Industry Analysis and Outlook Attractiveness by End Use, 2023 to 2033

Frequently Asked Questions

How Rapidly is the Demand for Blow Fill Seal (BFS) Technology in Korea is Likely to Grow? 

The expected CAGR for BFS technology in Korea through 2033 stands at a remarkable 8.0%.

What is the Demand Outlook for Blow Fill Seal (BFS) Technology in Korea?

Anticipated demand for BFS technology in Korea is projected to reach USD 39.9 million by 2033.

Which Trends Influence the Demand for Blow Fill Seal (BFS) Technology in Korea?

The rising pharmaceutical industry expansion drives the demand for blow fill seal technology in Korea.

What Strategies are used by Blow Fill Seal (BFS) Technology Providers in Korea?

BFS technology providers emphasize innovation by incorporating cutting-edge technologies.

What is the Preferred Material Type in Blow Fill Seal (BFS) Technology in Korea?

Polyethylene (PE) is the preferred material type in BFS technology in Korea.

Explore Packaging Machinery Insights

Future Market Insights

Blow Fill Seal Technology Industry Analysis in Korea