Reports

- Global Locations -

Headquarters

Future Market Insights, Inc.

Christiana Corporate, 200
Continental Drive, Suite 401,
Newark, Delaware - 19713,
United States

T: +1-845-579-5705

Americas

Future Market Insights, Inc.

616 Corporate Way, Suite 2-9018,
Valley Cottage, NY 10989, United States

T: +1-347-918-3531

MEA

Future Market Insights

1602-6 Jumeirah Bay X2 Tower, Plot No: JLT-PH2-X2A,
Jumeirah Lakes Towers, Dubai,
United Arab Emirates

Europe

Future Market Insights

3rd Floor, 207 Regent Street,
W1B 3HH London
United Kingdom

T: + 44 (0) 20 8123 9659
D: +44 (0) 20 3287 4268

Asia Pacific

Future Market Insights

IndiaLand Global Tech Park, Unit UG-1, Behind Grand HighStreet, Phase 1, Hinjawadi, MH, Pune – 411057, India

Blow Molded Bottles Market Snapshot (2023 to 2033)

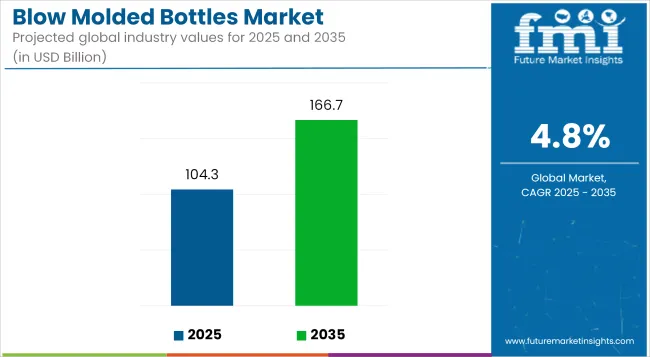
The global blow molded bottles market size is estimated to reach a valuation of US$ 94.6 billion by the end of 2023. Furthermore, the global sales of blow molded bottles are expected to accelerate at a CAGR of 4.8% from 2023 to 2033. The global blow molded bottles market is expected to create a market opportunity of US$ 151.2 billion by the end of 2033.

Increasing capacity addition activities in high-growth regions, including Asia Pacific and the Middle East & Africa is a key factor that might drive the market. These regions are anticipated to create a consistent demand for blow molded bottles in addition to lowering the overall manufacturing cost.

Several manufacturers are looking for new machines that can provide maximum flexibility, greater cost efficiency, and high accuracy to accelerate the constantly surging cost of production from numerous demanding application industries such as food & beverage and pharmaceuticals.

Increasing demand for the extrusion blow molding technology across the globe owing to its relatively low cost, as compared to injection blow mold is set to aid growth. Further, the technology also requires low pressure and makes molding external threads easy.

Injection blow molding, on the other hand, helps in manufacturing complex products in various shapes and designs that could be otherwise difficult or impossible with other technologies. The process further allows organizations to surge their production output in a short period along with flexibility in terms of materials and design.

Attribute Details
Global Blow Molded Bottles Market Valuation in 2022 US$ 90.3 billion
Estimated Global Market Share in 2023 US$ 94.6 billion
Forecasted Global Market Size by 2033 US$ 151.2 billion
Projected Global Market Growth Rate from 2023 to 2033 4.8% CAGR
Historical Market Growth Rate from 2018 to 2022 4.2% CAGR
Collective Value Share of 3 Top Performing Countries in 2022 35% to 45%

Don't pay for what you don't need

Customize your report by selecting specific countries or regions and save 30%!

2018 to 2022 Global Blow Molded Bottles Demand Outlook Compared to 2023 to 2033 Forecast

The global blow molded bottles market registered a CAGR of 4.2% during the historic period of 2018 to 2022. As per FMI, the market reached around US$ 90.3 billion by the end of 2022. Extrusion, injection, and injection stretch blow molding are the three primary categories of blow molding techniques.

Increased demand from the packaging industry is a key driver fueling growth in the global blow molded bottles market. Furthermore, the market is projected to have profitable growth prospects due to the expanded application range and rising demand from emerging nations.

The market for blow molded bottles has expanded significantly as a result of the rising demand for pharmaceutical products, which has increased the use of these bottles. Additionally, the low cost of blow molded bottles is set to create a sizable market potential for leading players worldwide.

Top 2 Trends Pushing Growth in the Blow Molded Bottles Market

High Demand for Sustainable Packaging Solutions to Boost Blow Molded Bottles Market

Key participants in the global market are concentrating on product innovation, technological breakthroughs, and the adoption of recyclable & environment-friendly packaging options. They can adapt to the constantly shifting dynamics of the packaging sector, which is constrained by a variety of norms.

Regulation and enforcement of laws regarding the use of plastics have had a negative impact on the packaging industry as a whole. These laws call for sustainable packaging solutions, which puts pressure on manufacturers to make significant investments in the creation of biodegradable and affordable packaging solutions.

As per FMI, global demand for applications of sustainable food & beverage packaging is likely to increase. Further, the expansion of new markets, changes in consumer preferences, and the development of retail & e-commerce channels have all contributed to notable growth of the global market.

Increasing Need for Ready-to-eat Food Items to Push Sales in the Blow Molded Bottles Market

The global market is dominated by the food and beverage industry and it holds over 70% of the share due to shifting customer preference for practical and environment-friendly packaging options. Also, fast-paced consumer lifestyles are driving the demand for packaged, ready-to-eat, and simple-to-make foods & beverage bottles. Sustainable food packaging solutions are required due to dietary changes and rising demand for convenience globally.

Different consumer preferences have led to the development of a wide range of products and constant innovation in the food and beverage industry. The shelf life of food products can be extended by using blow-molded bottles, which also ensure their safety during transportation. In addition, blow-molded bottle producers are anticipated to benefit from the phenomenal rise of the food sector and the high flexibility of plastic packaging solutions.

Ismail Sutaria
Ismail Sutaria

Principal Consultant

Talk to Analyst

Find your sweet spots for generating winning opportunities in this market.

Country-wise Insights

Expansion of the United States Packaging Industry Drive Sales of PET Bottle Blowing Machines

According to the Information Technology and Innovation Foundation’s Report, the United States is making huge technological innovations in terms of product variety to increase production in the packaging industry as e-commerce, which has exhibited tremendous growth. The United States packaging market has encouraged manufacturers to launch new innovative bottles to increase sales of blow molded bottles.

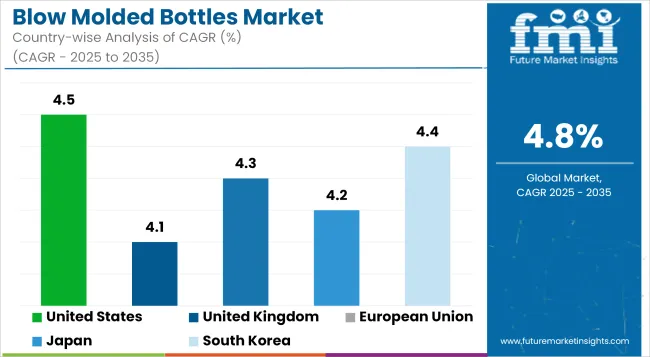
Surging demand for e-commerce is also helping the packaging industry to expand significantly in the country, which could contribute to growth in the market for blow molded bottles. Thus, the United States' blow molded bottles market is expected to witness a CAGR of 4.0% in the forecast period.

Demand for PET Molding to Surge in India amid Expansion of the Pharmaceutical Industry

According to the Department of Pharmaceuticals, the Indian pharmaceutical sector is the third-largest by volume and fourteenth-largest in terms of value. As the pharmaceutical segment grows, the need for cost-effective solutions is also set to surge. Hence, blow molding is relatively low-cost, as compared to injection molding. Hence, India’s blow molded bottles market is expected to create an incremental opportunity of US$ 6.1 billion by 2033.

Category-wise Insights

Plastic is the Highly Preferred Material in the Global Blow Molded Bottles Market

Renowned Manufacturers to Extensively Utilize Plastic Bottle Molds

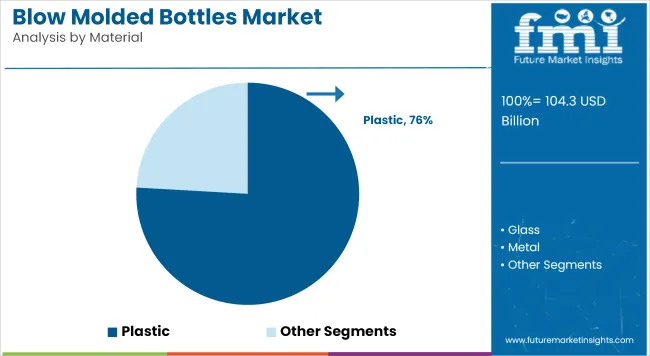
The plastic segment based on material is expected to account for a notable share and develop at a CAGR of 4.6% during the forecast period. Growth is attributed to the increasing utilization of different types of plastics like polystyrene in the packaging industry.

Low-density polyethylene offers the efficiency of the fuel and helps in improving the performance of machinery, which further aids in decreasing carbon emissions. Moreover, key players in the packaging sector are gradually replacing metal and glass with plastic to reduce the overall weight of the finished product and cut off carbon emissions.

Laws implemented by various governing organizations to reduce carbon footprints through weight reduction are expected to strengthen the segment. Similar initiatives combined with evolving technologies are also expected to boost the demand for plastic materials.

The Food & Beverage End Use Segment is Projected to Lead the Blow Molded Bottles Market

Food and Beverage Companies Are Looking for Bottle Molding Machines

Based on end use, food & beverage is the leading segment in the global blow molded bottles market. The segment is expected to reach a valuation of US$ 58 billion by the end of 2033, reports FMI.

Blow-molded bottles are likely to exhibit high demand worldwide, with significant growth in the consumption of packaged food & beverages. Consumers have become particular about the packaging of their food items to ensure safety. Blow molded bottles are perfect when it comes to the safety of the ingredients present in the product. These factors are estimated to drive the segment in the market for blow molded bottles in the upcoming decade.

Get the data you need at a Fraction of the cost

Personalize your report by choosing insights you need
and save 40%!

Competitive Scenario

Key players in the blow molded bottles market are expanding their production capabilities by strategically attending events and conferences to meet the growing demand. They are also entering into new deals by engaging in mergers and collaborations to strengthen their position in the market.

Some of the other companies are investing huge sums in research & development activities to accelerate innovation and technological development for upgrading their products with additional features.

Recent Developments in the Market

  • In April 2021, with the acquisition of Boxmore Plastics, Alpha Packaging continued its expansion in Europe to broaden the product portfolio for its customers.
  • In July 2020, Berry Global, Inc. announced its completion of the acquisition with RPC Group Plc to reduce the operational cost and integration in the value chain.

Plastipak, RETAL, and Amcor Embrace Sustainability while Expanding Aggressively to Boost Blow Molded Bottle Manufacturing

Expand aggressively while ensuring sustainability - this seems to be the mantra for blow molded bottle manufacturers. Plastipak, RETAL, and Amcor are the three most prominent blow molded bottle manufacturers. They are ensuring to consolidate their position without losing sight of their sustainability goals.

Plastipak is on an expansion spree, opening new manufacturing units and expanding the existing ones. However, concurrently, it is focusing on how new bottles can be manufactured from solid waste. For instance,

  • In May 2021, the company announced a significant investment at its manufacturing site in Toledo, Spain. The site, which is likely to commence production later this year, has a capacity of producing 20,000 tons of food-grade pellets per year.

Plastipak is considered to be the leading manufacturer of bottle-grade recycled PET in Europe. The company's annual production of recycled PET in the region is a whopping 130,000 tons, thereby putting it at the forefront of sustainability initiatives in the bottle manufacturing space.

The company announced the expansion of its North Texas manufacturing facility, increasing it by over 70,000 square feet. It has a strong presence all over the globe and is set to further bolster its position in the next decade.

Amcor, on the other hand, is focusing on accelerating cutting-edge innovation that paves the way for recycling on a mass scale to drive its sustainability initiatives. It is investing mainly in innovative techniques and equipment to bolster its perception among consumers and regulatory bodies. For instance,

  • The company developed a path-breaking solution to the longstanding problem of PET bottles getting accumulated after a single use. It came up with a bottle design in 2021 that enables billions of small PET bottles to be recycled.

Amcor launched PowerPost, an advanced light-weighting technology that enables bottle manufacturing with 100% sustainable materials. The company also announced that it is going to make all its packaging recyclable by 2025.

Sustainability and recycling initiatives are key priorities for RETAL as well. Side by side, the company is focusing on reducing its production costs by experimenting with 3D technology. For instance,

  • In April 2019, it announced that it is going to launch light, cheap bottles in the market by using advanced CAD software.

RETAL is also focusing on increasing its total production capacity of various types of bottles. The company announced in 2021 that it is going to double its PET preform production in Donora to 2 billion. It also declared that its staff may be increased by over 40%.

Scope of the Report

Attribute Details
Estimated Market Size (2022) US$ 90.3 billion
Projected Market Valuation (2033) US$ 151.2 billion
Value-based CAGR (2023 to 2033) 4.8%
Historical Data Available for 2018 to 2022
Forecast Period 2023 to 2033
Quantitative Units Value in US$ billion
Segment Covered
  • Capacity
  • Material
  • End Use
  • Region
Regions Covered
  • North America
  • Latin America
  • Europe
  • East Asia
  • South Asia
  • Oceania
  • The Middle East and Africa (MEA)
Key Countries Profiled
  • The United States
  • Canada
  • Brazil
  • Mexico
  • Germany
  • Italy
  • France
  • The United Kingdom
  • Spain
  • Russia
  • China
  • Japan
  • India
  • GCC Countries
  • Australia
Key Companies Profiled
  • ALPHA Packaging
  • Millet Plastics Inc.
  • Zhongshan Boyu Precision Mould Manufacturing Co., Ltd
  • APEX Plastics
  • Valencia Plastics, Inc.
  • Us Pack Group
  • Urola Packaging.
  • Robinson plc
  • PET Blow Molding
  • S.I.P.A. S.p.A
  • Rosti Group AB
  • Berry Global
  • O.BERK
  • Retail Industries Ltd
  • Grief Inc
  • Visy
  • Garrtech Inc
  • Graham Packaging co
  • LyondellBasell Industries B.V
Report Coverage Revenue Forecast, Volume Forecast, Company Ranking, Competitive Landscape, Growth Factors, Trends, and Pricing Analysis

Blow Molded Bottles Market Outlook by Category

By Capacity:

  • Below 100 ML
  • 100 to 500 ML
  • Above 500 ML

By Material:

  • Plastic
  • Glass
  • Metal
  • Other Materials

By End Use:

  • Pharmaceuticals
  • Food & Beverage
  • Cosmetics & Personal Care
  • Homecare
  • Others (Chemicals, etc.)

By Region:

  • North America
  • Latin America
  • Europe
  • The Middle East and Africa
  • East Asia
  • South Asia
  • Oceania

Frequently Asked Questions

What is the incremental growth opportunity of the market?

The global blow molded bottles market is estimated to have a market opportunity of US$ 151.2 billion by the end of 2033.

What will the market size be in 2023?

In 2023, the market is going to generate US$ 176 million in sales.

What is the forecasted market size by 2033?

By 2033, the global market is going to be worth $ 421.6 billion.

What is the market CAGR through 2033?

The market is expected to evolve at a 9.9% CAGR through 2033.

What is the CAGR of the United States market through 2033?

The market in the United States is projected to continue to grow at a CAGR of 4.0% during the forecast period.

Table of Content

1. Executive Summary

    1.1. Global Market Outlook

    1.2. Demand-side Trends

    1.3. Supply-side Trends

    1.4. Technology Roadmap Analysis

    1.5. Analysis and Recommendations

2. Market Overview

    2.1. Market Coverage / Taxonomy

    2.2. Market Definition / Scope / Limitations

3. Market Background

    3.1. Market Dynamics

        3.1.1. Drivers

        3.1.2. Restraints

        3.1.3. Opportunity

        3.1.4. Trends

    3.2. Scenario Forecast

        3.2.1. Demand in Optimistic Scenario

        3.2.2. Demand in Likely Scenario

        3.2.3. Demand in Conservative Scenario

    3.3. Opportunity Map Analysis

    3.4. Product Life Cycle Analysis

    3.5. Supply Chain Analysis

        3.5.1. Supply Side Participants and their Roles

            3.5.1.1. Producers

            3.5.1.2. Mid-Level Participants (Traders/ Agents/ Brokers)

            3.5.1.3. Wholesalers and Distributors

        3.5.2. Value Added and Value Created at Node in the Supply Chain

        3.5.3. List of Raw Material Suppliers

        3.5.4. List of Existing and Potential Buyer’s

    3.6. Investment Feasibility Matrix

    3.7. Value Chain Analysis

        3.7.1. Profit Margin Analysis

        3.7.2. Wholesalers and Distributors

        3.7.3. Retailers

    3.8. PESTLE and Porter’s Analysis

    3.9. Regulatory Landscape

        3.9.1. By Key Regions

        3.9.2. By Key Countries

    3.10. Regional Parent Market Outlook

    3.11. Production and Consumption Statistics

    3.12. Import and Export Statistics

4. Global Market Analysis 2018 to 2022 and Forecast, 2023 to 2033

    4.1. Historical Market Size Value (US$ Million) & Volume (Units) Analysis, 2018 to 2022

    4.2. Current and Future Market Size Value (US$ Million) & Volume (Units) Projections, 2023 to 2033

        4.2.1. Y-o-Y Growth Trend Analysis

        4.2.2. Absolute $ Opportunity Analysis

5. Global Market Analysis 2018 to 2022 and Forecast 2023 to 2033, By Capacity

    5.1. Introduction / Key Findings

    5.2. Historical Market Size Value (US$ Million) & Volume (Units) Analysis By Capacity, 2018 to 2022

    5.3. Current and Future Market Size Value (US$ Million) & Volume (Units) Analysis and Forecast By Capacity, 2023 to 2033

        5.3.1. Below 100 ML

        5.3.2. 100-500 ML

        5.3.3. Above 500 ML

    5.4. Y-o-Y Growth Trend Analysis By Capacity, 2018 to 2022

    5.5. Absolute $ Opportunity Analysis By Capacity, 2023 to 2033

6. Global Market Analysis 2018 to 2022 and Forecast 2023 to 2033, By Material

    6.1. Introduction / Key Findings

    6.2. Historical Market Size Value (US$ Million) & Volume (Units) Analysis By Material, 2018 to 2022

    6.3. Current and Future Market Size Value (US$ Million) & Volume (Units) Analysis and Forecast By Material, 2023 to 2033

        6.3.1. Plastic

        6.3.2. Glass

        6.3.3. Metal

    6.4. Y-o-Y Growth Trend Analysis By Material, 2018 to 2022

    6.5. Absolute $ Opportunity Analysis By Material, 2023 to 2033

7. Global Market Analysis 2018 to 2022 and Forecast 2023 to 2033, By End Use

    7.1. Introduction / Key Findings

    7.2. Historical Market Size Value (US$ Million) & Volume (Units) Analysis By End Use, 2018 to 2022

    7.3. Current and Future Market Size Value (US$ Million) & Volume (Units) Analysis and Forecast By End Use, 2023 to 2033

        7.3.1. End Use

        7.3.2. Food & Beverage

        7.3.3. Cosmetics & Personal Care

        7.3.4. Homecare

        7.3.5. Others

    7.4. Y-o-Y Growth Trend Analysis By End Use, 2018 to 2022

    7.5. Absolute $ Opportunity Analysis By End Use, 2023 to 2033

8. Global Market Analysis 2018 to 2022 and Forecast 2023 to 2033, By Region

    8.1. Introduction

    8.2. Historical Market Size Value (US$ Million) & Volume (Units) Analysis By Region, 2018 to 2022

    8.3. Current Market Size Value (US$ Million) & Volume (Units) Analysis and Forecast By Region, 2023 to 2033

        8.3.1. North America

        8.3.2. Latin America

        8.3.3. Western Europe

        8.3.4. Eastern Europe

        8.3.5. South Asia and Pacific

        8.3.6. East Asia

        8.3.7. Middle East and Africa

    8.4. Market Attractiveness Analysis By Region

9. North America Market Analysis 2018 to 2022 and Forecast 2023 to 2033, By Country

    9.1. Historical Market Size Value (US$ Million) & Volume (Units) Trend Analysis By Market Taxonomy, 2018 to 2022

    9.2. Market Size Value (US$ Million) & Volume (Units) Forecast By Market Taxonomy, 2023 to 2033

        9.2.1. By Country

            9.2.1.1. The USA

            9.2.1.2. Canada

        9.2.2. By Capacity

        9.2.3. By Material

        9.2.4. By End Use

    9.3. Market Attractiveness Analysis

        9.3.1. By Country

        9.3.2. By Capacity

        9.3.3. By Material

        9.3.4. By End Use

    9.4. Key Takeaways

10. Latin America Market Analysis 2018 to 2022 and Forecast 2023 to 2033, By Country

    10.1. Historical Market Size Value (US$ Million) & Volume (Units) Trend Analysis By Market Taxonomy, 2018 to 2022

    10.2. Market Size Value (US$ Million) & Volume (Units) Forecast By Market Taxonomy, 2023 to 2033

        10.2.1. By Country

            10.2.1.1. Brazil

            10.2.1.2. Mexico

            10.2.1.3. Rest of Latin America

        10.2.2. By Capacity

        10.2.3. By Material

        10.2.4. By End Use

    10.3. Market Attractiveness Analysis

        10.3.1. By Country

        10.3.2. By Capacity

        10.3.3. By Material

        10.3.4. By End Use

    10.4. Key Takeaways

11. Western Europe Market Analysis 2018 to 2022 and Forecast 2023 to 2033, By Country

    11.1. Historical Market Size Value (US$ Million) & Volume (Units) Trend Analysis By Market Taxonomy, 2018 to 2022

    11.2. Market Size Value (US$ Million) & Volume (Units) Forecast By Market Taxonomy, 2023 to 2033

        11.2.1. By Country

            11.2.1.1. Germany

            11.2.1.2. United Kingdom

            11.2.1.3. France

            11.2.1.4. Spain

            11.2.1.5. Italy

            11.2.1.6. Rest of Western Europe

        11.2.2. By Capacity

        11.2.3. By Material

        11.2.4. By End Use

    11.3. Market Attractiveness Analysis

        11.3.1. By Country

        11.3.2. By Capacity

        11.3.3. By Material

        11.3.4. By End Use

    11.4. Key Takeaways

12. Eastern Europe Market Analysis 2018 to 2022 and Forecast 2023 to 2033, By Country

    12.1. Historical Market Size Value (US$ Million) & Volume (Units) Trend Analysis By Market Taxonomy, 2018 to 2022

    12.2. Market Size Value (US$ Million) & Volume (Units) Forecast By Market Taxonomy, 2023 to 2033

        12.2.1. By Country

            12.2.1.1. Poland

            12.2.1.2. Russia

            12.2.1.3. Czech Republic

            12.2.1.4. Romania

            12.2.1.5. Rest of Eastern Europe

        12.2.2. By Capacity

        12.2.3. By Material

        12.2.4. By End Use

    12.3. Market Attractiveness Analysis

        12.3.1. By Country

        12.3.2. By Capacity

        12.3.3. By Material

        12.3.4. By End Use

    12.4. Key Takeaways

13. South Asia and Pacific Market Analysis 2018 to 2022 and Forecast 2023 to 2033, By Country

    13.1. Historical Market Size Value (US$ Million) & Volume (Units) Trend Analysis By Market Taxonomy, 2018 to 2022

    13.2. Market Size Value (US$ Million) & Volume (Units) Forecast By Market Taxonomy, 2023 to 2033

        13.2.1. By Country

            13.2.1.1. India

            13.2.1.2. Bangladesh

            13.2.1.3. Australia

            13.2.1.4. New Zealand

            13.2.1.5. Rest of South Asia and Pacific

        13.2.2. By Capacity

        13.2.3. By Material

        13.2.4. By End Use

    13.3. Market Attractiveness Analysis

        13.3.1. By Country

        13.3.2. By Capacity

        13.3.3. By Material

        13.3.4. By End Use

    13.4. Key Takeaways

14. East Asia Market Analysis 2018 to 2022 and Forecast 2023 to 2033, By Country

    14.1. Historical Market Size Value (US$ Million) & Volume (Units) Trend Analysis By Market Taxonomy, 2018 to 2022

    14.2. Market Size Value (US$ Million) & Volume (Units) Forecast By Market Taxonomy, 2023 to 2033

        14.2.1. By Country

            14.2.1.1. China

            14.2.1.2. Japan

            14.2.1.3. South Korea

        14.2.2. By Capacity

        14.2.3. By Material

        14.2.4. By End Use

    14.3. Market Attractiveness Analysis

        14.3.1. By Country

        14.3.2. By Capacity

        14.3.3. By Material

        14.3.4. By End Use

    14.4. Key Takeaways

15. Middle East and Africa Market Analysis 2018 to 2022 and Forecast 2023 to 2033, By Country

    15.1. Historical Market Size Value (US$ Million) & Volume (Units) Trend Analysis By Market Taxonomy, 2018 to 2022

    15.2. Market Size Value (US$ Million) & Volume (Units) Forecast By Market Taxonomy, 2023 to 2033

        15.2.1. By Country

            15.2.1.1. GCC Countries

            15.2.1.2. South Africa

            15.2.1.3. Israel

            15.2.1.4. Rest of MEA

        15.2.2. By Capacity

        15.2.3. By Material

        15.2.4. By End Use

    15.3. Market Attractiveness Analysis

        15.3.1. By Country

        15.3.2. By Capacity

        15.3.3. By Material

        15.3.4. By End Use

    15.4. Key Takeaways

16. Key Countries Market Analysis

    16.1. USA

        16.1.1. Pricing Analysis

        16.1.2. Market Share Analysis, 2022

            16.1.2.1. By Capacity

            16.1.2.2. By Material

            16.1.2.3. By End Use

    16.2. Canada

        16.2.1. Pricing Analysis

        16.2.2. Market Share Analysis, 2022

            16.2.2.1. By Capacity

            16.2.2.2. By Material

            16.2.2.3. By End Use

    16.3. Brazil

        16.3.1. Pricing Analysis

        16.3.2. Market Share Analysis, 2022

            16.3.2.1. By Capacity

            16.3.2.2. By Material

            16.3.2.3. By End Use

    16.4. Mexico

        16.4.1. Pricing Analysis

        16.4.2. Market Share Analysis, 2022

            16.4.2.1. By Capacity

            16.4.2.2. By Material

            16.4.2.3. By End Use

    16.5. Germany

        16.5.1. Pricing Analysis

        16.5.2. Market Share Analysis, 2022

            16.5.2.1. By Capacity

            16.5.2.2. By Material

            16.5.2.3. By End Use

    16.6. United Kingdom

        16.6.1. Pricing Analysis

        16.6.2. Market Share Analysis, 2022

            16.6.2.1. By Capacity

            16.6.2.2. By Material

            16.6.2.3. By End Use

    16.7. France

        16.7.1. Pricing Analysis

        16.7.2. Market Share Analysis, 2022

            16.7.2.1. By Capacity

            16.7.2.2. By Material

            16.7.2.3. By End Use

    16.8. Spain

        16.8.1. Pricing Analysis

        16.8.2. Market Share Analysis, 2022

            16.8.2.1. By Capacity

            16.8.2.2. By Material

            16.8.2.3. By End Use

    16.9. Italy

        16.9.1. Pricing Analysis

        16.9.2. Market Share Analysis, 2022

            16.9.2.1. By Capacity

            16.9.2.2. By Material

            16.9.2.3. By End Use

    16.10. Poland

        16.10.1. Pricing Analysis

        16.10.2. Market Share Analysis, 2022

            16.10.2.1. By Capacity

            16.10.2.2. By Material

            16.10.2.3. By End Use

    16.11. Russia

        16.11.1. Pricing Analysis

        16.11.2. Market Share Analysis, 2022

            16.11.2.1. By Capacity

            16.11.2.2. By Material

            16.11.2.3. By End Use

    16.12. Czech Republic

        16.12.1. Pricing Analysis

        16.12.2. Market Share Analysis, 2022

            16.12.2.1. By Capacity

            16.12.2.2. By Material

            16.12.2.3. By End Use

    16.13. Romania

        16.13.1. Pricing Analysis

        16.13.2. Market Share Analysis, 2022

            16.13.2.1. By Capacity

            16.13.2.2. By Material

            16.13.2.3. By End Use

    16.14. India

        16.14.1. Pricing Analysis

        16.14.2. Market Share Analysis, 2022

            16.14.2.1. By Capacity

            16.14.2.2. By Material

            16.14.2.3. By End Use

    16.15. Bangladesh

        16.15.1. Pricing Analysis

        16.15.2. Market Share Analysis, 2022

            16.15.2.1. By Capacity

            16.15.2.2. By Material

            16.15.2.3. By End Use

    16.16. Australia

        16.16.1. Pricing Analysis

        16.16.2. Market Share Analysis, 2022

            16.16.2.1. By Capacity

            16.16.2.2. By Material

            16.16.2.3. By End Use

    16.17. New Zealand

        16.17.1. Pricing Analysis

        16.17.2. Market Share Analysis, 2022

            16.17.2.1. By Capacity

            16.17.2.2. By Material

            16.17.2.3. By End Use

    16.18. China

        16.18.1. Pricing Analysis

        16.18.2. Market Share Analysis, 2022

            16.18.2.1. By Capacity

            16.18.2.2. By Material

            16.18.2.3. By End Use

    16.19. Japan

        16.19.1. Pricing Analysis

        16.19.2. Market Share Analysis, 2022

            16.19.2.1. By Capacity

            16.19.2.2. By Material

            16.19.2.3. By End Use

    16.20. South Korea

        16.20.1. Pricing Analysis

        16.20.2. Market Share Analysis, 2022

            16.20.2.1. By Capacity

            16.20.2.2. By Material

            16.20.2.3. By End Use

    16.21. GCC Countries

        16.21.1. Pricing Analysis

        16.21.2. Market Share Analysis, 2022

            16.21.2.1. By Capacity

            16.21.2.2. By Material

            16.21.2.3. By End Use

    16.22. South Africa

        16.22.1. Pricing Analysis

        16.22.2. Market Share Analysis, 2022

            16.22.2.1. By Capacity

            16.22.2.2. By Material

            16.22.2.3. By End Use

    16.23. Israel

        16.23.1. Pricing Analysis

        16.23.2. Market Share Analysis, 2022

            16.23.2.1. By Capacity

            16.23.2.2. By Material

            16.23.2.3. By End Use

17. Market Structure Analysis

    17.1. Competition Dashboard

    17.2. Competition Benchmarking

    17.3. Market Share Analysis of Top Players

        17.3.1. By Regional

        17.3.2. By Capacity

        17.3.3. By Material

        17.3.4. By End Use

18. Competition Analysis

    18.1. Competition Deep Dive

        18.1.1. ALPHA Packaging

            18.1.1.1. Overview

            18.1.1.2. Product Portfolio

            18.1.1.3. Profitability by Market Segments

            18.1.1.4. Sales Footprint

            18.1.1.5. Strategy Overview

                18.1.1.5.1. Marketing Strategy

                18.1.1.5.2. Product Strategy

                18.1.1.5.3. Channel Strategy

        18.1.2. Millet Plastics Inc.

            18.1.2.1. Overview

            18.1.2.2. Product Portfolio

            18.1.2.3. Profitability by Market Segments

            18.1.2.4. Sales Footprint

            18.1.2.5. Strategy Overview

                18.1.2.5.1. Marketing Strategy

                18.1.2.5.2. Product Strategy

                18.1.2.5.3. Channel Strategy

        18.1.3. Zhongshan Boyu Precision Mould Manufacturing Co., Ltd

            18.1.3.1. Overview

            18.1.3.2. Product Portfolio

            18.1.3.3. Profitability by Market Segments

            18.1.3.4. Sales Footprint

            18.1.3.5. Strategy Overview

                18.1.3.5.1. Marketing Strategy

                18.1.3.5.2. Product Strategy

                18.1.3.5.3. Channel Strategy

        18.1.4. APEX Plastics

            18.1.4.1. Overview

            18.1.4.2. Product Portfolio

            18.1.4.3. Profitability by Market Segments

            18.1.4.4. Sales Footprint

            18.1.4.5. Strategy Overview

                18.1.4.5.1. Marketing Strategy

                18.1.4.5.2. Product Strategy

                18.1.4.5.3. Channel Strategy

        18.1.5. Valencia Plastics, Inc.

            18.1.5.1. Overview

            18.1.5.2. Product Portfolio

            18.1.5.3. Profitability by Market Segments

            18.1.5.4. Sales Footprint

            18.1.5.5. Strategy Overview

                18.1.5.5.1. Marketing Strategy

                18.1.5.5.2. Product Strategy

                18.1.5.5.3. Channel Strategy

        18.1.6. Us Pack Group

            18.1.6.1. Overview

            18.1.6.2. Product Portfolio

            18.1.6.3. Profitability by Market Segments

            18.1.6.4. Sales Footprint

            18.1.6.5. Strategy Overview

                18.1.6.5.1. Marketing Strategy

                18.1.6.5.2. Product Strategy

                18.1.6.5.3. Channel Strategy

        18.1.7. Urola Packaging.

            18.1.7.1. Overview

            18.1.7.2. Product Portfolio

            18.1.7.3. Profitability by Market Segments

            18.1.7.4. Sales Footprint

            18.1.7.5. Strategy Overview

                18.1.7.5.1. Marketing Strategy

                18.1.7.5.2. Product Strategy

                18.1.7.5.3. Channel Strategy

        18.1.8. Robinson plc

            18.1.8.1. Overview

            18.1.8.2. Product Portfolio

            18.1.8.3. Profitability by Market Segments

            18.1.8.4. Sales Footprint

            18.1.8.5. Strategy Overview

                18.1.8.5.1. Marketing Strategy

                18.1.8.5.2. Product Strategy

                18.1.8.5.3. Channel Strategy

        18.1.9. Gil Pack

            18.1.9.1. Overview

            18.1.9.2. Product Portfolio

            18.1.9.3. Profitability by Market Segments

            18.1.9.4. Sales Footprint

            18.1.9.5. Strategy Overview

                18.1.9.5.1. Marketing Strategy

                18.1.9.5.2. Product Strategy

                18.1.9.5.3. Channel Strategy

        18.1.10. PET Blow Molding

            18.1.10.1. Overview

            18.1.10.2. Product Portfolio

            18.1.10.3. Profitability by Market Segments

            18.1.10.4. Sales Footprint

            18.1.10.5. Strategy Overview

                18.1.10.5.1. Marketing Strategy

                18.1.10.5.2. Product Strategy

                18.1.10.5.3. Channel Strategy

        18.1.11. S.I.P.A. S.p.A

            18.1.11.1. Overview

            18.1.11.2. Product Portfolio

            18.1.11.3. Profitability by Market Segments

            18.1.11.4. Sales Footprint

            18.1.11.5. Strategy Overview

                18.1.11.5.1. Marketing Strategy

                18.1.11.5.2. Product Strategy

                18.1.11.5.3. Channel Strategy

        18.1.12. Rosti Group AB

            18.1.12.1. Overview

            18.1.12.2. Product Portfolio

            18.1.12.3. Profitability by Market Segments

            18.1.12.4. Sales Footprint

            18.1.12.5. Strategy Overview

                18.1.12.5.1. Marketing Strategy

                18.1.12.5.2. Product Strategy

                18.1.12.5.3. Channel Strategy

        18.1.13. Berry Global

            18.1.13.1. Overview

            18.1.13.2. Product Portfolio

            18.1.13.3. Profitability by Market Segments

            18.1.13.4. Sales Footprint

            18.1.13.5. Strategy Overview

                18.1.13.5.1. Marketing Strategy

                18.1.13.5.2. Product Strategy

                18.1.13.5.3. Channel Strategy

        18.1.14. O.BERK

            18.1.14.1. Overview

            18.1.14.2. Product Portfolio

            18.1.14.3. Profitability by Market Segments

            18.1.14.4. Sales Footprint

            18.1.14.5. Strategy Overview

                18.1.14.5.1. Marketing Strategy

                18.1.14.5.2. Product Strategy

                18.1.14.5.3. Channel Strategy

        18.1.15. Retal Industries Ltd

            18.1.15.1. Overview

            18.1.15.2. Product Portfolio

            18.1.15.3. Profitability by Market Segments

            18.1.15.4. Sales Footprint

            18.1.15.5. Strategy Overview

                18.1.15.5.1. Marketing Strategy

                18.1.15.5.2. Product Strategy

                18.1.15.5.3. Channel Strategy

        18.1.16. Grief Inc

            18.1.16.1. Overview

            18.1.16.2. Product Portfolio

            18.1.16.3. Profitability by Market Segments

            18.1.16.4. Sales Footprint

            18.1.16.5. Strategy Overview

                18.1.16.5.1. Marketing Strategy

                18.1.16.5.2. Product Strategy

                18.1.16.5.3. Channel Strategy

        18.1.17. Visy

            18.1.17.1. Overview

            18.1.17.2. Product Portfolio

            18.1.17.3. Profitability by Market Segments

            18.1.17.4. Sales Footprint

            18.1.17.5. Strategy Overview

                18.1.17.5.1. Marketing Strategy

                18.1.17.5.2. Product Strategy

                18.1.17.5.3. Channel Strategy

        18.1.18. Garrtech Inc

            18.1.18.1. Overview

            18.1.18.2. Product Portfolio

            18.1.18.3. Profitability by Market Segments

            18.1.18.4. Sales Footprint

            18.1.18.5. Strategy Overview

                18.1.18.5.1. Marketing Strategy

                18.1.18.5.2. Product Strategy

                18.1.18.5.3. Channel Strategy

        18.1.19. Graham Packaging co

            18.1.19.1. Overview

            18.1.19.2. Product Portfolio

            18.1.19.3. Profitability by Market Segments

            18.1.19.4. Sales Footprint

            18.1.19.5. Strategy Overview

                18.1.19.5.1. Marketing Strategy

                18.1.19.5.2. Product Strategy

                18.1.19.5.3. Channel Strategy

19. Assumptions & Acronyms Used

20. Research Methodology

Don't pay for what you don't need

Customize your report by selecting specific countries or regions and save 30%!

List of Tables

Table 1: Global Market Value (US$ Million) Forecast by Region, 2018 to 2033

Table 2: Global Market Volume (Units) Forecast by Region, 2018 to 2033

Table 3: Global Market Value (US$ Million) Forecast by Capacity, 2018 to 2033

Table 4: Global Market Volume (Units) Forecast by Capacity, 2018 to 2033

Table 5: Global Market Value (US$ Million) Forecast by Material, 2018 to 2033

Table 6: Global Market Volume (Units) Forecast by Material, 2018 to 2033

Table 7: Global Market Value (US$ Million) Forecast by End Use, 2018 to 2033

Table 8: Global Market Volume (Units) Forecast by End Use, 2018 to 2033

Table 9: North America Market Value (US$ Million) Forecast by Country, 2018 to 2033

Table 10: North America Market Volume (Units) Forecast by Country, 2018 to 2033

Table 11: North America Market Value (US$ Million) Forecast by Capacity, 2018 to 2033

Table 12: North America Market Volume (Units) Forecast by Capacity, 2018 to 2033

Table 13: North America Market Value (US$ Million) Forecast by Material, 2018 to 2033

Table 14: North America Market Volume (Units) Forecast by Material, 2018 to 2033

Table 15: North America Market Value (US$ Million) Forecast by End Use, 2018 to 2033

Table 16: North America Market Volume (Units) Forecast by End Use, 2018 to 2033

Table 17: Latin America Market Value (US$ Million) Forecast by Country, 2018 to 2033

Table 18: Latin America Market Volume (Units) Forecast by Country, 2018 to 2033

Table 19: Latin America Market Value (US$ Million) Forecast by Capacity, 2018 to 2033

Table 20: Latin America Market Volume (Units) Forecast by Capacity, 2018 to 2033

Table 21: Latin America Market Value (US$ Million) Forecast by Material, 2018 to 2033

Table 22: Latin America Market Volume (Units) Forecast by Material, 2018 to 2033

Table 23: Latin America Market Value (US$ Million) Forecast by End Use, 2018 to 2033

Table 24: Latin America Market Volume (Units) Forecast by End Use, 2018 to 2033

Table 25: Western Europe Market Value (US$ Million) Forecast by Country, 2018 to 2033

Table 26: Western Europe Market Volume (Units) Forecast by Country, 2018 to 2033

Table 27: Western Europe Market Value (US$ Million) Forecast by Capacity, 2018 to 2033

Table 28: Western Europe Market Volume (Units) Forecast by Capacity, 2018 to 2033

Table 29: Western Europe Market Value (US$ Million) Forecast by Material, 2018 to 2033

Table 30: Western Europe Market Volume (Units) Forecast by Material, 2018 to 2033

Table 31: Western Europe Market Value (US$ Million) Forecast by End Use, 2018 to 2033

Table 32: Western Europe Market Volume (Units) Forecast by End Use, 2018 to 2033

Table 33: Eastern Europe Market Value (US$ Million) Forecast by Country, 2018 to 2033

Table 34: Eastern Europe Market Volume (Units) Forecast by Country, 2018 to 2033

Table 35: Eastern Europe Market Value (US$ Million) Forecast by Capacity, 2018 to 2033

Table 36: Eastern Europe Market Volume (Units) Forecast by Capacity, 2018 to 2033

Table 37: Eastern Europe Market Value (US$ Million) Forecast by Material, 2018 to 2033

Table 38: Eastern Europe Market Volume (Units) Forecast by Material, 2018 to 2033

Table 39: Eastern Europe Market Value (US$ Million) Forecast by End Use, 2018 to 2033

Table 40: Eastern Europe Market Volume (Units) Forecast by End Use, 2018 to 2033

Table 41: South Asia and Pacific Market Value (US$ Million) Forecast by Country, 2018 to 2033

Table 42: South Asia and Pacific Market Volume (Units) Forecast by Country, 2018 to 2033

Table 43: South Asia and Pacific Market Value (US$ Million) Forecast by Capacity, 2018 to 2033

Table 44: South Asia and Pacific Market Volume (Units) Forecast by Capacity, 2018 to 2033

Table 45: South Asia and Pacific Market Value (US$ Million) Forecast by Material, 2018 to 2033

Table 46: South Asia and Pacific Market Volume (Units) Forecast by Material, 2018 to 2033

Table 47: South Asia and Pacific Market Value (US$ Million) Forecast by End Use, 2018 to 2033

Table 48: South Asia and Pacific Market Volume (Units) Forecast by End Use, 2018 to 2033

Table 49: East Asia Market Value (US$ Million) Forecast by Country, 2018 to 2033

Table 50: East Asia Market Volume (Units) Forecast by Country, 2018 to 2033

Table 51: East Asia Market Value (US$ Million) Forecast by Capacity, 2018 to 2033

Table 52: East Asia Market Volume (Units) Forecast by Capacity, 2018 to 2033

Table 53: East Asia Market Value (US$ Million) Forecast by Material, 2018 to 2033

Table 54: East Asia Market Volume (Units) Forecast by Material, 2018 to 2033

Table 55: East Asia Market Value (US$ Million) Forecast by End Use, 2018 to 2033

Table 56: East Asia Market Volume (Units) Forecast by End Use, 2018 to 2033

Table 57: Middle East and Africa Market Value (US$ Million) Forecast by Country, 2018 to 2033

Table 58: Middle East and Africa Market Volume (Units) Forecast by Country, 2018 to 2033

Table 59: Middle East and Africa Market Value (US$ Million) Forecast by Capacity, 2018 to 2033

Table 60: Middle East and Africa Market Volume (Units) Forecast by Capacity, 2018 to 2033

Table 61: Middle East and Africa Market Value (US$ Million) Forecast by Material, 2018 to 2033

Table 62: Middle East and Africa Market Volume (Units) Forecast by Material, 2018 to 2033

Table 63: Middle East and Africa Market Value (US$ Million) Forecast by End Use, 2018 to 2033

Table 64: Middle East and Africa Market Volume (Units) Forecast by End Use, 2018 to 2033
Ismail Sutaria
Ismail Sutaria

Principal Consultant

Talk to Analyst

Find your sweet spots for generating winning opportunities in this market.

List of Charts

Figure 1: Global Market Value (US$ Million) by Capacity, 2023 to 2033

Figure 2: Global Market Value (US$ Million) by Material, 2023 to 2033

Figure 3: Global Market Value (US$ Million) by End Use, 2023 to 2033

Figure 4: Global Market Value (US$ Million) by Region, 2023 to 2033

Figure 5: Global Market Value (US$ Million) Analysis by Region, 2018 to 2033

Figure 6: Global Market Volume (Units) Analysis by Region, 2018 to 2033

Figure 7: Global Market Value Share (%) and BPS Analysis by Region, 2023 to 2033

Figure 8: Global Market Y-o-Y Growth (%) Projections by Region, 2023 to 2033

Figure 9: Global Market Value (US$ Million) Analysis by Capacity, 2018 to 2033

Figure 10: Global Market Volume (Units) Analysis by Capacity, 2018 to 2033

Figure 11: Global Market Value Share (%) and BPS Analysis by Capacity, 2023 to 2033

Figure 12: Global Market Y-o-Y Growth (%) Projections by Capacity, 2023 to 2033

Figure 13: Global Market Value (US$ Million) Analysis by Material, 2018 to 2033

Figure 14: Global Market Volume (Units) Analysis by Material, 2018 to 2033

Figure 15: Global Market Value Share (%) and BPS Analysis by Material, 2023 to 2033

Figure 16: Global Market Y-o-Y Growth (%) Projections by Material, 2023 to 2033

Figure 17: Global Market Value (US$ Million) Analysis by End Use, 2018 to 2033

Figure 18: Global Market Volume (Units) Analysis by End Use, 2018 to 2033

Figure 19: Global Market Value Share (%) and BPS Analysis by End Use, 2023 to 2033

Figure 20: Global Market Y-o-Y Growth (%) Projections by End Use, 2023 to 2033

Figure 21: Global Market Attractiveness by Capacity, 2023 to 2033

Figure 22: Global Market Attractiveness by Material, 2023 to 2033

Figure 23: Global Market Attractiveness by End Use, 2023 to 2033

Figure 24: Global Market Attractiveness by Region, 2023 to 2033

Figure 25: North America Market Value (US$ Million) by Capacity, 2023 to 2033

Figure 26: North America Market Value (US$ Million) by Material, 2023 to 2033

Figure 27: North America Market Value (US$ Million) by End Use, 2023 to 2033

Figure 28: North America Market Value (US$ Million) by Country, 2023 to 2033

Figure 29: North America Market Value (US$ Million) Analysis by Country, 2018 to 2033

Figure 30: North America Market Volume (Units) Analysis by Country, 2018 to 2033

Figure 31: North America Market Value Share (%) and BPS Analysis by Country, 2023 to 2033

Figure 32: North America Market Y-o-Y Growth (%) Projections by Country, 2023 to 2033

Figure 33: North America Market Value (US$ Million) Analysis by Capacity, 2018 to 2033

Figure 34: North America Market Volume (Units) Analysis by Capacity, 2018 to 2033

Figure 35: North America Market Value Share (%) and BPS Analysis by Capacity, 2023 to 2033

Figure 36: North America Market Y-o-Y Growth (%) Projections by Capacity, 2023 to 2033

Figure 37: North America Market Value (US$ Million) Analysis by Material, 2018 to 2033

Figure 38: North America Market Volume (Units) Analysis by Material, 2018 to 2033

Figure 39: North America Market Value Share (%) and BPS Analysis by Material, 2023 to 2033

Figure 40: North America Market Y-o-Y Growth (%) Projections by Material, 2023 to 2033

Figure 41: North America Market Value (US$ Million) Analysis by End Use, 2018 to 2033

Figure 42: North America Market Volume (Units) Analysis by End Use, 2018 to 2033

Figure 43: North America Market Value Share (%) and BPS Analysis by End Use, 2023 to 2033

Figure 44: North America Market Y-o-Y Growth (%) Projections by End Use, 2023 to 2033

Figure 45: North America Market Attractiveness by Capacity, 2023 to 2033

Figure 46: North America Market Attractiveness by Material, 2023 to 2033

Figure 47: North America Market Attractiveness by End Use, 2023 to 2033

Figure 48: North America Market Attractiveness by Country, 2023 to 2033

Figure 49: Latin America Market Value (US$ Million) by Capacity, 2023 to 2033

Figure 50: Latin America Market Value (US$ Million) by Material, 2023 to 2033

Figure 51: Latin America Market Value (US$ Million) by End Use, 2023 to 2033

Figure 52: Latin America Market Value (US$ Million) by Country, 2023 to 2033

Figure 53: Latin America Market Value (US$ Million) Analysis by Country, 2018 to 2033

Figure 54: Latin America Market Volume (Units) Analysis by Country, 2018 to 2033

Figure 55: Latin America Market Value Share (%) and BPS Analysis by Country, 2023 to 2033

Figure 56: Latin America Market Y-o-Y Growth (%) Projections by Country, 2023 to 2033

Figure 57: Latin America Market Value (US$ Million) Analysis by Capacity, 2018 to 2033

Figure 58: Latin America Market Volume (Units) Analysis by Capacity, 2018 to 2033

Figure 59: Latin America Market Value Share (%) and BPS Analysis by Capacity, 2023 to 2033

Figure 60: Latin America Market Y-o-Y Growth (%) Projections by Capacity, 2023 to 2033

Figure 61: Latin America Market Value (US$ Million) Analysis by Material, 2018 to 2033

Figure 62: Latin America Market Volume (Units) Analysis by Material, 2018 to 2033

Figure 63: Latin America Market Value Share (%) and BPS Analysis by Material, 2023 to 2033

Figure 64: Latin America Market Y-o-Y Growth (%) Projections by Material, 2023 to 2033

Figure 65: Latin America Market Value (US$ Million) Analysis by End Use, 2018 to 2033

Figure 66: Latin America Market Volume (Units) Analysis by End Use, 2018 to 2033

Figure 67: Latin America Market Value Share (%) and BPS Analysis by End Use, 2023 to 2033

Figure 68: Latin America Market Y-o-Y Growth (%) Projections by End Use, 2023 to 2033

Figure 69: Latin America Market Attractiveness by Capacity, 2023 to 2033

Figure 70: Latin America Market Attractiveness by Material, 2023 to 2033

Figure 71: Latin America Market Attractiveness by End Use, 2023 to 2033

Figure 72: Latin America Market Attractiveness by Country, 2023 to 2033

Figure 73: Western Europe Market Value (US$ Million) by Capacity, 2023 to 2033

Figure 74: Western Europe Market Value (US$ Million) by Material, 2023 to 2033

Figure 75: Western Europe Market Value (US$ Million) by End Use, 2023 to 2033

Figure 76: Western Europe Market Value (US$ Million) by Country, 2023 to 2033

Figure 77: Western Europe Market Value (US$ Million) Analysis by Country, 2018 to 2033

Figure 78: Western Europe Market Volume (Units) Analysis by Country, 2018 to 2033

Figure 79: Western Europe Market Value Share (%) and BPS Analysis by Country, 2023 to 2033

Figure 80: Western Europe Market Y-o-Y Growth (%) Projections by Country, 2023 to 2033

Figure 81: Western Europe Market Value (US$ Million) Analysis by Capacity, 2018 to 2033

Figure 82: Western Europe Market Volume (Units) Analysis by Capacity, 2018 to 2033

Figure 83: Western Europe Market Value Share (%) and BPS Analysis by Capacity, 2023 to 2033

Figure 84: Western Europe Market Y-o-Y Growth (%) Projections by Capacity, 2023 to 2033

Figure 85: Western Europe Market Value (US$ Million) Analysis by Material, 2018 to 2033

Figure 86: Western Europe Market Volume (Units) Analysis by Material, 2018 to 2033

Figure 87: Western Europe Market Value Share (%) and BPS Analysis by Material, 2023 to 2033

Figure 88: Western Europe Market Y-o-Y Growth (%) Projections by Material, 2023 to 2033

Figure 89: Western Europe Market Value (US$ Million) Analysis by End Use, 2018 to 2033

Figure 90: Western Europe Market Volume (Units) Analysis by End Use, 2018 to 2033

Figure 91: Western Europe Market Value Share (%) and BPS Analysis by End Use, 2023 to 2033

Figure 92: Western Europe Market Y-o-Y Growth (%) Projections by End Use, 2023 to 2033

Figure 93: Western Europe Market Attractiveness by Capacity, 2023 to 2033

Figure 94: Western Europe Market Attractiveness by Material, 2023 to 2033

Figure 95: Western Europe Market Attractiveness by End Use, 2023 to 2033

Figure 96: Western Europe Market Attractiveness by Country, 2023 to 2033

Figure 97: Eastern Europe Market Value (US$ Million) by Capacity, 2023 to 2033

Figure 98: Eastern Europe Market Value (US$ Million) by Material, 2023 to 2033

Figure 99: Eastern Europe Market Value (US$ Million) by End Use, 2023 to 2033

Figure 100: Eastern Europe Market Value (US$ Million) by Country, 2023 to 2033

Figure 101: Eastern Europe Market Value (US$ Million) Analysis by Country, 2018 to 2033

Figure 102: Eastern Europe Market Volume (Units) Analysis by Country, 2018 to 2033

Figure 103: Eastern Europe Market Value Share (%) and BPS Analysis by Country, 2023 to 2033

Figure 104: Eastern Europe Market Y-o-Y Growth (%) Projections by Country, 2023 to 2033

Figure 105: Eastern Europe Market Value (US$ Million) Analysis by Capacity, 2018 to 2033

Figure 106: Eastern Europe Market Volume (Units) Analysis by Capacity, 2018 to 2033

Figure 107: Eastern Europe Market Value Share (%) and BPS Analysis by Capacity, 2023 to 2033

Figure 108: Eastern Europe Market Y-o-Y Growth (%) Projections by Capacity, 2023 to 2033

Figure 109: Eastern Europe Market Value (US$ Million) Analysis by Material, 2018 to 2033

Figure 110: Eastern Europe Market Volume (Units) Analysis by Material, 2018 to 2033

Figure 111: Eastern Europe Market Value Share (%) and BPS Analysis by Material, 2023 to 2033

Figure 112: Eastern Europe Market Y-o-Y Growth (%) Projections by Material, 2023 to 2033

Figure 113: Eastern Europe Market Value (US$ Million) Analysis by End Use, 2018 to 2033

Figure 114: Eastern Europe Market Volume (Units) Analysis by End Use, 2018 to 2033

Figure 115: Eastern Europe Market Value Share (%) and BPS Analysis by End Use, 2023 to 2033

Figure 116: Eastern Europe Market Y-o-Y Growth (%) Projections by End Use, 2023 to 2033

Figure 117: Eastern Europe Market Attractiveness by Capacity, 2023 to 2033

Figure 118: Eastern Europe Market Attractiveness by Material, 2023 to 2033

Figure 119: Eastern Europe Market Attractiveness by End Use, 2023 to 2033

Figure 120: Eastern Europe Market Attractiveness by Country, 2023 to 2033

Figure 121: South Asia and Pacific Market Value (US$ Million) by Capacity, 2023 to 2033

Figure 122: South Asia and Pacific Market Value (US$ Million) by Material, 2023 to 2033

Figure 123: South Asia and Pacific Market Value (US$ Million) by End Use, 2023 to 2033

Figure 124: South Asia and Pacific Market Value (US$ Million) by Country, 2023 to 2033

Figure 125: South Asia and Pacific Market Value (US$ Million) Analysis by Country, 2018 to 2033

Figure 126: South Asia and Pacific Market Volume (Units) Analysis by Country, 2018 to 2033

Figure 127: South Asia and Pacific Market Value Share (%) and BPS Analysis by Country, 2023 to 2033

Figure 128: South Asia and Pacific Market Y-o-Y Growth (%) Projections by Country, 2023 to 2033

Figure 129: South Asia and Pacific Market Value (US$ Million) Analysis by Capacity, 2018 to 2033

Figure 130: South Asia and Pacific Market Volume (Units) Analysis by Capacity, 2018 to 2033

Figure 131: South Asia and Pacific Market Value Share (%) and BPS Analysis by Capacity, 2023 to 2033

Figure 132: South Asia and Pacific Market Y-o-Y Growth (%) Projections by Capacity, 2023 to 2033

Figure 133: South Asia and Pacific Market Value (US$ Million) Analysis by Material, 2018 to 2033

Figure 134: South Asia and Pacific Market Volume (Units) Analysis by Material, 2018 to 2033

Figure 135: South Asia and Pacific Market Value Share (%) and BPS Analysis by Material, 2023 to 2033

Figure 136: South Asia and Pacific Market Y-o-Y Growth (%) Projections by Material, 2023 to 2033

Figure 137: South Asia and Pacific Market Value (US$ Million) Analysis by End Use, 2018 to 2033

Figure 138: South Asia and Pacific Market Volume (Units) Analysis by End Use, 2018 to 2033

Figure 139: South Asia and Pacific Market Value Share (%) and BPS Analysis by End Use, 2023 to 2033

Figure 140: South Asia and Pacific Market Y-o-Y Growth (%) Projections by End Use, 2023 to 2033

Figure 141: South Asia and Pacific Market Attractiveness by Capacity, 2023 to 2033

Figure 142: South Asia and Pacific Market Attractiveness by Material, 2023 to 2033

Figure 143: South Asia and Pacific Market Attractiveness by End Use, 2023 to 2033

Figure 144: South Asia and Pacific Market Attractiveness by Country, 2023 to 2033

Figure 145: East Asia Market Value (US$ Million) by Capacity, 2023 to 2033

Figure 146: East Asia Market Value (US$ Million) by Material, 2023 to 2033

Figure 147: East Asia Market Value (US$ Million) by End Use, 2023 to 2033

Figure 148: East Asia Market Value (US$ Million) by Country, 2023 to 2033

Figure 149: East Asia Market Value (US$ Million) Analysis by Country, 2018 to 2033

Figure 150: East Asia Market Volume (Units) Analysis by Country, 2018 to 2033

Figure 151: East Asia Market Value Share (%) and BPS Analysis by Country, 2023 to 2033

Figure 152: East Asia Market Y-o-Y Growth (%) Projections by Country, 2023 to 2033

Figure 153: East Asia Market Value (US$ Million) Analysis by Capacity, 2018 to 2033

Figure 154: East Asia Market Volume (Units) Analysis by Capacity, 2018 to 2033

Figure 155: East Asia Market Value Share (%) and BPS Analysis by Capacity, 2023 to 2033

Figure 156: East Asia Market Y-o-Y Growth (%) Projections by Capacity, 2023 to 2033

Figure 157: East Asia Market Value (US$ Million) Analysis by Material, 2018 to 2033

Figure 158: East Asia Market Volume (Units) Analysis by Material, 2018 to 2033

Figure 159: East Asia Market Value Share (%) and BPS Analysis by Material, 2023 to 2033

Figure 160: East Asia Market Y-o-Y Growth (%) Projections by Material, 2023 to 2033

Figure 161: East Asia Market Value (US$ Million) Analysis by End Use, 2018 to 2033

Figure 162: East Asia Market Volume (Units) Analysis by End Use, 2018 to 2033

Figure 163: East Asia Market Value Share (%) and BPS Analysis by End Use, 2023 to 2033

Figure 164: East Asia Market Y-o-Y Growth (%) Projections by End Use, 2023 to 2033

Figure 165: East Asia Market Attractiveness by Capacity, 2023 to 2033

Figure 166: East Asia Market Attractiveness by Material, 2023 to 2033

Figure 167: East Asia Market Attractiveness by End Use, 2023 to 2033

Figure 168: East Asia Market Attractiveness by Country, 2023 to 2033

Figure 169: Middle East and Africa Market Value (US$ Million) by Capacity, 2023 to 2033

Figure 170: Middle East and Africa Market Value (US$ Million) by Material, 2023 to 2033

Figure 171: Middle East and Africa Market Value (US$ Million) by End Use, 2023 to 2033

Figure 172: Middle East and Africa Market Value (US$ Million) by Country, 2023 to 2033

Figure 173: Middle East and Africa Market Value (US$ Million) Analysis by Country, 2018 to 2033

Figure 174: Middle East and Africa Market Volume (Units) Analysis by Country, 2018 to 2033

Figure 175: Middle East and Africa Market Value Share (%) and BPS Analysis by Country, 2023 to 2033

Figure 176: Middle East and Africa Market Y-o-Y Growth (%) Projections by Country, 2023 to 2033

Figure 177: Middle East and Africa Market Value (US$ Million) Analysis by Capacity, 2018 to 2033

Figure 178: Middle East and Africa Market Volume (Units) Analysis by Capacity, 2018 to 2033

Figure 179: Middle East and Africa Market Value Share (%) and BPS Analysis by Capacity, 2023 to 2033

Figure 180: Middle East and Africa Market Y-o-Y Growth (%) Projections by Capacity, 2023 to 2033

Figure 181: Middle East and Africa Market Value (US$ Million) Analysis by Material, 2018 to 2033

Figure 182: Middle East and Africa Market Volume (Units) Analysis by Material, 2018 to 2033

Figure 183: Middle East and Africa Market Value Share (%) and BPS Analysis by Material, 2023 to 2033

Figure 184: Middle East and Africa Market Y-o-Y Growth (%) Projections by Material, 2023 to 2033

Figure 185: Middle East and Africa Market Value (US$ Million) Analysis by End Use, 2018 to 2033

Figure 186: Middle East and Africa Market Volume (Units) Analysis by End Use, 2018 to 2033

Figure 187: Middle East and Africa Market Value Share (%) and BPS Analysis by End Use, 2023 to 2033

Figure 188: Middle East and Africa Market Y-o-Y Growth (%) Projections by End Use, 2023 to 2033

Figure 189: Middle East and Africa Market Attractiveness by Capacity, 2023 to 2033

Figure 190: Middle East and Africa Market Attractiveness by Material, 2023 to 2033

Figure 191: Middle East and Africa Market Attractiveness by End Use, 2023 to 2033

Figure 192: Middle East and Africa Market Attractiveness by Country, 2023 to 2033

Recommendations

Packaging

PCR Bottles Market

Published : November 2022

Explore Packaging Insights

View Reports

Blow Molded Bottles Market