Reports

- Global Locations -

Headquarters

Future Market Insights, Inc.

Christiana Corporate, 200
Continental Drive, Suite 401,
Newark, Delaware - 19713,
United States

T: +1-845-579-5705

Americas

Future Market Insights, Inc.

616 Corporate Way, Suite 2-9018,
Valley Cottage, NY 10989, United States

T: +1-347-918-3531

MEA

Future Market Insights

1602-6 Jumeirah Bay X2 Tower, Plot No: JLT-PH2-X2A,
Jumeirah Lakes Towers, Dubai,
United Arab Emirates

Europe

Future Market Insights

3rd Floor, 207 Regent Street,
W1B 3HH London
United Kingdom

T: + 44 (0) 20 8123 9659
D: +44 (0) 20 3287 4268

Asia Pacific

Future Market Insights

IndiaLand Global Tech Park, Unit UG-1, Behind Grand HighStreet, Phase 1, Hinjawadi, MH, Pune – 411057, India

Cattle Blower Market Outlook (2023 to 2033)

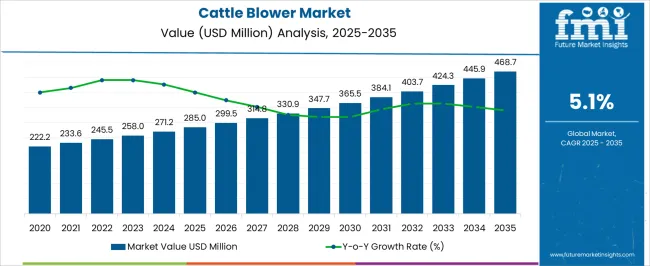
The global cattle blower market is estimated to develop at a moderate CAGR of 5.1% during the forecast period. The present-day value of this market is US$ 258 Million in 2023. By 2033, the market for cattle blowers is estimated to reach US$ 424 Million.

A cattle blower is an instrument that blows cold or warm air over a cattle's skin. Following a bath, aids in drying the coat and drains the water from it. The adoption of cattle blowers is increasing among farm owners, resulting in market expansion. This expansion is simplified by the following dynamics:

  • Demand for livestock products is rising, and people are becoming more concerned about their wellness and cleanliness.
  • Farmers and ranchers all around the world are becoming increasingly aware of the advantages of utilizing livestock blowers.
  • The adoption of animal blowers is being sparked by strict food safety rules in several nations that are aiming to raise sanitary standards.
  • Technological developments are enhancing the effectiveness and dependability of animal dryers and boosting consumer acceptance.
  • Demand for meat and dairy products is rising as a result of the rising population and changing dietary preferences.
  • High-quality animal products are in more demand due to the increased disposable income among customers in emerging nations.
  • The cattle blower is a durable and effective piece of equipment that works great for drying animals.
  • Automated machinery is being used more often to manage livestock and do other chores.
  • Busy farms and Research and Development labs prefer using this blower due to its high capacity, which can handle a big number of cattle at once.

Don't pay for what you don't need

Customize your report by selecting specific countries or regions and save 30%!

The increase in Demand for Advanced Livestock Farming Equipment is Creating Market Buzz for Cattle Blowers

One of the main elements likely to foster a favorable outlook for the market is the substantial expansion of the cattle sector globally. Farm owners can profit from cattle farming equipment like cattle blowers in the form of increased operational effectiveness and enhanced animal management. They are anticipated to install automation technology as a result of rising labor expenses in nations like India, China, Germany, and the United Kingdom.

In reaction to increased labor costs, the desire for automated livestock farms is likely to increase, creating new market prospects for cattle blowers. Moreover, farmers are focusing on using cutting-edge technology in farming to improve operational effectiveness. This trend of using advanced farming equipment to boost total production and management techniques is accelerating market expansion.

Market players provide a range of animal drier models that are appropriate for various user types. The integration of features like speed control, heat control switches, and temperature setting choices as a result of technological improvements aids in maintaining constant precision in temperature.

Additionally, these businesses provide consumers with tailored services that let them choose the equipment that is most appropriate for their requirements. Certain cattle dryers include an advanced control panel that makes it simple to change the temperature and airflow. It guarantees that the animals will dry fast and effectively.

Attributes Details
Cattle Blower Market Value (2023) US$ 258 Million
Cattle Blower Market Expected Value (2033) US$ 424 Million
Cattle Blower Market Projected CAGR (2023 to 2033) 5.1%

Outlook Scope of Cattle Blower Market 2023 to 2033 Compared to 2016 to 2022

The cattle blower market is projected to expand at 5.1% CAGR between 2023 and 2033. Historically, the market value of cattle blowers presented slow-paced development from 2016 to 2022, registering a CAGR of 4.6%.

Over the projected period, the market for cattle blowers is anticipated to expand moderately. The market is expanding due to the demand for automation in a variety of animal husbandry procedures. Additionally, the market is positively impacted by rising industrialization, increased product uptake, particularly in developed nations, and the growth of the agricultural sector.

Historical CAGR (2016 to 2022) 4.6%
Forecast CAGR (2023 to 2033) 5.1%
  • Short Term (2023 to 2026): A rise in a range of diseases affecting cattle makes it vital to maintain hygiene among the animals. This is likely to increase the adoption of cattle blowers.
  • Medium Term (2026 to 2029): The market is likely to be propelled forward by modernization's quick pace and the growing need for automation of different animal husbandry procedures.
  • Long Term (2029 to 2033): Growing consumer spending power on agricultural equipment and the implementation of supportive government policies are expected to fuel market growth.

On the back of these factors, the cattle blower market is likely to grow 1.6X between 2023 and 2033. As per the analysts, a valuation of US$ 424 million by 2033 end is estimated for the market.

Year Valuation
2016 US$ 187.8 Million
2021 US$ 234.8 Million
2022 US$ 245.5 Million
2023 US$ 258 Million
2033 US$ 424 Million
Nikhil Kaitwade
Nikhil Kaitwade

Principal Consultant

Talk to Analyst

Find your sweet spots for generating winning opportunities in this market.

Comparative Analysis of Adjacent Markets

Cattle Blower Market:

Differentiating Aspects Cattle Blower Market
CAGR (2023 to 2033) 5.1%
Market Valuation in 2023 US$ 258 Million
Projected Market Value in 2033 US$ 424 Million
Growth Factors The cattle blower is a sturdy and efficient piece of machinery that is excellent for drying livestock.
Opportunities Owing to its ability to manage many cattle simultaneously, busy farms are likely to enjoy utilizing this blower.
Key Trends Modern technology is being used by farmers to boost performance.

Dairy Herd Management Market:

Differentiating Aspects Dairy Herd Management Market
CAGR (2023 to 2033) 7.9%
Market Valuation in 2023 US$ 4.65 Billion
Projected Market Value in 2033 US$ 9.94 Billion
Growth Factors Growing demand from consumers for dairy proteins like milk and cheese
Opportunities Long-term asset utilization advantages of herd management technology
Key Trends Growing reliance on efficient agricultural techniques to increase output and effectiveness.

Livestock Farm Equipment Market:

Differentiating Aspects Livestock Farm Equipment Market
CAGR (2023 to 2033) 3.4%
Market Valuation in 2023 US$ 18.75 Billion
Projected Market Value in 2033 US$ 26.19 Billion
Growth Factors The many benefits of livestock farm equipment for streamlining agricultural operations
Opportunities Automated technology is employed more frequently to handle animals and perform other activities
Key Trends Using cutting-edge technologies indefinitely to increase productivity

In Which Region do Cattle Blowers have the Most Market Share?

North America is anticipated to have a dominating position in the global cattle blower market. The region is witnessing rapid technological advances and the widespread use of livestock farm equipment. The Asia Pacific cattle blower market is anticipated to expand at a rapid CAGR. The main factor is the rapid technological development that is accessible there at a lower cost than in the United States.
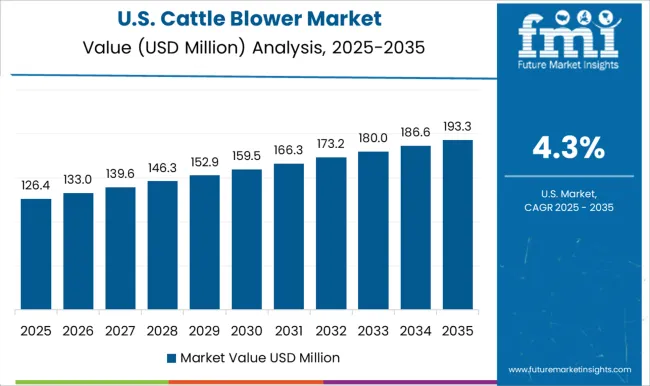
Why is the Demand for Cattle Blower Surging in the US?

North America, which is one of the largest producers in the globe overall, includes the United States as a key producer of livestock and other products derived from animals. The adoption of cattle blowers in the US has been influenced by the growth of dairy farms and growing labor expenses. With more hands-on experience, awareness of the use of cattle management systems has grown rapidly in recent years in the country.

Country United States
Market Share (2022) 27.10%
Market Value (2022) US$ 66.5 Million

In addition, this country is producing and consuming an increasing number of livestock and products made from them. Owing to this, keeping cattle in good health and hygienic conditions has become a must for livestock farmers. Additionally, a doorway for cattle blowers' adoption is opened by the rising awareness about the diseases that affect livestock and can be spread to humans. As a result, the US cattle blower market offers huge possibilities for market participants.
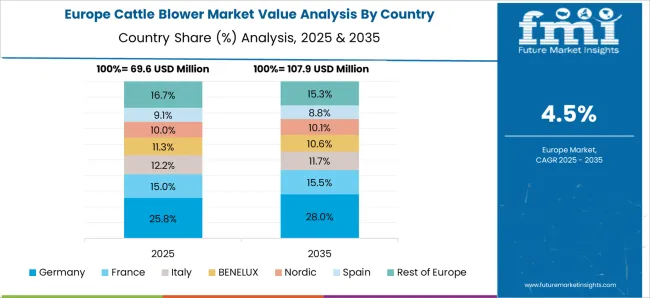
Why is Germany a Lucrative Market for Cattle Blowers?

Owing to technological breakthroughs and improvements in cattle management, the German cattle blower market is the largest in all of Europe. In Germany, there is a growing demand for dairy and meat products. The fast rise in consumption is due to consumer desire for a diet rich in protein. The market is also fueled by a structured dairy industry and expanding livestock output.

Country Germany
Market Share (2022) 19.60%
Market Value (2022) US$ 48.1 Million

The welfare of animals is now a topic that German dairy producers are more aware of. It is predicted that this would increase the focus on managing cattle health in Germany. The German cattle blower market is expected to increase at a rapid rate throughout the forecasted period as a result.

What is Driving Demand for Cattle Blowers in the United Kingdom?

Throughout the forecast period, the UK is anticipated to have a bigger share. It is predicted that the presence of major companies and rising agricultural machinery import and export volumes would open up the UK cattle blower market. Growing health awareness is expected to support the sector. Dairy farming in the nation is thus predicted to increase throughout the projection period. This is anticipated to enhance the use of cattle blowers along with other dairy farming machinery.

Country United Kingdom
CAGR (2023 to 2033) 5.50%
Market Share (2022) 9.00%
Market Value (2022) US$ 22.0 Million
Market Value (2033) US$ 37.5 Million

Johnes Disease outbreaks in cattle are frequent occurrences in the UK. Calves must be periodically cleaned and dried correctly to protect cattle from this infection. Farmers are encouraged by this to preserve the health of the livestock. In order to tackle these ongoing disease outbreaks, cattle blower sales have been rising over the past few years.

Why is the Market in China Developing more Promptly than in Other Nations?

The cattle industry in China has undergone a substantial shift. Both the domestic and international food supply, it has had a tremendous effect. The emergence of industrial livestock production techniques without land is largely to blame for this. Changes were influenced by demand and supply for new animal species, new technology, and government support.

Country China
CAGR (2023 to 2033) 4.10%
Market Share (2022) 9.80%
Market Value (2022) US$ 24.04 Million
Market Value (2033) US$ 35.9 Million

A farm incident in the eastern province of Zhejiang in 2020 led to outbreaks of a crippling virus in cattle that produces a condition known as "lumpy skin disease." Cattle must be properly washed and dried on a regular basis to prevent this disease. Moreover, the country's efforts to modernize and find efficiency in its practices and organizational structure are another element likely to fuel the market's expansion. Hence, the Chinese cattle blower market is emerging as a potential market for manufacturers and suppliers.

Why is the Market in India Considered Economically Rewarding?

Even though agriculture is the main source of revenue for the agricultural communities in India, the livestock industry serves as a secondary source of agriculture. It provides a reliable source of income for the district's small and marginal farmers. The majority of farmers still raise animals in conventional ways. Thus there is a substantial danger that illnesses like Amphistomiasis may spread and cause low output and productivity in livestock. Hence, the Indian cattle blower market has decent opportunities for market players.

Country India
CAGR (2023 to 2033) 6.00%
Market Share (2022) 3.30%
Market Value (2022) US$ 8.0 Million
Market Value (2033) US$ 14.3 Million

India's market growth is projected to increase because of the rising need for agricultural automation and government encouragement of the expansion of the agriculture sector. Additionally, manufacturers in the cattle blower market are being given lucrative development prospects by the proliferation of e-commerce channels in India.

What Makes Japan a Booming Market for Cattle Blowers?

Since the 1960s, raising cattle for beef has grown to be a key aspect of Japanese agriculture. The most well-known beef-raising region in Japan is Matsuzaka in Mie. The globally recognized beef is only found in Japan. The excellent quality of the food they are fed and their biological characteristics are what really determine their quality. The fact that each farmer develops their own intricate procedure to raise cows to the ideal size and form after providing them with the right care. As a result, enterprises are likely to find the Japanese cattle blower market to be full of opportunities for trading.

Country Japan
Market Share (2022) 5.30%
Market Value (2022) US$ 13.0 Million

Currently, in Japan, the animal husbandry industry is expanding dramatically. It is projected that this would enhance demand for livestock farming equipment. As a consequence, market participants in Japan are likely to gain profit considerably.

Get the data you need at a Fraction of the cost

Personalize your report by choosing insights you need
and save 40%!

Which Cattle Blower Market Segments Bring in a Lot of Turnovers?

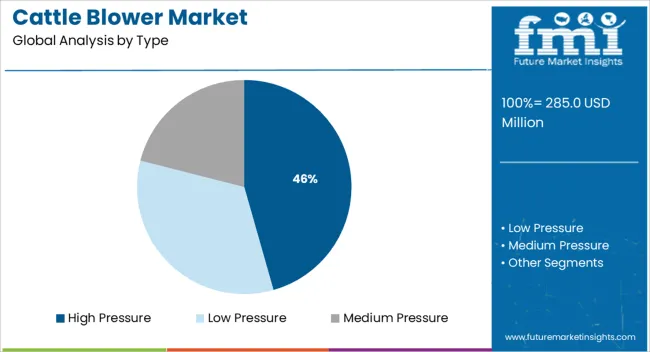
The global market for cattle blowers is segmented based on type, motor, application, and region.

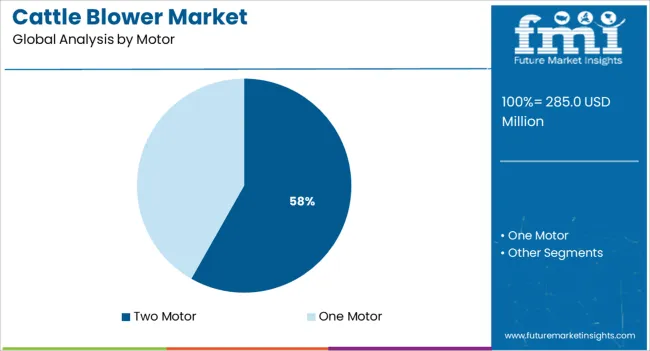
Two Motor Blowers are Mostly Preferred by Farmers

Two-motor cattle blowers are the most popular choice among farmers for sensible reasons. In comparison to single-motor blowers, two-motor blowers have a significant benefit since they are more power-efficient, can manage high flow rates, and are insensitive to changes in water depth. They essentially offer a constant flow rate regardless of back pressure, keeping the level of dissolved oxygen constant. These devices have a wide range of uses. They need little upkeep and don't require any internal changes, resulting in lengthy periods of uninterrupted operation.

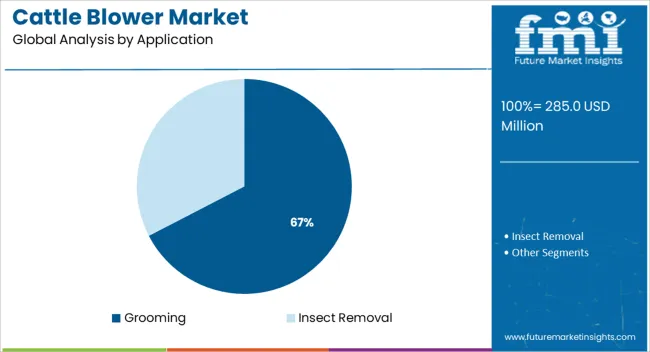
Cattle Blowers are Best for Grooming

In addition to washing an animal and providing sanitary care, grooming also refers to techniques used to improve a livestock's outward look. Grooming can reveal signs of illness and symptoms, as well as assist avoid significant health problems. Animal health and wellness depend on proper grooming, which can also improve the animals' enjoyment of life. Regular grooming ensures the health and comfort of the cattle.

Growing concern for the welfare of animals is a significant reason driving up demand for cattle blowers. With many nations having a high incidence of livestock production and rising animal health spending, the market for cattle blowers has been expanding dramatically over time. People are spending more money to preserve the health of the livestock animals they own because they consider them to be part of their families and are prepared to make the necessary investments. The cost of caring for animals has increased as a result of this circumstance.

Market Players Aids Farm Owners in Making Money by Providing Novel Products

The global cattle blower market seems to be very fragmented. The market is very competitive, as evidenced by the presence of a diverse group of active manufacturers. Businesses in this sector are using a variety of strategies to stay afloat amid the intense competition. Manufacturers strive to improve the cattle blowers they now sell on the market in addition to creating new ones. Additionally, they are developing beneficial relationships with other companies operating in corresponding industries. They are forging relationships with other businesses to increase their chances of entering profitable markets.

  • Barn World

Barn World gives customers access to the largest selection of cattle and ranch products, enabling them to discover exactly what they need to complete their tasks. Customers can discover essential livestock supplies including feeders, grain bins, cow guards, heat pads, animal shelters, storage tanks, and even sizable structures and barns within its portfolio. The business also offers its consumers the advice and assistance they require.

  • Show Stopper Equipment

Since 1965, Vittetoe, Inc. has produced cattle equipment. The Show Stopper Equipment range of products and show supplies was created by the firm as a result of its passion, expertise, and experience in the cattle sector.

  • The Cattle Shop

Since 2006, The Cattle Shop has provided and serviced cattle grooming products. It attends many youth and country shows, the Royal Shows in Sydney, Melbourne, and Canberra, as well as the majority of the large breed bull sales and shows in Wodonga and Dubbo.

  • Husqvarna

The professional blowers from Husqvarna are built to provide unmatched comfort and excellent power. Unique fans on Husqvarna blowers produce forceful airflow and high air velocity.

  • The Toro Company

Golf courses, professional contractors, groundskeepers, agricultural growers, rental companies, government and educational institutions, and homeowners, as well as numerous prestigious sporting arenas and historic sites around the world, can all benefit from the wide range of products offered by Toro.
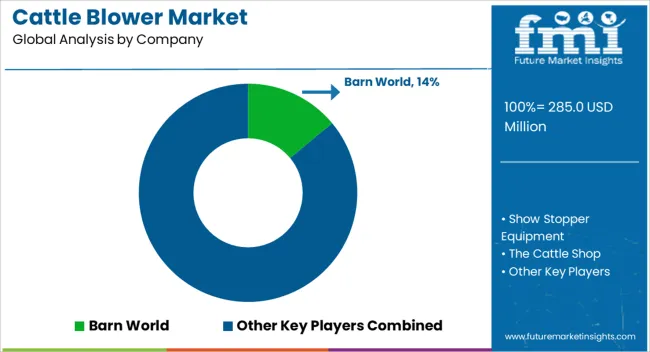
What are Competitors Currently Doing in the Market?

  • In September 2022, for a less expensive solution, Greenworks produced a 450 CFM battery-powered blower.
  • In July 2020, the launch of The Toro Company's Sustainability Endures platform was announced. This is done in order to reinforce TTC's strategic focus on sustainability and its steadfast dedication to having a good global influence on the financial, social, and environmental fronts.

Other Major Playera Operating in the Market:

  • Greenworks
  • Worx
  • Micronel
  • GAST
  • LEISTER Technologies AG

Cattle Blower Market Segmentation

By Type:

  • Low Pressure
  • Medium Pressure
  • High Pressure

By Motor:

  • One Motor
  • Two Motor

By Application:

  • Grooming
  • Insect Removal

By Region:

  • North America
  • Latin America
  • Europe
  • East Asia
  • South Asia
  • Middle East & Africa (MEA)

Frequently Asked Questions

What is the Size of the Global Cattle Blower Market in 2023?

The market for cattle blowers accounted for a market value of US$ 258 Million in 2023.

What is the Expected Growth Rate of the Global Cattle Blower Market?

The market for cattle blowers is estimated to record a CAGR of 5.1% during the forecast period.

What is the Projected Size of the Global Cattle Blower Market in 2033?

The market size for cattle blowers is predicted to be valued at US$ 424 Million by 2033.

Which is the Leading Region in the Global Cattle Blower Market?

North America dominates the global market for cattle blowers followed by Europe.

Table of Content

1. Executive Summary | Cattle Blower Market

    1.1. Global Market Outlook

    1.2. Demand-side Trends

    1.3. Supply-side Trends

    1.4. Technology Roadmap Analysis

    1.5. Analysis and Recommendations

2. Market Overview

    2.1. Market Coverage / Taxonomy

    2.2. Market Definition / Scope / Limitations

3. Market Background

    3.1. Market Dynamics

        3.1.1. Drivers

        3.1.2. Restraints

        3.1.3. Opportunity

        3.1.4. Trends

    3.2. Scenario Forecast

        3.2.1. Demand in Optimistic Scenario

        3.2.2. Demand in Likely Scenario

        3.2.3. Demand in Conservative Scenario

    3.3. Opportunity Map Analysis

    3.4. Product Life Cycle Analysis

    3.5. Supply Chain Analysis

        3.5.1. Supply Side Participants and their Roles

            3.5.1.1. Producers

            3.5.1.2. Mid-Level Participants (Traders / Agents / Brokers)

            3.5.1.3. Wholesalers and Distributors

        3.5.2. Value Added and Value Created at Node in the Supply Chain

        3.5.3. List of Raw Material Suppliers

        3.5.4. List of Existing and Potential Buyers

    3.6. Investment Feasibility Matrix

    3.7. Value Chain Analysis

        3.7.1. Profit Margin Analysis

        3.7.2. Wholesalers and Distributors

        3.7.3. Retailers

    3.8. PESTLE and Porter’s Analysis

    3.9. Regulatory Landscape

        3.9.1. By Key Regions

        3.9.2. By Key Countries

    3.10. Regional Parent Market Outlook

    3.11. Production and Consumption Statistics

    3.12. Import and Export Statistics

4. Global Market Analysis 2018 to 2022 and Forecast, 2023 to 2033

    4.1. Historical Market Size Value (US$ Million) & Volume (Units) Analysis, 2018 to 2022

    4.2. Current and Future Market Size Value (US$ Million) & Volume (Units) Projections, 2023 to 2033

        4.2.1. Y-o-Y Growth Trend Analysis

        4.2.2. Absolute $ Opportunity Analysis

5. Global Market Analysis 2018 to 2022 and Forecast 2023 to 2033, By Type

    5.1. Introduction / Key Findings

    5.2. Historical Market Size Value (US$ Million) & Volume (Units) Analysis By Type, 2018 to 2022

    5.3. Current and Future Market Size Value (US$ Million) & Volume (Units) Analysis and Forecast By Type, 2023 to 2033

        5.3.1. Low Pressure

        5.3.2. Medium Pressure

        5.3.3. High Pressure

    5.4. Y-o-Y Growth Trend Analysis By Type, 2018 to 2022

    5.5. Absolute $ Opportunity Analysis By Type, 2023 to 2033

6. Global Market Analysis 2018 to 2022 and Forecast 2023 to 2033, By Motor

    6.1. Introduction / Key Findings

    6.2. Historical Market Size Value (US$ Million) & Volume (Units) Analysis By Motor, 2018 to 2022

    6.3. Current and Future Market Size Value (US$ Million) & Volume (Units) Analysis and Forecast By Motor, 2023 to 2033

        6.3.1. One Motor

        6.3.2. Two Motors

    6.4. Y-o-Y Growth Trend Analysis By Motor, 2018 to 2022

    6.5. Absolute $ Opportunity Analysis By Motor, 2023 to 2033

7. Global Market Analysis 2018 to 2022 and Forecast 2023 to 2033, By Application

    7.1. Introduction / Key Findings

    7.2. Historical Market Size Value (US$ Million) & Volume (Units) Analysis By Application, 2018 to 2022

    7.3. Current and Future Market Size Value (US$ Million) & Volume (Units) Analysis and Forecast By Application, 2023 to 2033

        7.3.1. Grooming

        7.3.2. Insect Removal

    7.4. Y-o-Y Growth Trend Analysis By Application, 2018 to 2022

    7.5. Absolute $ Opportunity Analysis By Application, 2023 to 2033

8. Global Market Analysis 2018 to 2022 and Forecast 2023 to 2033, By Region

    8.1. Introduction

    8.2. Historical Market Size Value (US$ Million) & Volume (Units) Analysis By Region, 2018 to 2022

    8.3. Current Market Size Value (US$ Million) & Volume (Units) Analysis and Forecast By Region, 2023 to 2033

        8.3.1. North America

        8.3.2. Latin America

        8.3.3. Europe

        8.3.4. Asia Pacific

        8.3.5. Middle East & Africa (MEA)

    8.4. Market Attractiveness Analysis By Region

9. North America Market Analysis 2018 to 2022 and Forecast 2023 to 2033, By Country

    9.1. Historical Market Size Value (US$ Million) & Volume (Units) Trend Analysis By Market Taxonomy, 2018 to 2022

    9.2. Market Size Value (US$ Million) & Volume (Units) Forecast By Market Taxonomy, 2023 to 2033

        9.2.1. By Country

            9.2.1.1. The US

            9.2.1.2. Canada

        9.2.2. By Type

        9.2.3. By Motor

        9.2.4. By Application

    9.3. Market Attractiveness Analysis

        9.3.1. By Country

        9.3.2. By Type

        9.3.3. By Motor

        9.3.4. By Application

    9.4. Key Takeaways

10. Latin America Market Analysis 2018 to 2022 and Forecast 2023 to 2033, By Country

    10.1. Historical Market Size Value (US$ Million) & Volume (Units) Trend Analysis By Market Taxonomy, 2018 to 2022

    10.2. Market Size Value (US$ Million) & Volume (Units) Forecast By Market Taxonomy, 2023 to 2033

        10.2.1. By Country

            10.2.1.1. Brazil

            10.2.1.2. Mexico

            10.2.1.3. Rest of Latin America

        10.2.2. By Type

        10.2.3. By Motor

        10.2.4. By Application

    10.3. Market Attractiveness Analysis

        10.3.1. By Country

        10.3.2. By Type

        10.3.3. By Motor

        10.3.4. By Application

    10.4. Key Takeaways

11. Europe Market Analysis 2018 to 2022 and Forecast 2023 to 2033, By Country

    11.1. Historical Market Size Value (US$ Million) & Volume (Units) Trend Analysis By Market Taxonomy, 2018 to 2022

    11.2. Market Size Value (US$ Million) & Volume (Units) Forecast By Market Taxonomy, 2023 to 2033

        11.2.1. By Country

            11.2.1.1. Germany

            11.2.1.2. The UK

            11.2.1.3. France

            11.2.1.4. Spain

            11.2.1.5. Italy

            11.2.1.6. Rest of Europe

        11.2.2. By Type

        11.2.3. By Motor

        11.2.4. By Application

    11.3. Market Attractiveness Analysis

        11.3.1. By Country

        11.3.2. By Type

        11.3.3. By Motor

        11.3.4. By Application

    11.4. Key Takeaways

12. Asia Pacific Market Analysis 2018 to 2022 and Forecast 2023 to 2033, By Country

    12.1. Historical Market Size Value (US$ Million) & Volume (Units) Trend Analysis By Market Taxonomy, 2018 to 2022

    12.2. Market Size Value (US$ Million) & Volume (Units) Forecast By Market Taxonomy, 2023 to 2033

        12.2.1. By Country

            12.2.1.1. China

            12.2.1.2. Japan

            12.2.1.3. South Korea

            12.2.1.4. Singapore

            12.2.1.5. Thailand

            12.2.1.6. Indonesia

            12.2.1.7. Australia

            12.2.1.8. New Zealand

            12.2.1.9. Rest of Asia Pacific

        12.2.2. By Type

        12.2.3. By Motor

        12.2.4. By Application

    12.3. Market Attractiveness Analysis

        12.3.1. By Country

        12.3.2. By Type

        12.3.3. By Motor

        12.3.4. By Application

    12.4. Key Takeaways

13. MEA Market Analysis 2018 to 2022 and Forecast 2023 to 2033, By Country

    13.1. Historical Market Size Value (US$ Million) & Volume (Units) Trend Analysis By Market Taxonomy, 2018 to 2022

    13.2. Market Size Value (US$ Million) & Volume (Units) Forecast By Market Taxonomy, 2023 to 2033

        13.2.1. By Country

            13.2.1.1. GCC Countries

            13.2.1.2. South Africa

            13.2.1.3. Israel

            13.2.1.4. Rest of MEA

        13.2.2. By Type

        13.2.3. By Motor

        13.2.4. By Application

    13.3. Market Attractiveness Analysis

        13.3.1. By Country

        13.3.2. By Type

        13.3.3. By Motor

        13.3.4. By Application

    13.4. Key Takeaways

14. Key Countries Market Analysis

    14.1. The US

        14.1.1. Pricing Analysis

        14.1.2. Market Share Analysis, 2022

            14.1.2.1. By Type

            14.1.2.2. By Motor

            14.1.2.3. By Application

    14.2. Canada

        14.2.1. Pricing Analysis

        14.2.2. Market Share Analysis, 2022

            14.2.2.1. By Type

            14.2.2.2. By Motor

            14.2.2.3. By Application

    14.3. Brazil

        14.3.1. Pricing Analysis

        14.3.2. Market Share Analysis, 2022

            14.3.2.1. By Type

            14.3.2.2. By Motor

            14.3.2.3. By Application

    14.4. Mexico

        14.4.1. Pricing Analysis

        14.4.2. Market Share Analysis, 2022

            14.4.2.1. By Type

            14.4.2.2. By Motor

            14.4.2.3. By Application

    14.5. Germany

        14.5.1. Pricing Analysis

        14.5.2. Market Share Analysis, 2022

            14.5.2.1. By Type

            14.5.2.2. By Motor

            14.5.2.3. By Application

    14.6. The UK

        14.6.1. Pricing Analysis

        14.6.2. Market Share Analysis, 2022

            14.6.2.1. By Type

            14.6.2.2. By Motor

            14.6.2.3. By Application

    14.7. France

        14.7.1. Pricing Analysis

        14.7.2. Market Share Analysis, 2022

            14.7.2.1. By Type

            14.7.2.2. By Motor

            14.7.2.3. By Application

    14.8. Spain

        14.8.1. Pricing Analysis

        14.8.2. Market Share Analysis, 2022

            14.8.2.1. By Type

            14.8.2.2. By Motor

            14.8.2.3. By Application

    14.9. Italy

        14.9.1. Pricing Analysis

        14.9.2. Market Share Analysis, 2022

            14.9.2.1. By Type

            14.9.2.2. By Motor

            14.9.2.3. By Application

    14.10. China

        14.10.1. Pricing Analysis

        14.10.2. Market Share Analysis, 2022

            14.10.2.1. By Type

            14.10.2.2. By Motor

            14.10.2.3. By Application

    14.11. Japan

        14.11.1. Pricing Analysis

        14.11.2. Market Share Analysis, 2022

            14.11.2.1. By Type

            14.11.2.2. By Motor

            14.11.2.3. By Application

    14.12. South Korea

        14.12.1. Pricing Analysis

        14.12.2. Market Share Analysis, 2022

            14.12.2.1. By Type

            14.12.2.2. By Motor

            14.12.2.3. By Application

    14.13. Singapore

        14.13.1. Pricing Analysis

        14.13.2. Market Share Analysis, 2022

            14.13.2.1. By Type

            14.13.2.2. By Motor

            14.13.2.3. By Application

    14.14. Thailand

        14.14.1. Pricing Analysis

        14.14.2. Market Share Analysis, 2022

            14.14.2.1. By Type

            14.14.2.2. By Motor

            14.14.2.3. By Application

    14.15. Indonesia

        14.15.1. Pricing Analysis

        14.15.2. Market Share Analysis, 2022

            14.15.2.1. By Type

            14.15.2.2. By Motor

            14.15.2.3. By Application

    14.16. Australia

        14.16.1. Pricing Analysis

        14.16.2. Market Share Analysis, 2022

            14.16.2.1. By Type

            14.16.2.2. By Motor

            14.16.2.3. By Application

    14.17. New Zealand

        14.17.1. Pricing Analysis

        14.17.2. Market Share Analysis, 2022

            14.17.2.1. By Type

            14.17.2.2. By Motor

            14.17.2.3. By Application

    14.18. GCC Countries

        14.18.1. Pricing Analysis

        14.18.2. Market Share Analysis, 2022

            14.18.2.1. By Type

            14.18.2.2. By Motor

            14.18.2.3. By Application

    14.19. South Africa

        14.19.1. Pricing Analysis

        14.19.2. Market Share Analysis, 2022

            14.19.2.1. By Type

            14.19.2.2. By Motor

            14.19.2.3. By Application

    14.20. Israel

        14.20.1. Pricing Analysis

        14.20.2. Market Share Analysis, 2022

            14.20.2.1. By Type

            14.20.2.2. By Motor

            14.20.2.3. By Application

15. Market Structure Analysis

    15.1. Competition Dashboard

    15.2. Competition Benchmarking

    15.3. Market Share Analysis of Top Players

        15.3.1. By Regional

        15.3.2. By Type

        15.3.3. By Motor

        15.3.4. By Application

16. Competition Analysis

    16.1. Competition Deep Dive

        16.1.1. Barn World

            16.1.1.1. Overview

            16.1.1.2. Product Portfolio

            16.1.1.3. Profitability by Market Segments

            16.1.1.4. Sales Footprint

            16.1.1.5. Strategy Overview

                16.1.1.5.1. Marketing Strategy

                16.1.1.5.2. Product Strategy

                16.1.1.5.3. Channel Strategy

        16.1.2. Show Stopper Equipment

            16.1.2.1. Overview

            16.1.2.2. Product Portfolio

            16.1.2.3. Profitability by Market Segments

            16.1.2.4. Sales Footprint

            16.1.2.5. Strategy Overview

                16.1.2.5.1. Marketing Strategy

                16.1.2.5.2. Product Strategy

                16.1.2.5.3. Channel Strategy

        16.1.3. The Cattle Shop

            16.1.3.1. Overview

            16.1.3.2. Product Portfolio

            16.1.3.3. Profitability by Market Segments

            16.1.3.4. Sales Footprint

            16.1.3.5. Strategy Overview

                16.1.3.5.1. Marketing Strategy

                16.1.3.5.2. Product Strategy

                16.1.3.5.3. Channel Strategy

        16.1.4. Husqvarna

            16.1.4.1. Overview

            16.1.4.2. Product Portfolio

            16.1.4.3. Profitability by Market Segments

            16.1.4.4. Sales Footprint

            16.1.4.5. Strategy Overview

                16.1.4.5.1. Marketing Strategy

                16.1.4.5.2. Product Strategy

                16.1.4.5.3. Channel Strategy

        16.1.5. Greenworks

            16.1.5.1. Overview

            16.1.5.2. Product Portfolio

            16.1.5.3. Profitability by Market Segments

            16.1.5.4. Sales Footprint

            16.1.5.5. Strategy Overview

                16.1.5.5.1. Marketing Strategy

                16.1.5.5.2. Product Strategy

                16.1.5.5.3. Channel Strategy

        16.1.6. Toro

            16.1.6.1. Overview

            16.1.6.2. Product Portfolio

            16.1.6.3. Profitability by Market Segments

            16.1.6.4. Sales Footprint

            16.1.6.5. Strategy Overview

                16.1.6.5.1. Marketing Strategy

                16.1.6.5.2. Product Strategy

                16.1.6.5.3. Channel Strategy

        16.1.7. Worx

            16.1.7.1. Overview

            16.1.7.2. Product Portfolio

            16.1.7.3. Profitability by Market Segments

            16.1.7.4. Sales Footprint

            16.1.7.5. Strategy Overview

                16.1.7.5.1. Marketing Strategy

                16.1.7.5.2. Product Strategy

                16.1.7.5.3. Channel Strategy

        16.1.8. Micronel

            16.1.8.1. Overview

            16.1.8.2. Product Portfolio

            16.1.8.3. Profitability by Market Segments

            16.1.8.4. Sales Footprint

            16.1.8.5. Strategy Overview

                16.1.8.5.1. Marketing Strategy

                16.1.8.5.2. Product Strategy

                16.1.8.5.3. Channel Strategy

        16.1.9. GAST

            16.1.9.1. Overview

            16.1.9.2. Product Portfolio

            16.1.9.3. Profitability by Market Segments

            16.1.9.4. Sales Footprint

            16.1.9.5. Strategy Overview

                16.1.9.5.1. Marketing Strategy

                16.1.9.5.2. Product Strategy

                16.1.9.5.3. Channel Strategy

        16.1.10. LEISTER Technologies AG

            16.1.10.1. Overview

            16.1.10.2. Product Portfolio

            16.1.10.3. Profitability by Market Segments

            16.1.10.4. Sales Footprint

            16.1.10.5. Strategy Overview

                16.1.10.5.1. Marketing Strategy

                16.1.10.5.2. Product Strategy

                16.1.10.5.3. Channel Strategy

17. Assumptions & Acronyms Used

18. Research Methodology

Don't pay for what you don't need

Customize your report by selecting specific countries or regions and save 30%!

List of Tables

Table 1: Global Market Value (US$ Million) Forecast by Region, 2018 to 2033

Table 2: Global Market Volume (Units) Forecast by Region, 2018 to 2033

Table 3: Global Market Value (US$ Million) Forecast by Type, 2018 to 2033

Table 4: Global Market Volume (Units) Forecast by Type, 2018 to 2033

Table 5: Global Market Value (US$ Million) Forecast by Motor, 2018 to 2033

Table 6: Global Market Volume (Units) Forecast by Motor, 2018 to 2033

Table 7: Global Market Value (US$ Million) Forecast by Application, 2018 to 2033

Table 8: Global Market Volume (Units) Forecast by Application, 2018 to 2033

Table 9: North America Market Value (US$ Million) Forecast by Country, 2018 to 2033

Table 10: North America Market Volume (Units) Forecast by Country, 2018 to 2033

Table 11: North America Market Value (US$ Million) Forecast by Type, 2018 to 2033

Table 12: North America Market Volume (Units) Forecast by Type, 2018 to 2033

Table 13: North America Market Value (US$ Million) Forecast by Motor, 2018 to 2033

Table 14: North America Market Volume (Units) Forecast by Motor, 2018 to 2033

Table 15: North America Market Value (US$ Million) Forecast by Application, 2018 to 2033

Table 16: North America Market Volume (Units) Forecast by Application, 2018 to 2033

Table 17: Latin America Market Value (US$ Million) Forecast by Country, 2018 to 2033

Table 18: Latin America Market Volume (Units) Forecast by Country, 2018 to 2033

Table 19: Latin America Market Value (US$ Million) Forecast by Type, 2018 to 2033

Table 20: Latin America Market Volume (Units) Forecast by Type, 2018 to 2033

Table 21: Latin America Market Value (US$ Million) Forecast by Motor, 2018 to 2033

Table 22: Latin America Market Volume (Units) Forecast by Motor, 2018 to 2033

Table 23: Latin America Market Value (US$ Million) Forecast by Application, 2018 to 2033

Table 24: Latin America Market Volume (Units) Forecast by Application, 2018 to 2033

Table 25: Europe Market Value (US$ Million) Forecast by Country, 2018 to 2033

Table 26: Europe Market Volume (Units) Forecast by Country, 2018 to 2033

Table 27: Europe Market Value (US$ Million) Forecast by Type, 2018 to 2033

Table 28: Europe Market Volume (Units) Forecast by Type, 2018 to 2033

Table 29: Europe Market Value (US$ Million) Forecast by Motor, 2018 to 2033

Table 30: Europe Market Volume (Units) Forecast by Motor, 2018 to 2033

Table 31: Europe Market Value (US$ Million) Forecast by Application, 2018 to 2033

Table 32: Europe Market Volume (Units) Forecast by Application, 2018 to 2033

Table 33: Asia Pacific Market Value (US$ Million) Forecast by Country, 2018 to 2033

Table 34: Asia Pacific Market Volume (Units) Forecast by Country, 2018 to 2033

Table 35: Asia Pacific Market Value (US$ Million) Forecast by Type, 2018 to 2033

Table 36: Asia Pacific Market Volume (Units) Forecast by Type, 2018 to 2033

Table 37: Asia Pacific Market Value (US$ Million) Forecast by Motor, 2018 to 2033

Table 38: Asia Pacific Market Volume (Units) Forecast by Motor, 2018 to 2033

Table 39: Asia Pacific Market Value (US$ Million) Forecast by Application, 2018 to 2033

Table 40: Asia Pacific Market Volume (Units) Forecast by Application, 2018 to 2033

Table 41: MEA Market Value (US$ Million) Forecast by Country, 2018 to 2033

Table 42: MEA Market Volume (Units) Forecast by Country, 2018 to 2033

Table 43: MEA Market Value (US$ Million) Forecast by Type, 2018 to 2033

Table 44: MEA Market Volume (Units) Forecast by Type, 2018 to 2033

Table 45: MEA Market Value (US$ Million) Forecast by Motor, 2018 to 2033

Table 46: MEA Market Volume (Units) Forecast by Motor, 2018 to 2033

Table 47: MEA Market Value (US$ Million) Forecast by Application, 2018 to 2033

Table 48: MEA Market Volume (Units) Forecast by Application, 2018 to 2033
Nikhil Kaitwade
Nikhil Kaitwade

Principal Consultant

Talk to Analyst

Find your sweet spots for generating winning opportunities in this market.

List of Charts

Figure 1: Global Market Value (US$ Million) by Type, 2023 to 2033

Figure 2: Global Market Value (US$ Million) by Motor, 2023 to 2033

Figure 3: Global Market Value (US$ Million) by Application, 2023 to 2033

Figure 4: Global Market Value (US$ Million) by Region, 2023 to 2033

Figure 5: Global Market Value (US$ Million) Analysis by Region, 2018 to 2033

Figure 6: Global Market Volume (Units) Analysis by Region, 2018 to 2033

Figure 7: Global Market Value Share (%) and BPS Analysis by Region, 2023 to 2033

Figure 8: Global Market Y-o-Y Growth (%) Projections by Region, 2023 to 2033

Figure 9: Global Market Value (US$ Million) Analysis by Type, 2018 to 2033

Figure 10: Global Market Volume (Units) Analysis by Type, 2018 to 2033

Figure 11: Global Market Value Share (%) and BPS Analysis by Type, 2023 to 2033

Figure 12: Global Market Y-o-Y Growth (%) Projections by Type, 2023 to 2033

Figure 13: Global Market Value (US$ Million) Analysis by Motor, 2018 to 2033

Figure 14: Global Market Volume (Units) Analysis by Motor, 2018 to 2033

Figure 15: Global Market Value Share (%) and BPS Analysis by Motor, 2023 to 2033

Figure 16: Global Market Y-o-Y Growth (%) Projections by Motor, 2023 to 2033

Figure 17: Global Market Value (US$ Million) Analysis by Application, 2018 to 2033

Figure 18: Global Market Volume (Units) Analysis by Application, 2018 to 2033

Figure 19: Global Market Value Share (%) and BPS Analysis by Application, 2023 to 2033

Figure 20: Global Market Y-o-Y Growth (%) Projections by Application, 2023 to 2033

Figure 21: Global Market Attractiveness by Type, 2023 to 2033

Figure 22: Global Market Attractiveness by Motor, 2023 to 2033

Figure 23: Global Market Attractiveness by Application, 2023 to 2033

Figure 24: Global Market Attractiveness by Region, 2023 to 2033

Figure 25: North America Market Value (US$ Million) by Type, 2023 to 2033

Figure 26: North America Market Value (US$ Million) by Motor, 2023 to 2033

Figure 27: North America Market Value (US$ Million) by Application, 2023 to 2033

Figure 28: North America Market Value (US$ Million) by Country, 2023 to 2033

Figure 29: North America Market Value (US$ Million) Analysis by Country, 2018 to 2033

Figure 30: North America Market Volume (Units) Analysis by Country, 2018 to 2033

Figure 31: North America Market Value Share (%) and BPS Analysis by Country, 2023 to 2033

Figure 32: North America Market Y-o-Y Growth (%) Projections by Country, 2023 to 2033

Figure 33: North America Market Value (US$ Million) Analysis by Type, 2018 to 2033

Figure 34: North America Market Volume (Units) Analysis by Type, 2018 to 2033

Figure 35: North America Market Value Share (%) and BPS Analysis by Type, 2023 to 2033

Figure 36: North America Market Y-o-Y Growth (%) Projections by Type, 2023 to 2033

Figure 37: North America Market Value (US$ Million) Analysis by Motor, 2018 to 2033

Figure 38: North America Market Volume (Units) Analysis by Motor, 2018 to 2033

Figure 39: North America Market Value Share (%) and BPS Analysis by Motor, 2023 to 2033

Figure 40: North America Market Y-o-Y Growth (%) Projections by Motor, 2023 to 2033

Figure 41: North America Market Value (US$ Million) Analysis by Application, 2018 to 2033

Figure 42: North America Market Volume (Units) Analysis by Application, 2018 to 2033

Figure 43: North America Market Value Share (%) and BPS Analysis by Application, 2023 to 2033

Figure 44: North America Market Y-o-Y Growth (%) Projections by Application, 2023 to 2033

Figure 45: North America Market Attractiveness by Type, 2023 to 2033

Figure 46: North America Market Attractiveness by Motor, 2023 to 2033

Figure 47: North America Market Attractiveness by Application, 2023 to 2033

Figure 48: North America Market Attractiveness by Country, 2023 to 2033

Figure 49: Latin America Market Value (US$ Million) by Type, 2023 to 2033

Figure 50: Latin America Market Value (US$ Million) by Motor, 2023 to 2033

Figure 51: Latin America Market Value (US$ Million) by Application, 2023 to 2033

Figure 52: Latin America Market Value (US$ Million) by Country, 2023 to 2033

Figure 53: Latin America Market Value (US$ Million) Analysis by Country, 2018 to 2033

Figure 54: Latin America Market Volume (Units) Analysis by Country, 2018 to 2033

Figure 55: Latin America Market Value Share (%) and BPS Analysis by Country, 2023 to 2033

Figure 56: Latin America Market Y-o-Y Growth (%) Projections by Country, 2023 to 2033

Figure 57: Latin America Market Value (US$ Million) Analysis by Type, 2018 to 2033

Figure 58: Latin America Market Volume (Units) Analysis by Type, 2018 to 2033

Figure 59: Latin America Market Value Share (%) and BPS Analysis by Type, 2023 to 2033

Figure 60: Latin America Market Y-o-Y Growth (%) Projections by Type, 2023 to 2033

Figure 61: Latin America Market Value (US$ Million) Analysis by Motor, 2018 to 2033

Figure 62: Latin America Market Volume (Units) Analysis by Motor, 2018 to 2033

Figure 63: Latin America Market Value Share (%) and BPS Analysis by Motor, 2023 to 2033

Figure 64: Latin America Market Y-o-Y Growth (%) Projections by Motor, 2023 to 2033

Figure 65: Latin America Market Value (US$ Million) Analysis by Application, 2018 to 2033

Figure 66: Latin America Market Volume (Units) Analysis by Application, 2018 to 2033

Figure 67: Latin America Market Value Share (%) and BPS Analysis by Application, 2023 to 2033

Figure 68: Latin America Market Y-o-Y Growth (%) Projections by Application, 2023 to 2033

Figure 69: Latin America Market Attractiveness by Type, 2023 to 2033

Figure 70: Latin America Market Attractiveness by Motor, 2023 to 2033

Figure 71: Latin America Market Attractiveness by Application, 2023 to 2033

Figure 72: Latin America Market Attractiveness by Country, 2023 to 2033

Figure 73: Europe Market Value (US$ Million) by Type, 2023 to 2033

Figure 74: Europe Market Value (US$ Million) by Motor, 2023 to 2033

Figure 75: Europe Market Value (US$ Million) by Application, 2023 to 2033

Figure 76: Europe Market Value (US$ Million) by Country, 2023 to 2033

Figure 77: Europe Market Value (US$ Million) Analysis by Country, 2018 to 2033

Figure 78: Europe Market Volume (Units) Analysis by Country, 2018 to 2033

Figure 79: Europe Market Value Share (%) and BPS Analysis by Country, 2023 to 2033

Figure 80: Europe Market Y-o-Y Growth (%) Projections by Country, 2023 to 2033

Figure 81: Europe Market Value (US$ Million) Analysis by Type, 2018 to 2033

Figure 82: Europe Market Volume (Units) Analysis by Type, 2018 to 2033

Figure 83: Europe Market Value Share (%) and BPS Analysis by Type, 2023 to 2033

Figure 84: Europe Market Y-o-Y Growth (%) Projections by Type, 2023 to 2033

Figure 85: Europe Market Value (US$ Million) Analysis by Motor, 2018 to 2033

Figure 86: Europe Market Volume (Units) Analysis by Motor, 2018 to 2033

Figure 87: Europe Market Value Share (%) and BPS Analysis by Motor, 2023 to 2033

Figure 88: Europe Market Y-o-Y Growth (%) Projections by Motor, 2023 to 2033

Figure 89: Europe Market Value (US$ Million) Analysis by Application, 2018 to 2033

Figure 90: Europe Market Volume (Units) Analysis by Application, 2018 to 2033

Figure 91: Europe Market Value Share (%) and BPS Analysis by Application, 2023 to 2033

Figure 92: Europe Market Y-o-Y Growth (%) Projections by Application, 2023 to 2033

Figure 93: Europe Market Attractiveness by Type, 2023 to 2033

Figure 94: Europe Market Attractiveness by Motor, 2023 to 2033

Figure 95: Europe Market Attractiveness by Application, 2023 to 2033

Figure 96: Europe Market Attractiveness by Country, 2023 to 2033

Figure 97: Asia Pacific Market Value (US$ Million) by Type, 2023 to 2033

Figure 98: Asia Pacific Market Value (US$ Million) by Motor, 2023 to 2033

Figure 99: Asia Pacific Market Value (US$ Million) by Application, 2023 to 2033

Figure 100: Asia Pacific Market Value (US$ Million) by Country, 2023 to 2033

Figure 101: Asia Pacific Market Value (US$ Million) Analysis by Country, 2018 to 2033

Figure 102: Asia Pacific Market Volume (Units) Analysis by Country, 2018 to 2033

Figure 103: Asia Pacific Market Value Share (%) and BPS Analysis by Country, 2023 to 2033

Figure 104: Asia Pacific Market Y-o-Y Growth (%) Projections by Country, 2023 to 2033

Figure 105: Asia Pacific Market Value (US$ Million) Analysis by Type, 2018 to 2033

Figure 106: Asia Pacific Market Volume (Units) Analysis by Type, 2018 to 2033

Figure 107: Asia Pacific Market Value Share (%) and BPS Analysis by Type, 2023 to 2033

Figure 108: Asia Pacific Market Y-o-Y Growth (%) Projections by Type, 2023 to 2033

Figure 109: Asia Pacific Market Value (US$ Million) Analysis by Motor, 2018 to 2033

Figure 110: Asia Pacific Market Volume (Units) Analysis by Motor, 2018 to 2033

Figure 111: Asia Pacific Market Value Share (%) and BPS Analysis by Motor, 2023 to 2033

Figure 112: Asia Pacific Market Y-o-Y Growth (%) Projections by Motor, 2023 to 2033

Figure 113: Asia Pacific Market Value (US$ Million) Analysis by Application, 2018 to 2033

Figure 114: Asia Pacific Market Volume (Units) Analysis by Application, 2018 to 2033

Figure 115: Asia Pacific Market Value Share (%) and BPS Analysis by Application, 2023 to 2033

Figure 116: Asia Pacific Market Y-o-Y Growth (%) Projections by Application, 2023 to 2033

Figure 117: Asia Pacific Market Attractiveness by Type, 2023 to 2033

Figure 118: Asia Pacific Market Attractiveness by Motor, 2023 to 2033

Figure 119: Asia Pacific Market Attractiveness by Application, 2023 to 2033

Figure 120: Asia Pacific Market Attractiveness by Country, 2023 to 2033

Figure 121: MEA Market Value (US$ Million) by Type, 2023 to 2033

Figure 122: MEA Market Value (US$ Million) by Motor, 2023 to 2033

Figure 123: MEA Market Value (US$ Million) by Application, 2023 to 2033

Figure 124: MEA Market Value (US$ Million) by Country, 2023 to 2033

Figure 125: MEA Market Value (US$ Million) Analysis by Country, 2018 to 2033

Figure 126: MEA Market Volume (Units) Analysis by Country, 2018 to 2033

Figure 127: MEA Market Value Share (%) and BPS Analysis by Country, 2023 to 2033

Figure 128: MEA Market Y-o-Y Growth (%) Projections by Country, 2023 to 2033

Figure 129: MEA Market Value (US$ Million) Analysis by Type, 2018 to 2033

Figure 130: MEA Market Volume (Units) Analysis by Type, 2018 to 2033

Figure 131: MEA Market Value Share (%) and BPS Analysis by Type, 2023 to 2033

Figure 132: MEA Market Y-o-Y Growth (%) Projections by Type, 2023 to 2033

Figure 133: MEA Market Value (US$ Million) Analysis by Motor, 2018 to 2033

Figure 134: MEA Market Volume (Units) Analysis by Motor, 2018 to 2033

Figure 135: MEA Market Value Share (%) and BPS Analysis by Motor, 2023 to 2033

Figure 136: MEA Market Y-o-Y Growth (%) Projections by Motor, 2023 to 2033

Figure 137: MEA Market Value (US$ Million) Analysis by Application, 2018 to 2033

Figure 138: MEA Market Volume (Units) Analysis by Application, 2018 to 2033

Figure 139: MEA Market Value Share (%) and BPS Analysis by Application, 2023 to 2033

Figure 140: MEA Market Y-o-Y Growth (%) Projections by Application, 2023 to 2033

Figure 141: MEA Market Attractiveness by Type, 2023 to 2033

Figure 142: MEA Market Attractiveness by Motor, 2023 to 2033

Figure 143: MEA Market Attractiveness by Application, 2023 to 2033

Figure 144: MEA Market Attractiveness by Country, 2023 to 2033

Recommendations

Food and Beverage

Cattle Feed Market

Published : April 2024

Explore Testing Equipment Insights

View Reports