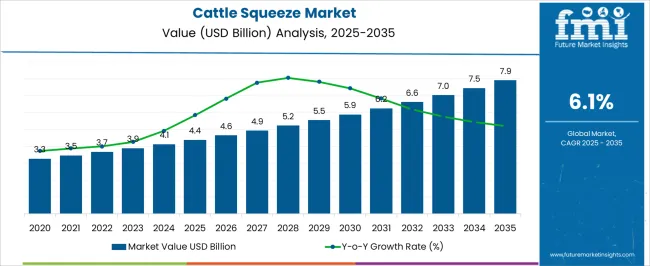
The Cattle Squeeze Market is estimated to be valued at USD 4.4 billion in 2025 and is projected to reach USD 7.9 billion by 2035, registering a compound annual growth rate (CAGR) of 6.1% over the forecast period.
| Metric | Value |
|---|---|
| Cattle Squeeze Market Estimated Value in (2025 E) | USD 4.4 billion |
| Cattle Squeeze Market Forecast Value in (2035 F) | USD 7.9 billion |
| Forecast CAGR (2025 to 2035) | 6.1% |
The cattle squeeze market is expanding steadily as livestock management practices continue to prioritize efficiency, safety, and animal welfare. Growing demand for effective handling equipment is being driven by the need to minimize stress and injury during veterinary procedures, tagging, and regular farm operations.
Hydraulic systems, ergonomic designs, and improved material durability have significantly increased operational convenience for farmers while ensuring higher productivity. The adoption of modern squeeze systems is also being supported by the rising scale of commercial livestock farms and advancements in mechanized farming equipment.
Regulatory emphasis on animal welfare standards and the focus on maximizing livestock yield are further encouraging investments in advanced handling systems. With the increasing global demand for dairy and meat production, the cattle squeeze market outlook remains positive, offering opportunities for technological innovation and adoption across both large and mid sized farming operations.
The market is segmented by Function, Application, and Animal Type and region. By Function, the market is divided into Hydraulic and Manual. In terms of Application, the market is classified into Poultry Farm and Dairy Farm. Based on Animal Type, the market is segmented into Cow, Calf, and Bull. Regionally, the market is classified into North America, Latin America, Western Europe, Eastern Europe, Balkan & Baltic Countries, Russia & Belarus, Central Asia, East Asia, South Asia & Pacific, and the Middle East & Africa.
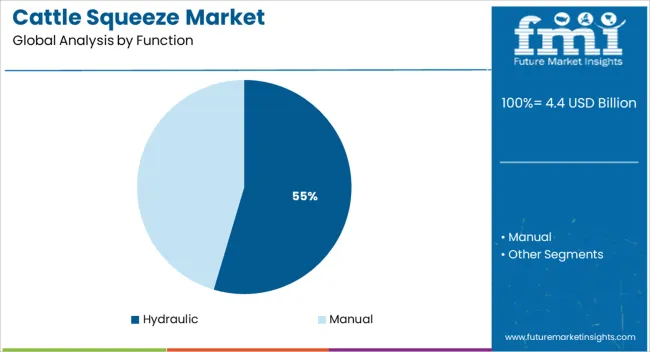
The hydraulic function segment is projected to account for 54.60% of total revenue by 2025, making it the most dominant category. The preference for hydraulic systems is being driven by their superior efficiency, ease of operation, and ability to handle larger livestock with minimal manual effort.
These systems offer adjustable pressure and greater control, which reduces the risk of animal injury and enhances operator safety. Their durability and ability to support heavy duty operations in large scale farms have further accelerated adoption.
As farming practices become increasingly mechanized, hydraulic cattle squeeze systems continue to set the benchmark for productivity and reliability, reinforcing their leadership in the function segment.
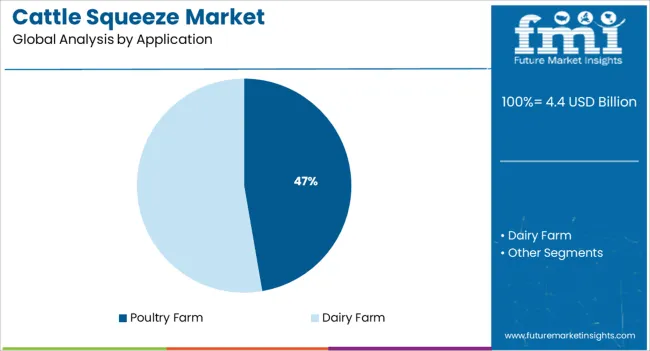
The poultry farm application segment is expected to contribute 47.30% of overall market revenue by 2025, positioning it as the leading application area. The segment’s growth is supported by the increasing global demand for poultry products and the need for efficient handling systems in large scale poultry operations.
Farmers are focusing on minimizing stress during handling to maintain productivity and ensure compliance with welfare regulations. Investments in advanced equipment designed for easy cleaning, faster throughput, and improved worker safety are further propelling adoption.
The poultry sector’s rapid expansion, coupled with technological upgrades, has established poultry farms as a key driver in the cattle squeeze market.
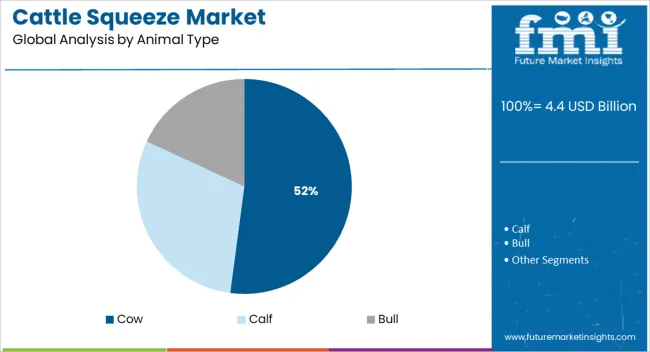
The cow segment is anticipated to hold 52.10% of the total market share by 2025, making it the dominant animal type. This leadership is attributed to the rising global demand for dairy and beef, which has necessitated efficient handling solutions for larger herds.
Cows require precise restraint systems to ensure safe veterinary procedures, breeding management, and productivity monitoring. Hydraulic and mechanically assisted squeeze systems are increasingly being deployed to reduce labor costs while improving handling efficiency.
The segment’s dominance is reinforced by the large contribution of cattle to the global livestock economy, making cows the most significant focus for equipment innovation and adoption in the market.
The cattle squeeze market is projected to register a CAGR of 6.1% between 2025 and 2035. Historically, the market presented moderate growth from 2020 to 2025, exhibiting a CAGR of 5.5%.
Short Term (2025 to 2029): A critical area for research and development in agriculture is the automation of the dairy farming sector. As a result, the entire farming industry is expected to have an impact on the sales of cattle squeeze.
Medium Term (2029 to 2035): The health, hygiene, and prevention of bacterial contamination of cattle and dairy products are continuously monitored by several governmental and commercial agencies. Therefore, a rise in the trend of government funding initiatives for dairy farm productivity is likely to open new market opportunities.
Long Term (2035 to 2035): The cattle business has benefited from the development of hydraulic cattle squeeze chutes. During this time, businesses are expected to spend more money developing higher-quality products that use innovative technologies.
These factors are anticipated to support a 1.8X increase in the cattle squeeze market between 2025 and 2035. The market is projected to be worth USD 7.9 billion by the end of 2035, according to FMI analysts.
| 2020 | USD 2.66 billion |
|---|---|
| 2024 | USD 3.47 billion |
| 2025 | USD 3.66 billion |
| 2025 | USD 3.89 billion |
| 2035 | USD 7.9 billion |
Increasing infection hazards as a result of expanding urbanization and the environment's ongoing change are what cause infectious disease breakouts in the cattle industry. By encouraging the development of micro-parasites and vector-borne disorders, relatively common phenomena like heat stress have the possibility of transmitting infectious strains. Given the frequent outbreaks of bovine diseases, there is a greater need for cattle squeezes for periodic cleaning.
Recent advancements in the management of cattle are enabling relatively high efficiency while also reducing costs. Significant growth variables include rising dairy and meat consumption along with consumer interest in pure and pasture-raised goods. Online retailers selling equipment for raising animals have exploded recently. Consumers can now pick from a broader selection of products. Consumer convenience has increased as a result, and small-scale businesses now have diverse options
Manufacturers now have the possibility to provide a broad selection of equipment and cutting-edge solutions as a result of the rising demand for cattle management and sanitation systems. During the forecast period, market opportunities are expected to be generated by the expansion of agriculture-based industries in developing nations.
Manufacturers are developing hydraulic squeezes to lessen handling-related stress and harm to animals. Many contemporary squeezes include features like cushioned sidewalls and flooring that increase animal comfort and minimize injuries. Cattle cannot escape or get stuck in hydraulic squeeze chutes owing to the automated control mechanisms.
| Country | Market Value (2025) |
|---|---|
| United States | USD 1,081.4 million |
| Germany | USD 638.1 million |
| United Kingdom | USD 359.1 million |
| China | USD 370.43 million |
| Japan | USD 164.0 million |
| India | USD 130.9 million |
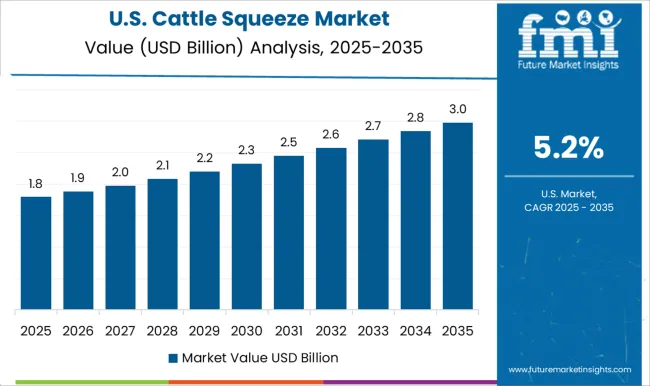
The USA has a sizable population of livestock, and raising cattle is an important part of the country's agricultural economy. As a result, squeeze chutes are in high demand. The market in the country is expanding due to this higher demand. The cattle industry is increasingly utilizing automation and technology, which has resulted in the development of more advanced and effective squeeze chutes. Governments in the USA are enacting rules and regulations to encourage the adoption of animal-friendly innovations in the farming industry, like squeeze chutes.
| Country | Market Share (2025) |
|---|---|
| United States | 29.5% |
According to a study that was commissioned by The National Cattlemen's Beef Association, ranchers place cattle health as their primary concern. They employ comparatively high methods for managing cattle as a part of their stewardship strategies. The nation's understanding of the use of modern livestock management practices has rapidly expanded owing to recent practical experience. As a result, the USA cattle squeeze market has a wealth of options for participants.
Cattle squeeze market growth is expected to be driven by government interventions for the adoption of advanced dairy farming equipment in the agro-industry. This is supremely intended to encourage farmers to purchase equipment that is amicable to animals. The adoption of these chutes is being encouraged by the government in the United Kingdom to enhance animal welfare and save labor costs. Therefore the country is anticipated to play a significant role in this rise.
| Country | United Kingdom |
|---|---|
| CAGR (2025 to 2035) | 6.5% |
| Market Share (2025) | 9.8% |
| Market Value (2035) | USD 676.9 million |
The country has a high general population density and a high demand for proteins including meat and dairy products. To accommodate the demand, ranchers are breeding more cattle. Right now, this territory is home to numerous significant industrial farming facilities. This is anticipated to influence the United Kingdom cattle squeeze market positively.
German cattle squeeze market is a prominent market in Europe since it has a huge dairy cattle population. In this country, dairy cattle are raised on around one in four farms. Livestock farming is the foundation of the German economy. 60% of Germany's agricultural income comes from the sale of goods derived from livestock.
| Country | Market Share (2025) |
|---|---|
| Germany | 17.4% |
Lameness is a complex challenge in the German dairy industry. The infections that cause dairy cattle to become lame pose a serious issue for animal welfare. Another consequence of lameness is stress, which impairs strength and decreases output. To avoid the transmission of lameness, ranchers thus pay close attention to hygiene. As a result, more ranchers are expected to embrace cattle squeeze chutes.
India, the world's prime producer of milk at the present, is crucial to the supply networks of its neighboring countries experiencing milk shortages. Given this, the sector is significant from a socioeconomic perspective. The industry is expected to grow significantly in India because of the country's rising demand for agricultural mechanization and its government support.
| Country | India |
|---|---|
| CAGR (2025 to 2035) | 7.2% |
| Market Share (2025) | 3.6% |
| Market Value (2035) | USD 261.5 million |
Two of the many initiatives the Indian government offers farmers are the Rashtriya Gokul Mission and the National Livestock Mission. By preserving and expanding the local cattle farming sector, these missions seek to promote the sustainable expansion of the livestock industry. As a result, suppliers and producers can make money from the Indian cattle squeeze market.
The domestic agricultural machinery industry in Japan is comparatively shielded from international competitors. This allows Japanese producers to concentrate on creating cutting-edge technologies and equipment for the home market and providing more affordable rates. As a result, Japanese farmers can easily embrace cutting-edge technology like squeeze chutes. Additionally, they have access to high-end machinery at lesser costs than those in other nations.
| Country | Market Share (2025) |
|---|---|
| Japan | 4.5% |
The Japanese government has implemented countless measures to promote the growth of provincial cattle farming. Along with incentives for cattle farmers, they include increasing support for the sector's research and development initiatives. To guarantee animal welfare and safety, the government has also established a transparent system for cattle farming. During the forecast period, this is anticipated to have a positive impact on the Japanese cattle squeeze market.
Owing to an increase in the prevalence of animal illnesses and growing public concern for animal welfare, the Chinese cattle squeeze market is growing into a substantial one. Equipment for efficient and successful cattle management is in more demand due to the expanding high supply of livestock animals.
| Country | China |
|---|---|
| CAGR (2025 to 2035) | 4.9% |
| Market Share (2025) | 10.1% |
| Market Value (2035) | USD 596.9 million |
The application of squeezes makes it easier and faster to immobilize livestock, which saves time and effort while handling them. These squeeze chutes are further made to reduce stress and harm to animals during handling. This is crucial considering the rising prevalence of animal illnesses in China.
The cattle sector in China has significantly improved. Government support, cattle supply, and demand, as well as technological improvement, all favorably affect its development. The country's farmers place strong importance on meticulous and regulated management. They emphasized potential handling process improvements in addition to proper management. As a result, China presents several opportunities for industry participants.
Farms favor hydraulic squeezes because they offer many significant benefits that enable them to quickly recover their investment. Large farms, farms with more than 250 head of cattle, are increasingly preferring hydraulic squeeze chutes since they are sturdy. The safety of the animals and the rancher are prioritized in a well-designed hydraulic chute, which follows low-stress cattle handling techniques. A squeeze chute can securely compress the animal into position using hydraulics or arm force.
Since they only require very less manpower, hydraulic chutes reduce labor costs. Cattle squeeze chutes are animal friendly. The cattle are not actually under pressure; rather, a barrier is formed around them on all four sides, preventing them from backing up or ramming into the sidewalls. They can be opened wider so that cattle can move through them more easily and with less probing and poking nearly regardless of the circumstance. The requirement for facilities to handle cattle more often is typically due to consumer demand for transparency.
Dairy farming has been increasingly intense over the last several years to improve the amount of milk produced by each cow. In their natural state, cows live for roughly 20 years and can continue to produce milk for eight or nine years. A significant proportion of dairy cows are maintained and handled properly with extreme care. Consequently, hydraulic squeeze chutes are crucial for cows.
Similar to humans, cows only produce milk during pregnancy. For dairy cows to continue producing milk, they must give birth to one calf each year. Usually, within three months after giving delivery, they undergo artificial insemination. Dairy farms, therefore, focus more on cows for increased output.
In dairy farming, calves and mother cows are sometimes split up extremely quickly, sometimes only hours after birth. This is done to collect the milk from the cows for human use as it is believed that separating the calves will make them safer. Therefore, farmers adopt cattle squeeze since cows tend to behave atypically after their separation.
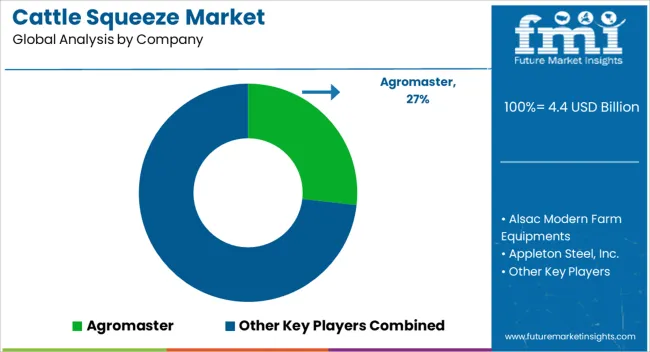
Several businesses are regarded as being at the forefront of the market transformation. The market is extremely competitive, and the top competitors frequently change their strategies. To increase their consumer base, businesses are concentrating on expanding their distribution networks. To meet the needs of farmers, ranchers, and feedlot operators, the firms in this sector are always introducing new and cutting-edge goods.
Arrowquip
In addition to other livestock handling tools, Arrowquip is a top supplier of hydraulic squeeze chutes. They have a large selection of chutes made for various animals, such as cattle, sheep, and goats, and they also come with features like automated head gates, self-catching head gates, and automatic sliding gates.
Agromaster
Since 1962, Agromaster has been working tirelessly by continuously monitoring developments in and trends in global agriculture. The goal of Agromaster is to provide the best price/quality ratio while offering global farmers options for all phases of agricultural production.
Appleton Steel, Inc
Hoof-trimming chutes for farmers are produced by Appleton Steel. Its premium squeeze chute raises the bar as the industry gold standard. The proficiency of the company and its experts is combined with the supreme cutting-edge technology and manufacturing best practices.
Recent Developments
These are only a few examples of businesses that are widely regarded as market leaders in the hydraulic squeeze chute sector. Other well-known producers of cattle squeezes are:
The global cattle squeeze market is estimated to be valued at USD 4.4 billion in 2025.
The market size for the cattle squeeze market is projected to reach USD 7.9 billion by 2035.
The cattle squeeze market is expected to grow at a 6.1% CAGR between 2025 and 2035.
The key product types in cattle squeeze market are hydraulic and manual.
In terms of application, poultry farm segment to command 47.3% share in the cattle squeeze market in 2025.


Our Research Products

The "Full Research Suite" delivers actionable market intel, deep dives on markets or technologies, so clients act faster, cut risk, and unlock growth.

The Leaderboard benchmarks and ranks top vendors, classifying them as Established Leaders, Leading Challengers, or Disruptors & Challengers.

Locates where complements amplify value and substitutes erode it, forecasting net impact by horizon

We deliver granular, decision-grade intel: market sizing, 5-year forecasts, pricing, adoption, usage, revenue, and operational KPIs—plus competitor tracking, regulation, and value chains—across 60 countries broadly.

Spot the shifts before they hit your P&L. We track inflection points, adoption curves, pricing moves, and ecosystem plays to show where demand is heading, why it is changing, and what to do next across high-growth markets and disruptive tech

Real-time reads of user behavior. We track shifting priorities, perceptions of today’s and next-gen services, and provider experience, then pace how fast tech moves from trial to adoption, blending buyer, consumer, and channel inputs with social signals (#WhySwitch, #UX).

Partner with our analyst team to build a custom report designed around your business priorities. From analysing market trends to assessing competitors or crafting bespoke datasets, we tailor insights to your needs.
Supplier Intelligence
Discovery & Profiling
Capacity & Footprint
Performance & Risk
Compliance & Governance
Commercial Readiness
Who Supplies Whom
Scorecards & Shortlists
Playbooks & Docs
Category Intelligence
Definition & Scope
Demand & Use Cases
Cost Drivers
Market Structure
Supply Chain Map
Trade & Policy
Operating Norms
Deliverables
Buyer Intelligence
Account Basics
Spend & Scope
Procurement Model
Vendor Requirements
Terms & Policies
Entry Strategy
Pain Points & Triggers
Outputs
Pricing Analysis
Benchmarks
Trends
Should-Cost
Indexation
Landed Cost
Commercial Terms
Deliverables
Brand Analysis
Positioning & Value Prop
Share & Presence
Customer Evidence
Go-to-Market
Digital & Reputation
Compliance & Trust
KPIs & Gaps
Outputs
Full Research Suite comprises of:
Market outlook & trends analysis
Interviews & case studies
Strategic recommendations
Vendor profiles & capabilities analysis
5-year forecasts
8 regions and 60+ country-level data splits
Market segment data splits
12 months of continuous data updates
DELIVERED AS:
PDF EXCEL ONLINE
Cattle and Sheep Disease Diagnostic Kits Market Size and Share Forecast Outlook 2025 to 2035
Cattle Feed Market Analysis - Size, Share, and Forecast Outlook 2025 to 2035
Cattle Feeder Panels Market Size and Share Forecast Outlook 2025 to 2035
Cattle Head Catch Market Size and Share Forecast Outlook 2025 to 2035
Cattle Grooming Chute Market Size and Share Forecast Outlook 2025 to 2035
Cattle Handling Systems Market Size and Share Forecast Outlook 2025 to 2035
Cattle Blower Market Size and Share Forecast Outlook 2025 to 2035
Cattle Mineral Feeder Market Size and Share Forecast Outlook 2025 to 2035
Cattle Feeder Market Size and Share Forecast Outlook 2025 to 2035
Cattle Management Software Market Size and Share Forecast Outlook 2025 to 2035
Cattle Supplies Market Analysis & Forecast for 2025 to 2035
Cattle Nutrition Market Analysis by Cattle Type, Nutrition Type, Application, Life Stage Through 2025 to 2035
Smart Cattle Market
Dairy Cattle Feed Market
Automatic Cattle Waterer Market – Trends & Growth Forecast 2025 to 2035
Squeeze Pouch Market Growth – Demand & Forecast 2025 to 2035
Squeeze Bottle Market Trends – Growth & Forecast 2024-2034
Squeeze Tube Market
Dropper Squeeze Bottle Market Trends & Industry Growth Forecast 2024-2034
Inverted Squeeze Bottle Market Size and Share Forecast Outlook 2025 to 2035

Thank you!
You will receive an email from our Business Development Manager. Please be sure to check your SPAM/JUNK folder too.
Chat With
MaRIA