Cattle Feed Market Forecast and Outlook 2025 to 2035

The global cattle feed market is projected to grow from USD 133.5 billion in 2025 to approximately USD 193.8 billion by 2035, recording an absolute increase of USD 60.2 billion over the forecast period. This translates into a total growth of 45.1%, with the market forecast to expand at a compound annual growth rate (CAGR) of 3.8% between 2025 and 2035.

The overall market size is expected to grow by nearly 1.45X during the same period, supported by the rising global cattle population and increasing demand for animal protein products across developing and developed markets.
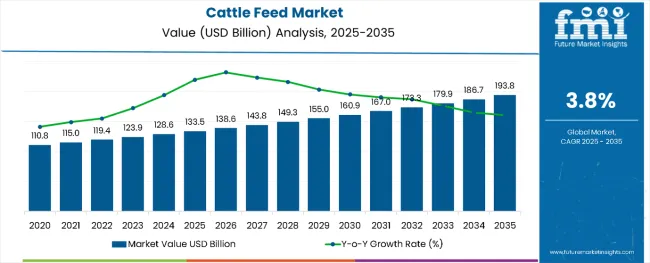
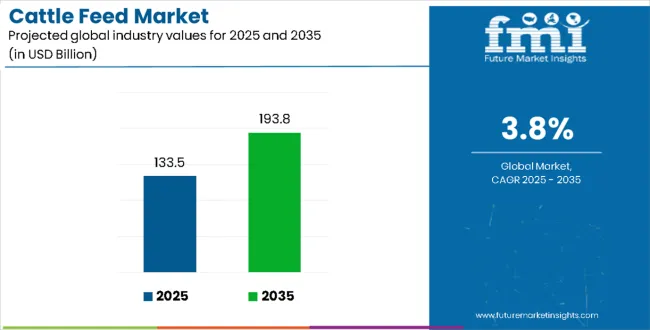
Cattle Feed Market Value Analysis

Quick Stats for Cattle Feed Market

  • Cattle Feed Market Value (2025): USD 133.5 billion
  • Cattle Feed Market Forecast Value (2035): USD 193.8 billion
  • Cattle Feed Market Forecast CAGR: 3.8%
  • Leading Product Type in Cattle Feed Market: Concentrate Foods (44%)
  • Key Growth Regions in Cattle Feed Market: North America, Asia Pacific, and Europe
  • Top Players in Cattle Feed Market: Cargill Inc., Archer Daniels Midland (ADM), ForFarmers Inc., De Heus, Land O'Lakes Inc.

Cattle Feed Market

Cattle Feed Market Key Takeaways

Metric Value
Cattle Feed Market Value (2025) USD 133.5 billion
Cattle Feed Market Forecast Value (2035) USD 193.8 billion
Cattle Feed Market Forecast CAGR 3.8%

Between 2025 and 2030, the cattle feed market is projected to expand from USD 133.5 billion to USD 161.1 billion, resulting in a value increase of USD 27.6 billion, which represents 45.9% of the total forecast growth for the period. This phase of growth will be shaped by rising cattle farming activities in emerging markets, increasing focus on livestock productivity enhancement, and growing demand for quality feed formulations. Feed manufacturers are expanding production capabilities to meet diverse nutritional requirements across different cattle farming systems and geographic regions.

From 2030 to 2035, the market is forecast to grow from USD 161.1 billion to USD 193.8 billion, adding another USD 32.6 billion, which constitutes 54.1% of the overall ten-year expansion. This period is expected to be characterized by technological advancements in feed processing, development of specialized nutritional formulations, and increasing adoption of precision feeding systems. The growing emphasis on sustainable livestock production and feed efficiency optimization will drive demand for innovative feed solutions and specialized manufacturing expertise.

Between 2020 and 2025, the cattle feed market experienced steady expansion, driven by increasing global meat consumption and growing awareness about the importance of quality nutrition in livestock production. The market developed as cattle farmers recognized the value of scientifically formulated feeds in improving animal health, productivity, and feed conversion ratios. Rising disposable incomes in emerging markets and expanding commercial cattle farming operations contributed significantly to market development during this period.
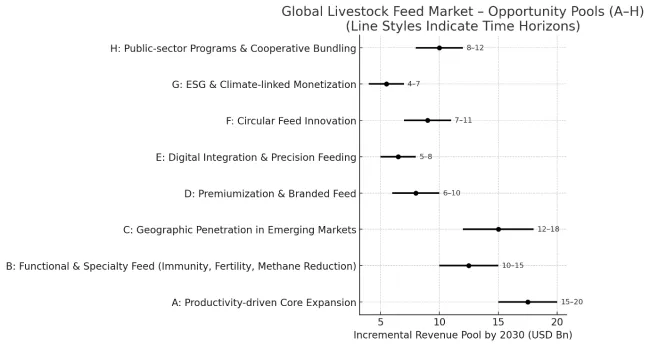
Opportunity Pathways - Cattle Feed Market

Cattle Feed Market Opportunity Pools

The decade ahead is transformative for cattle feed. Farmers, cooperatives, policymakers, and innovators are converging on one goal: productive, sustainable, and climate-smart livestock systems. This creates eight powerful growth pathways, together unlocking USD 67-101 billion in incremental revenue by 2035.

Pathway A - Productivity-Driven Core Expansion.

Fortified feed blends of protein, vitamins, and minerals are scaling rapidly. Smallholder and commercial farms adopt to boost milk yields and weight gain. This remains the largest near-term growth lever. Expected revenue pool: USD 15-20 billion by 2035.

Pathway B - Functional & Specialty Feed.

Probiotics, enzymes, omega-3s, and phytogenic additives enter mainstream adoption. Methane-reducing formulations offer climate benefits while enhancing productivity. Opportunity size: USD 10-15 billion.

Pathway C - Geographic Penetration.

Emerging markets in Asia, Africa, and Latin America move from traditional feed to structured rations. Localized feed mills and low-cost formulations drive expansion. Potential pool: USD 12-18 billion.

Pathway D - Premiumization & Branded Feed.

Branded, certified feed with traceability (organic, non-GMO, antibiotic-free) gains traction among high-income farmers and export-oriented producers. Incremental value: USD 6-10 billion.

Pathway E - Digital Integration & Precision Feeding.

IoT sensors and AI-based ration balancing transform feed into a data-driven service. Mobile dashboards track yield, health, and emissions. Expected revenue pool: USD 5-8 billion.

Pathway F - Circular Feed Innovation.

Upcycling of distillers’ grains, oilseed cakes, and food waste delivers cost-effective, sustainable feed. Adoption is accelerating in both advanced and resource-constrained markets. Market pool: USD 7-11 billion.

Pathway G - ESG & Climate-Linked Monetization.

Low-emission feeds tied to carbon credits and ESG-linked premiums create financial upside. Certification in sustainable dairy and beef strengthens adoption. By 2035, this may add USD 4-7 billion.

Pathway H - Public-Sector Scale-Up.

Governments and cooperatives push structured feed through food security and climate adaptation programs. Subsidy inclusion expands reach to millions of smallholders. Expected upside: USD 8-12 billion.

Why is the Cattle Feed Market Growing?

The cattle feed market is experiencing significant growth, driven by the increasing global demand for beef and dairy products and the rising emphasis on animal health and productivity. As the global cattle population expands, the need for nutritionally balanced feed that enhances milk yield, improves meat quality, and supports overall animal well-being becomes even more critical. The push toward sustainable livestock practices has further encouraged the development of advanced feed formulations designed to optimize performance while minimizing environmental impact.

Key factors contributing to market growth include:

  • Rising global consumption of beef and dairy, increasing the need for efficient cattle feeding solutions.
  • Use of modern feed to enhance feed conversion efficiency and reduce production costs for farmers.
  • Innovation in feed products, including alternative proteins, prebiotics, and performance-enhancing additives.
  • Growth in commercial cattle farming and mechanized livestock operations, especially in emerging economies.
  • Strong demand across both beef and dairy cattle segments, driven by quality and productivity goals.

Segmental Analysis

The market is segmented by product type, form, and region. By product type, the market includes concentrate foods, roughages (such as pasture, hay, silage, straw, hulls, and root crops), feed additives, and extruded feeds. Based on form, the market is categorized into pellets, extruded feeds, mash, cubes, flakes, silage, hay, straw, liquids, grit, and block feeds. Regionally, the market covers key countries including India, Japan, the United Kingdom, the United States, Germany, China, and Brazil.
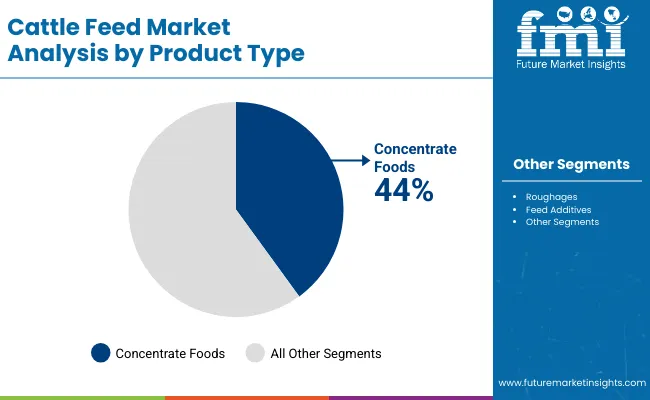
By Product Type, Concentrate Foods Segment Accounts for 44% Market Share

Cattle Feed Market By Product Type

Concentrate foods are projected to account for 44% of the cattle feed market in 2025. This leading share is supported by the widespread use of concentrate feeds in commercial dairy and beef operations where high energy and protein content are essential for optimal animal performance.

Concentrate foods provide essential nutrients in easily digestible forms, making them preferred choices for lactating cows and growing cattle. The segment benefits from established manufacturing processes and proven effectiveness in improving feed conversion ratios and animal productivity.

The dominance of concentrate foods reflects their critical role in modern cattle nutrition programs where balanced energy and protein ratios directly impact milk production and weight gain performance. These formulations typically contain grains, protein meals, and essential vitamins that complement forage-based diets in commercial operations.

Feed manufacturers have developed sophisticated concentrate blends that address specific nutritional requirements for different cattle categories including dairy cows, beef cattle, and growing animals. The segment's growth is further supported by increasing adoption of Total Mixed Ration systems in commercial dairy operations where concentrates are precisely blended with roughages to optimize nutritional delivery.

Advanced concentrate formulations also incorporate feed additives and performance enhancers that improve digestive efficiency and animal health outcomes, making them indispensable components of modern cattle feeding programs across both intensive and extensive production systems.
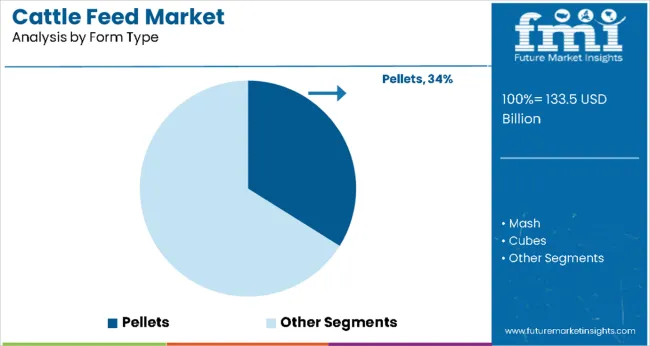
By Form Type, Pellets Segment Accounts for 34% Market Share

Cattle Feed Market By Form Type

Pellets are expected to represent 34% of cattle feed form type demand in 2025. This dominant share reflects the practical advantages of pelleted feeds including reduced feed waste, improved handling characteristics, and better nutrient density compared to other forms.

Pelleted feeds offer convenient storage and transportation benefits while maintaining nutritional integrity and reducing selective feeding behaviors in cattle. The segment benefits from widespread acceptance among commercial cattle operations and established pelleting infrastructure across major feed manufacturing regions.

The pelleting process enhances feed palatability and digestibility while eliminating dust formation that can affect animal respiratory health and feed handling efficiency. Modern pelleting technologies enable manufacturers to produce uniform feed particles that ensure consistent nutrient distribution and reduce sorting behavior in cattle feeding systems.

The physical structure of pelleted feeds allows for better integration of liquid nutrients, fats, and heat-sensitive ingredients that would otherwise be difficult to incorporate in mash or loose feed forms. Pelleted feeds demonstrate superior storage characteristics with reduced susceptibility to spoilage and contamination compared to other feed forms, making them particularly valuable in humid climates and extended storage applications.

The segment's continued growth is supported by increasing mechanization in cattle feeding operations where pelleted feeds can be efficiently handled through automated feeding systems, reducing labor requirements while maintaining consistent feed delivery. Additionally, pelleted feeds enable precise portion control and simplified inventory management in large-scale cattle operations where feed efficiency and cost control are critical success factors.

What are the Drivers, Restraints, and Key Trends of the Cattle Feed Market?

The Cattle Feed market is advancing steadily due to increasing cattle populations and growing demand for animal protein products. However, the market faces challenges including fluctuating raw material prices, regulatory requirements for feed safety, and competition from alternative protein sources. Technological innovations in feed formulation and processing continue to influence product quality and market development patterns.

Development of Specialized Nutritional Formulations

The growing focus on precision nutrition is enabling feed manufacturers to develop specialized formulations tailored to specific cattle breeds, production stages, and farming systems. Advanced feed formulations incorporate targeted nutrients, probiotics, and performance enhancers that optimize animal health while improving production efficiency. These specialized products are particularly valuable for high-producing dairy operations and intensive beef production systems where marginal improvements in feed efficiency can significantly impact profitability.

Integration of Sustainable Feed Ingredients and Processing Technologies

Modern cattle feed manufacturers are incorporating alternative protein sources and sustainable ingredients that reduce environmental impact while maintaining nutritional quality. Development of advanced processing technologies including extrusion, pelleting, and liquid coating systems enables better nutrient utilization and feed palatability. Advanced processing also supports incorporation of heat-sensitive nutrients and bioactive compounds that enhance animal health and production performance.
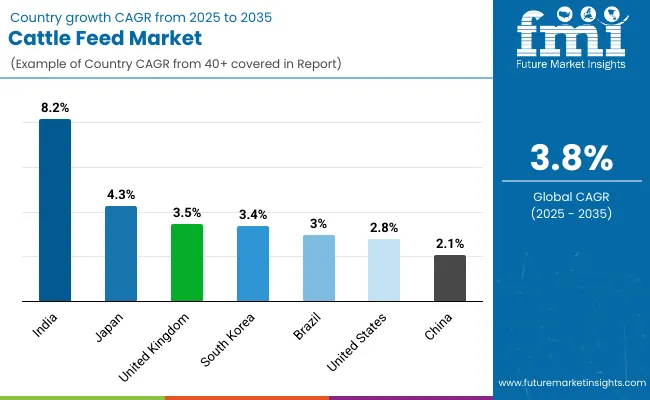
Analysis of Cattle Feed Market by Key Country

Cattle Feed Market Country Wise Analysis

Country CAGR (%)
India 8.2
Japan 4.3
United Kingdom 3.5
South Korea 3.4
Brazil 3.0
United States 2.8
China 2.1

The global cattle feed market shows diverse growth trends across major regions. India leads with the highest projected growth at 8.2% CAGR, driven by its large cattle population, expanding dairy sector, and government livestock development programs promoting scientifically formulated feeds. Japan follows with 4.3% CAGR, supported by advanced livestock technology, premium beef production, and precision feeding systems.

The United Kingdom and Germany both exhibit moderate growth at 3.5% CAGR and 3.4%, fueled by strong dairy industries, sustainability initiatives, and demand for high-quality feed formulations. Brazil maintains steady expansion at 3.0% CAGR, leveraging extensive pasture-based cattle systems and export-oriented beef production.

The United States grows at 2.8% CAGR, supported by large-scale commercial operations and advanced feed manufacturing capabilities. China shows emerging potential with 2.1% CAGR, reflecting modernization of cattle farming and rising domestic protein consumption.

The report covers an in-depth analysis of 40+ countries; seven top-performing countries are highlighted below.

India Leads Global Market Growth with Livestock Industry Expansion

Revenue from cattle feed in India is projected to exhibit strong growth at 8.2% CAGR through 2035, driven by the country's large cattle population and expanding dairy industry. India's traditional reliance on cattle for milk production and growing commercial farming operations are creating significant demand for quality feed formulations. The government's focus on livestock productivity improvement and dairy sector modernization programs are supporting increased adoption of scientifically formulated cattle feeds across rural and commercial farming operations.

India's expanding organized dairy sector and growing awareness about the importance of balanced nutrition in cattle farming are enabling market development across diverse geographic regions. The country's focus on self-sufficiency in animal protein production and export potential in dairy products support comprehensive cattle feed market growth.

  • Government livestock development programs promote scientific feeding practices, driving institutional demand for quality cattle feeds across cooperative and commercial dairy operations.
  • Traditional cattle farming practices are gradually incorporating modern feed formulations to improve milk yields and animal health in both rural and commercial settings.

Japan Demonstrates Advanced Market with Technology Focus

Revenue from cattle feed in Japan is expanding at 4.3% CAGR, supported by the country's advanced livestock technology and premium beef production systems. Japan's emphasis on high-quality beef production, particularly for premium Wagyu cattle, creates demand for specialized feed formulations that enhance meat quality and marbling characteristics. The country's aging rural population and focus on production efficiency are driving adoption of advanced feed technologies and convenient feed forms.

Japan's technological leadership in feed processing and quality control systems enables production of specialized cattle feeds that meet stringent quality requirements. The country's focus on food safety and traceability extends to cattle feed production, creating demand for premium feed ingredients and advanced manufacturing processes.

  • Advanced cattle breeding programs require specialized nutritional formulations that support genetic potential and premium meat quality characteristics.
  • Technology integration in livestock operations drives demand for precision feeding systems and automated feed delivery solutions.

United Kingdom Maintains Strong Position with Dairy Focus

Revenue from cattle feed in the United Kingdom is projected to grow at 3.5% CAGR, supported by the country's significant dairy industry and established beef production systems. UK farmers demonstrate strong preference for high-quality feed formulations that optimize milk production and animal health while meeting stringent environmental and welfare standards. The country's focus on sustainable agriculture and carbon footprint reduction is driving adoption of environmentally friendly feed ingredients and efficient production systems.

The United Kingdom's emphasis on livestock welfare and sustainable farming practices aligns with market trends toward feeds that support animal health while reducing environmental impact. The country's position as a major dairy producer supports consistent demand for specialized dairy cattle feed formulations.

  • Dairy industry modernization drives demand for high-energy concentrate feeds that optimize milk production and improve feed conversion efficiency.
  • Sustainable farming initiatives promote adoption of feeds incorporating alternative protein sources and environmentally responsible ingredients.

United States Shows Consistent Growth with Commercial Operations

Revenue from cattle feed in the United States is expanding at 2.8% CAGR, driven by large-scale commercial cattle operations and advanced feed manufacturing infrastructure. The US cattle industry's focus on efficiency and productivity creates consistent demand for scientifically formulated feeds that optimize animal performance across diverse production systems. The country's position as a major beef producer and established feedlot industry support significant cattle feed consumption volumes.

The United States' technological leadership in feed manufacturing and quality control enables production of specialized formulations that meet diverse cattle nutrition requirements. The country's emphasis on production efficiency and cost optimization drives adoption of feeds that improve feed conversion ratios and reduce production costs.

  • Large-scale feedlot operations require consistent supply of high-quality feeds that optimize weight gain and feed efficiency in intensive production systems.
  • Advanced feed manufacturing capabilities enable development of specialized formulations for different cattle breeds and production stages.

South Korea Emphasizes Quality and Innovation

Demand for cattle feed in South Korea is projected to grow at 3.4% CAGR, driven by the country's focus on high-quality livestock production and advanced farming practices. South Korean cattle farmers show a strong preference for feeds that meet stringent nutritional standards while promoting animal welfare and efficient production. The country’s premium beef and dairy industries are key drivers of demand for high-quality feed formulations.

South Korea's leadership in feed technology influences trends toward more effective and innovative feed solutions. The growing interest in organic and non-GMO farming systems supports a rise in demand for certified organic cattle feeds.

  • Quality-focused livestock production systems require feeds that meet strict nutritional and safety standards, contributing to the premium positioning of South Korean beef and dairy products.
  • Advanced agricultural practices drive the adoption of feeds that incorporate locally sourced ingredients and efficient production methods, optimizing livestock health and productivity.

China Shows Emerging Market Potential with Production Scale

Revenue from cattle feed in China is expanding at 2.1% CAGR, driven by the country's large-scale livestock operations and growing domestic beef consumption. China's modernization of cattle farming practices and increasing adoption of commercial feed formulations are creating opportunities for quality feed manufacturers. The country's focus on food security and livestock productivity improvement supports development of advanced feed manufacturing capabilities across major agricultural regions.

China's expanding middle class and rising protein consumption create consistent demand for cattle products, driving increased feed requirements across both dairy and beef production systems. The government's agricultural modernization policies and support for large-scale farming operations enable adoption of scientifically formulated feeds that optimize production efficiency.

  • Large-scale cattle operations require consistent supply of cost-effective feeds that support rapid weight gain and improved production efficiency.
  • Government agricultural policies promote modern feeding practices and quality feed adoption in commercial livestock operations.

Brazil Maintains Strong Position with Livestock Industry Leadership

Demand for cattle feed in Brazil is projected to grow at 3.0% CAGR, supported by the country's position as a global leader in beef production and expanding cattle herd sizes. Brazil's extensive pasture-based cattle systems and growing integration of supplemental feeding practices create significant demand for specialized feed formulations. The country's export-oriented beef industry and focus on production efficiency drive adoption of feeds that optimize animal performance while maintaining cost competitiveness.

Brazil's favorable climate conditions and abundant feed ingredient availability support development of locally adapted feed formulations that meet specific nutritional requirements for tropical cattle production. The country's emphasis on sustainable cattle production and environmental stewardship influences feed formulation trends toward environmentally responsible ingredients and production methods.
  • Extensive cattle ranching operations integrate supplemental feeding programs to optimize pasture utilization and improve animal performance during seasonal variations.
  • Export market requirements drive adoption of feeds that support traceability and quality assurance programs in commercial beef production systems.

Europe Market Split by Country

Europe Cattle Feed Market

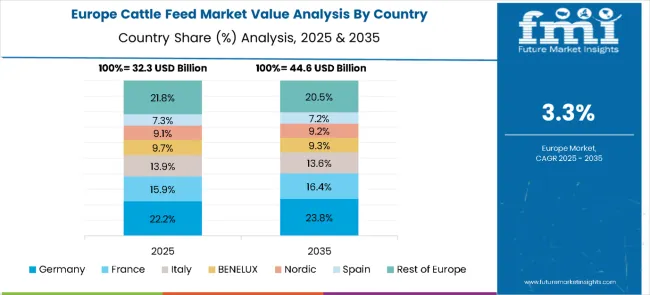
The cattle feed market in Europe is projected to grow from USD 32.3 billion in 2025 to USD 44.6 billion by 2035, registering a CAGR of 3.3% over the forecast period. Germany is expected to maintain its leadership with a 22.2% share in 2025, followed by France at 15.9%, reflecting strong livestock farming and feed production capacity.

Italy accounts for 13.9% of the market, while the BENELUX region represents 9.7% and the Nordic countries hold 9.1%. Spain captures 7.3%, while the Rest of Europe collectively contributes 21.8%. By 2035, Germany will further strengthen its position with a 23.8% share, France will reach 16.4%, and Italy will stand at 13.6%.

BENELUX and the Nordic region are projected at 9.3% and 9.2%, respectively, while Spain will account for 7.2%, and the Rest of Europe will represent 20.5%, indicating steady regional growth across the continent.
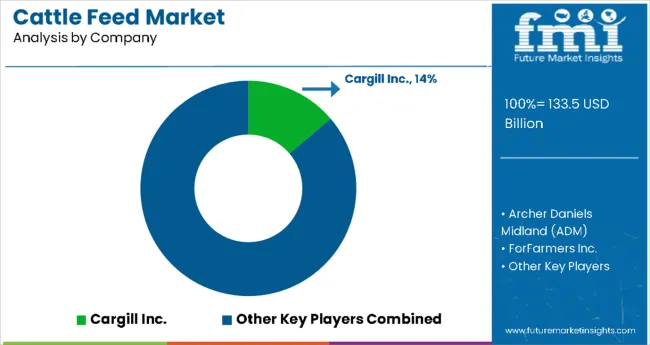
Competitive Landscape of Cattle Feed Market

Cattle Feed Market By Company

The cattle feed market is characterized by competition among global agricultural conglomerates, regional feed manufacturers, and specialized nutrition companies. Leading players are investing in advanced feed formulation technologies, production capacity expansion, and strategic acquisitions to strengthen their market positions across key geographic regions.

Cargill Inc. leads the market with a 14% share, leveraging its integrated supply chain and global manufacturing network to deliver consistent feed solutions. Archer Daniels Midland (ADM) holds 11.7% market share, focusing on innovation in feed ingredients and sustainable production practices. ForFarmers Inc. commands 8.4% of the market through specialized regional expertise and customer-focused service delivery. De Heus maintains 7.3% market share with emphasis on nutritional innovation and technical support services, while Land O'Lakes Inc. accounts for 5.5% through its cooperative model and farmer-focused approach to feed manufacturing and distribution.

Global Cattle Feed Market - Stakeholder Contribution Framework

The cattle feed market is central to food security, dairy productivity, meat quality, and rural livelihoods. With climate volatility, sustainability mandates, and rising protein demand, the sector faces pressure to balance feed efficiency, animal welfare, and environmental impact. Coordinated action from governments, industry bodies, OEMs/agri-tech players, suppliers, and investors is essential to transition toward climate-smart, digitally optimized, and nutritionally advanced cattle feed systems.

How Governments Could Spur Local Production and Adoption?

  • Subsidies & Incentives: Provide input subsidies for balanced feed adoption, especially for smallholder farmers, and incentivize feed mills using sustainable raw materials.
  • R&D Support: Fund programs on methane-reducing feed additives, fortified feed blends, and region-specific nutritional optimization.
  • Regulatory Standards: Set quality and safety standards to limit counterfeit or low-nutrition feed entering the market.
  • Trade Policies: Facilitate export opportunities for feed additives and processed feed, especially from surplus grain-producing regions.
  • Sustainability Mandates: Integrate cattle feed into national climate strategies by promoting carbon-credit linked feed solutions.

How Industry Bodies Could Support Market Development?

  • Standardization: Develop harmonized guidelines on protein content, antibiotic-free formulations, and labeling.
  • Export Branding: Position regional feed as climate-smart and high-quality, enhancing global competitiveness.
  • Training Networks: Deliver curricula on advanced feed management, mycotoxin prevention, and nutritional literacy for farmers and distributors.
  • Policy Advocacy: Represent stakeholders in dialogues on animal welfare, land-use regulations, and sustainable sourcing.

How OEMs and Agri-Tech Players Could Strengthen the Ecosystem?

  • Digital Integration: Bundle cattle feed with IoT-enabled feeding systems, herd monitoring sensors, and precision nutrition platforms.
  • Partnerships: Work with feed manufacturers to integrate data-driven formulations tailored to cattle breed, lifecycle stage, and climate conditions.
  • Innovation in Additives: Invest in probiotic, enzyme, and algae-based supplements to enhance feed conversion ratios while reducing emissions.
  • Processing Tech: Provide modular feed mill equipment for cooperatives to improve local feed availability and reduce logistics costs.

How Suppliers Could Navigate the Shift?

  • Sustainable Sourcing: Adopt circular models using agro-industrial by-products (sugarcane bagasse, distiller’s grains, oilseed cakes).
  • Portfolio Diversification: Expand from bulk feed into specialty segments (dairy-optimized feed, beef marbling enhancers, calf starter diets).
  • Quality Assurance: Strengthen traceability systems to build trust in domestic and export markets.
  • Farmer Engagement: Deploy extension teams to demonstrate ROI in productivity and profitability from improved feed.

How Investors and Financial Enablers Could Unlock Value?

  • Infrastructure Financing: Support feed mill expansion, logistics hubs, and silage storage in emerging markets.
  • Climate Finance: Fund startups and feed companies innovating in methane-reduction or carbon-credit-linked feed formulations.
  • Private Equity & M&A: Consolidate fragmented regional feed mills into scalable players with cross-border reach.
  • Insurance Models: Create risk-mitigation products for feed producers vulnerable to raw material price volatility.

Key Players in the Cattle Feed Market

  • Cargill Inc.
  • Archer Daniels Midland (ADM)
  • ForFarmers Inc.
  • De Heus
  • Land O'Lakes Inc.

Scope of the Report

Items Values
Quantitative Units (2025) USD 133.5 Billion
Product Type Concentrate Foods, Roughages (Pasture, Hay, Silage, Straw & Hulls, Root Crops), Feed Additive
Form Pellets, Extruded Feeds, Mash, Cubes, Flakes, Silage, Hay, Straw, Liquids, Grit, Block Feeds
Regions Covered India, Japan, United Kingdom, United States, Germany, China, Brazil
Country Covered India, Japan, United Kingdom, United States, Germany, China, Brazil, and 40+ countries
Key Companies Profiled BASF SE, DSM, Cargill, Inc, ADM, Animal Nutrition, Kemin Industries, Inc, Biomin Holding GmbH, Nutreco, Land O'Lakes, Inc, Farmer's Grain Company, Godrej Agrovet Ltd.
Additional Attributes Dollar sales by product/form type, regional demand (key markets), competition among feed leaders, farmer preference (nutritional vs conventional), livestock tech integration, feed innovations, and sustainable precision nutrition adoption

Cattle Feed Market - Key Segments

By Product Type:

  • Concentrate Foods
  • Roughages
  • Feed Additives
  • Extruded Feeds

By Form:

  • Pellets
  • Mash
  • Cubes
  • Flakes
  • Liquids
  • Block Feeds

By Region:

  • India
  • Japan
  • United Kingdom
  • United States
  • Germany
  • China
  • Brazil

Frequently Asked Questions

What is the expected worth of the cattle feed market in 2025?

As of 2025, the market for cattle feed is expected to be valued at USD 133.5 billion.

What is the anticipated market value for the cattle feed in 2035?

By 2035, the market value of cattle feed is expected to reach USD 193.7 billion.

What is the projected forecast CAGR for the cattle feed market from 2025 to 2035?

From 2025 to 2035, the cattle feed market is expected to flourish at a CAGR of 3.8%.

Based on the product type, which segment dominates the vaginal applicator market?

The concentrate foods segment is expected to account for a market share of 3.8% in 2025.

Which country is likely to be at the pinnacle of the market?

India is likely the top-performing market, with a CAGR of 8.2%.

Table of Content

  1. Executive Summary
  2. Market Overview
  3. Market Background
  4. Global Market Analysis 2020 to 2024 and Forecast 2025 to 2035
  5. Global Market Analysis 2020 to 2024 and Forecast 2025 to 2035, By Product Type
    • Concentrate Foods
    • Roughages (Pasture, Hay, Silage, Straw & Hulls, Root Crops)
    • Feed Additive
  6. Global Market Analysis 2020 to 2024 and Forecast 2025 to 2035, By Form
    • Pellets
    • Extruded Feeds
    • Mash
    • Cubes
    • Flakes
    • Silage
    • Hay
    • Straw
    • Liquids
    • Grit
    • Block Feeds
  7. Global Market Analysis 2020 to 2024 and Forecast 2025 to 2035, By Region
    • North America
    • Latin America
    • Western Europe
    • Eastern Europe
    • South Asia and Pacific
    • East Asia
    • Middle East and Africa
  8. North America Market Analysis 2020 to 2024 and Forecast 2025 to 2035, By Country
  9. Latin America Market Analysis 2020 to 2024 and Forecast 2025 to 2035, By Country
  10. Western Europe Market Analysis 2020 to 2024 and Forecast 2025 to 2035, By Country
  11. Eastern Europe Market Analysis 2020 to 2024 and Forecast 2025 to 2035, By Country
  12. South Asia and Pacific Market Analysis 2020 to 2024 and Forecast 2025 to 2035, By Country
  13. East Asia Market Analysis 2020 to 2024 and Forecast 2025 to 2035, By Country
  14. Middle East and Africa Market Analysis 2020 to 2024 and Forecast 2025 to 2035, By Country
  15. Key Countries Market Analysis
  16. Market Structure Analysis
  17. Competition Analysis
    • BASF SE
    • DSM
    • Cargill, Inc
    • ADM
    • Animal Nutrition
    • Kemin Industries, Inc
    • Biomin Holding GmbH
    • Nutreco
    • Land O'Lakes, Inc
    • Farmer's Grain Company
    • Godrej Agrovet Ltd.
  18. Assumptions & Acronyms Used
  19. Research Methodology

List of Tables

  • Table 1: Global Market Value (USD Million) Forecast by Region, 2020 to 2035
  • Table 2: Global Market Volume (Tons) Forecast by Region, 2020 to 2035
  • Table 3: Global Market Value (USD Million) Forecast by Product Type, 2020 to 2035
  • Table 4: Global Market Volume (Tons) Forecast by Product Type, 2020 to 2035
  • Table 5: Global Market Value (USD Million) Forecast by Form, 2020 to 2035
  • Table 6: Global Market Volume (Tons) Forecast by Form, 2020 to 2035
  • Table 7: North America Market Value (USD Million) Forecast by Country, 2020 to 2035
  • Table 8: North America Market Volume (Tons) Forecast by Country, 2020 to 2035
  • Table 9: North America Market Value (USD Million) Forecast by Product Type, 2020 to 2035
  • Table 10: North America Market Volume (Tons) Forecast by Product Type, 2020 to 2035
  • Table 11: North America Market Value (USD Million) Forecast by Form, 2020 to 2035
  • Table 12: North America Market Volume (Tons) Forecast by Form, 2020 to 2035
  • Table 13: Latin America Market Value (USD Million) Forecast by Country, 2020 to 2035
  • Table 14: Latin America Market Volume (Tons) Forecast by Country, 2020 to 2035
  • Table 15: Latin America Market Value (USD Million) Forecast by Product Type, 2020 to 2035
  • Table 16: Latin America Market Volume (Tons) Forecast by Product Type, 2020 to 2035
  • Table 17: Latin America Market Value (USD Million) Forecast by Form, 2020 to 2035
  • Table 18: Latin America Market Volume (Tons) Forecast by Form, 2020 to 2035
  • Table 19: Western Europe Market Value (USD Million) Forecast by Country, 2020 to 2035
  • Table 20: Western Europe Market Volume (Tons) Forecast by Country, 2020 to 2035
  • Table 21: Western Europe Market Value (USD Million) Forecast by Product Type, 2020 to 2035
  • Table 22: Western Europe Market Volume (Tons) Forecast by Product Type, 2020 to 2035
  • Table 23: Western Europe Market Value (USD Million) Forecast by Form, 2020 to 2035
  • Table 24: Western Europe Market Volume (Tons) Forecast by Form, 2020 to 2035
  • Table 25: Eastern Europe Market Value (USD Million) Forecast by Country, 2020 to 2035
  • Table 26: Eastern Europe Market Volume (Tons) Forecast by Country, 2020 to 2035
  • Table 27: Eastern Europe Market Value (USD Million) Forecast by Product Type, 2020 to 2035
  • Table 28: Eastern Europe Market Volume (Tons) Forecast by Product Type, 2020 to 2035
  • Table 29: Eastern Europe Market Value (USD Million) Forecast by Form, 2020 to 2035
  • Table 30: Eastern Europe Market Volume (Tons) Forecast by Form, 2020 to 2035
  • Table 31: South Asia and Pacific Market Value (USD Million) Forecast by Country, 2020 to 2035
  • Table 32: South Asia and Pacific Market Volume (Tons) Forecast by Country, 2020 to 2035
  • Table 33: South Asia and Pacific Market Value (USD Million) Forecast by Product Type, 2020 to 2035
  • Table 34: South Asia and Pacific Market Volume (Tons) Forecast by Product Type, 2020 to 2035
  • Table 35: South Asia and Pacific Market Value (USD Million) Forecast by Form, 2020 to 2035
  • Table 36: South Asia and Pacific Market Volume (Tons) Forecast by Form, 2020 to 2035
  • Table 37: East Asia Market Value (USD Million) Forecast by Country, 2020 to 2035
  • Table 38: East Asia Market Volume (Tons) Forecast by Country, 2020 to 2035
  • Table 39: East Asia Market Value (USD Million) Forecast by Product Type, 2020 to 2035
  • Table 40: East Asia Market Volume (Tons) Forecast by Product Type, 2020 to 2035
  • Table 41: East Asia Market Value (USD Million) Forecast by Form, 2020 to 2035
  • Table 42: East Asia Market Volume (Tons) Forecast by Form, 2020 to 2035
  • Table 43: Middle East and Africa Market Value (USD Million) Forecast by Country, 2020 to 2035
  • Table 44: Middle East and Africa Market Volume (Tons) Forecast by Country, 2020 to 2035
  • Table 45: Middle East and Africa Market Value (USD Million) Forecast by Product Type, 2020 to 2035
  • Table 46: Middle East and Africa Market Volume (Tons) Forecast by Product Type, 2020 to 2035
  • Table 47: Middle East and Africa Market Value (USD Million) Forecast by Form, 2020 to 2035
  • Table 48: Middle East and Africa Market Volume (Tons) Forecast by Form, 2020 to 2035

List of Figures

  • Figure 1: Global Market Value (USD Million) by Product Type, 2025 to 2035
  • Figure 2: Global Market Value (USD Million) by Form, 2025 to 2035
  • Figure 3: Global Market Value (USD Million) by Region, 2025 to 2035
  • Figure 4: Global Market Value (USD Million) Analysis by Region, 2020 to 2035
  • Figure 5: Global Market Volume (Tons) Analysis by Region, 2020 to 2035
  • Figure 6: Global Market Value Share (%) and BPS Analysis by Region, 2025 to 2035
  • Figure 7: Global Market Y-o-Y Growth (%) Projections by Region, 2025 to 2035
  • Figure 8: Global Market Value (USD Million) Analysis by Product Type, 2020 to 2035
  • Figure 9: Global Market Volume (Tons) Analysis by Product Type, 2020 to 2035
  • Figure 10: Global Market Value Share (%) and BPS Analysis by Product Type, 2025 to 2035
  • Figure 11: Global Market Y-o-Y Growth (%) Projections by Product Type, 2025 to 2035
  • Figure 12: Global Market Value (USD Million) Analysis by Form, 2020 to 2035
  • Figure 13: Global Market Volume (Tons) Analysis by Form, 2020 to 2035
  • Figure 14: Global Market Value Share (%) and BPS Analysis by Form, 2025 to 2035
  • Figure 15: Global Market Y-o-Y Growth (%) Projections by Form, 2025 to 2035
  • Figure 16: Global Market Attractiveness by Product Type, 2025 to 2035
  • Figure 17: Global Market Attractiveness by Form, 2025 to 2035
  • Figure 18: Global Market Attractiveness by Region, 2025 to 2035
  • Figure 19: North America Market Value (USD Million) by Product Type, 2025 to 2035
  • Figure 20: North America Market Value (USD Million) by Form, 2025 to 2035
  • Figure 21: North America Market Value (USD Million) by Country, 2025 to 2035
  • Figure 22: North America Market Value (USD Million) Analysis by Country, 2020 to 2035
  • Figure 23: North America Market Volume (Tons) Analysis by Country, 2020 to 2035
  • Figure 24: North America Market Value Share (%) and BPS Analysis by Country, 2025 to 2035
  • Figure 25: North America Market Y-o-Y Growth (%) Projections by Country, 2025 to 2035
  • Figure 26: North America Market Value (USD Million) Analysis by Product Type, 2020 to 2035
  • Figure 27: North America Market Volume (Tons) Analysis by Product Type, 2020 to 2035
  • Figure 28: North America Market Value Share (%) and BPS Analysis by Product Type, 2025 to 2035
  • Figure 29: North America Market Y-o-Y Growth (%) Projections by Product Type, 2025 to 2035
  • Figure 30: North America Market Value (USD Million) Analysis by Form, 2020 to 2035
  • Figure 31: North America Market Volume (Tons) Analysis by Form, 2020 to 2035
  • Figure 32: North America Market Value Share (%) and BPS Analysis by Form, 2025 to 2035
  • Figure 33: North America Market Y-o-Y Growth (%) Projections by Form, 2025 to 2035
  • Figure 34: North America Market Attractiveness by Product Type, 2025 to 2035
  • Figure 35: North America Market Attractiveness by Form, 2025 to 2035
  • Figure 36: North America Market Attractiveness by Country, 2025 to 2035
  • Figure 37: Latin America Market Value (USD Million) by Product Type, 2025 to 2035
  • Figure 38: Latin America Market Value (USD Million) by Form, 2025 to 2035
  • Figure 39: Latin America Market Value (USD Million) by Country, 2025 to 2035
  • Figure 40: Latin America Market Value (USD Million) Analysis by Country, 2020 to 2035
  • Figure 41: Latin America Market Volume (Tons) Analysis by Country, 2020 to 2035
  • Figure 42: Latin America Market Value Share (%) and BPS Analysis by Country, 2025 to 2035
  • Figure 43: Latin America Market Y-o-Y Growth (%) Projections by Country, 2025 to 2035
  • Figure 44: Latin America Market Value (USD Million) Analysis by Product Type, 2020 to 2035
  • Figure 45: Latin America Market Volume (Tons) Analysis by Product Type, 2020 to 2035
  • Figure 46: Latin America Market Value Share (%) and BPS Analysis by Product Type, 2025 to 2035
  • Figure 47: Latin America Market Y-o-Y Growth (%) Projections by Product Type, 2025 to 2035
  • Figure 48: Latin America Market Value (USD Million) Analysis by Form, 2020 to 2035
  • Figure 49: Latin America Market Volume (Tons) Analysis by Form, 2020 to 2035
  • Figure 50: Latin America Market Value Share (%) and BPS Analysis by Form, 2025 to 2035
  • Figure 51: Latin America Market Y-o-Y Growth (%) Projections by Form, 2025 to 2035
  • Figure 52: Latin America Market Attractiveness by Product Type, 2025 to 2035
  • Figure 53: Latin America Market Attractiveness by Form, 2025 to 2035
  • Figure 54: Latin America Market Attractiveness by Country, 2025 to 2035
  • Figure 55: Western Europe Market Value (USD Million) by Product Type, 2025 to 2035
  • Figure 56: Western Europe Market Value (USD Million) by Form, 2025 to 2035
  • Figure 57: Western Europe Market Value (USD Million) by Country, 2025 to 2035
  • Figure 58: Western Europe Market Value (USD Million) Analysis by Country, 2020 to 2035
  • Figure 59: Western Europe Market Volume (Tons) Analysis by Country, 2020 to 2035
  • Figure 60: Western Europe Market Value Share (%) and BPS Analysis by Country, 2025 to 2035
  • Figure 61: Western Europe Market Y-o-Y Growth (%) Projections by Country, 2025 to 2035
  • Figure 62: Western Europe Market Value (USD Million) Analysis by Product Type, 2020 to 2035
  • Figure 63: Western Europe Market Volume (Tons) Analysis by Product Type, 2020 to 2035
  • Figure 64: Western Europe Market Value Share (%) and BPS Analysis by Product Type, 2025 to 2035
  • Figure 65: Western Europe Market Y-o-Y Growth (%) Projections by Product Type, 2025 to 2035
  • Figure 66: Western Europe Market Value (USD Million) Analysis by Form, 2020 to 2035
  • Figure 67: Western Europe Market Volume (Tons) Analysis by Form, 2020 to 2035
  • Figure 68: Western Europe Market Value Share (%) and BPS Analysis by Form, 2025 to 2035
  • Figure 69: Western Europe Market Y-o-Y Growth (%) Projections by Form, 2025 to 2035
  • Figure 70: Western Europe Market Attractiveness by Product Type, 2025 to 2035
  • Figure 71: Western Europe Market Attractiveness by Form, 2025 to 2035
  • Figure 72: Western Europe Market Attractiveness by Country, 2025 to 2035
  • Figure 73: Eastern Europe Market Value (USD Million) by Product Type, 2025 to 2035
  • Figure 74: Eastern Europe Market Value (USD Million) by Form, 2025 to 2035
  • Figure 75: Eastern Europe Market Value (USD Million) by Country, 2025 to 2035
  • Figure 76: Eastern Europe Market Value (USD Million) Analysis by Country, 2020 to 2035
  • Figure 77: Eastern Europe Market Volume (Tons) Analysis by Country, 2020 to 2035
  • Figure 78: Eastern Europe Market Value Share (%) and BPS Analysis by Country, 2025 to 2035
  • Figure 79: Eastern Europe Market Y-o-Y Growth (%) Projections by Country, 2025 to 2035
  • Figure 80: Eastern Europe Market Value (USD Million) Analysis by Product Type, 2020 to 2035
  • Figure 81: Eastern Europe Market Volume (Tons) Analysis by Product Type, 2020 to 2035
  • Figure 82: Eastern Europe Market Value Share (%) and BPS Analysis by Product Type, 2025 to 2035
  • Figure 83: Eastern Europe Market Y-o-Y Growth (%) Projections by Product Type, 2025 to 2035
  • Figure 84: Eastern Europe Market Value (USD Million) Analysis by Form, 2020 to 2035
  • Figure 85: Eastern Europe Market Volume (Tons) Analysis by Form, 2020 to 2035
  • Figure 86: Eastern Europe Market Value Share (%) and BPS Analysis by Form, 2025 to 2035
  • Figure 87: Eastern Europe Market Y-o-Y Growth (%) Projections by Form, 2025 to 2035
  • Figure 88: Eastern Europe Market Attractiveness by Product Type, 2025 to 2035
  • Figure 89: Eastern Europe Market Attractiveness by Form, 2025 to 2035
  • Figure 90: Eastern Europe Market Attractiveness by Country, 2025 to 2035
  • Figure 91: South Asia and Pacific Market Value (USD Million) by Product Type, 2025 to 2035
  • Figure 92: South Asia and Pacific Market Value (USD Million) by Form, 2025 to 2035
  • Figure 93: South Asia and Pacific Market Value (USD Million) by Country, 2025 to 2035
  • Figure 94: South Asia and Pacific Market Value (USD Million) Analysis by Country, 2020 to 2035
  • Figure 95: South Asia and Pacific Market Volume (Tons) Analysis by Country, 2020 to 2035
  • Figure 96: South Asia and Pacific Market Value Share (%) and BPS Analysis by Country, 2025 to 2035
  • Figure 97: South Asia and Pacific Market Y-o-Y Growth (%) Projections by Country, 2025 to 2035
  • Figure 98: South Asia and Pacific Market Value (USD Million) Analysis by Product Type, 2020 to 2035
  • Figure 99: South Asia and Pacific Market Volume (Tons) Analysis by Product Type, 2020 to 2035
  • Figure 100: South Asia and Pacific Market Value Share (%) and BPS Analysis by Product Type, 2025 to 2035
  • Figure 101: South Asia and Pacific Market Y-o-Y Growth (%) Projections by Product Type, 2025 to 2035
  • Figure 102: South Asia and Pacific Market Value (USD Million) Analysis by Form, 2020 to 2035
  • Figure 103: South Asia and Pacific Market Volume (Tons) Analysis by Form, 2020 to 2035
  • Figure 104: South Asia and Pacific Market Value Share (%) and BPS Analysis by Form, 2025 to 2035
  • Figure 105: South Asia and Pacific Market Y-o-Y Growth (%) Projections by Form, 2025 to 2035
  • Figure 106: South Asia and Pacific Market Attractiveness by Product Type, 2025 to 2035
  • Figure 107: South Asia and Pacific Market Attractiveness by Form, 2025 to 2035
  • Figure 108: South Asia and Pacific Market Attractiveness by Country, 2025 to 2035
  • Figure 109: East Asia Market Value (USD Million) by Product Type, 2025 to 2035
  • Figure 110: East Asia Market Value (USD Million) by Form, 2025 to 2035
  • Figure 111: East Asia Market Value (USD Million) by Country, 2025 to 2035
  • Figure 112: East Asia Market Value (USD Million) Analysis by Country, 2020 to 2035
  • Figure 113: East Asia Market Volume (Tons) Analysis by Country, 2020 to 2035
  • Figure 114: East Asia Market Value Share (%) and BPS Analysis by Country, 2025 to 2035
  • Figure 115: East Asia Market Y-o-Y Growth (%) Projections by Country, 2025 to 2035
  • Figure 116: East Asia Market Value (USD Million) Analysis by Product Type, 2020 to 2035
  • Figure 117: East Asia Market Volume (Tons) Analysis by Product Type, 2020 to 2035
  • Figure 118: East Asia Market Value Share (%) and BPS Analysis by Product Type, 2025 to 2035
  • Figure 119: East Asia Market Y-o-Y Growth (%) Projections by Product Type, 2025 to 2035
  • Figure 120: East Asia Market Value (USD Million) Analysis by Form, 2020 to 2035
  • Figure 121: East Asia Market Volume (Tons) Analysis by Form, 2020 to 2035
  • Figure 122: East Asia Market Value Share (%) and BPS Analysis by Form, 2025 to 2035
  • Figure 123: East Asia Market Y-o-Y Growth (%) Projections by Form, 2025 to 2035
  • Figure 124: East Asia Market Attractiveness by Product Type, 2025 to 2035
  • Figure 125: East Asia Market Attractiveness by Form, 2025 to 2035
  • Figure 126: East Asia Market Attractiveness by Country, 2025 to 2035
  • Figure 127: Middle East and Africa Market Value (USD Million) by Product Type, 2025 to 2035
  • Figure 128: Middle East and Africa Market Value (USD Million) by Form, 2025 to 2035
  • Figure 129: Middle East and Africa Market Value (USD Million) by Country, 2025 to 2035
  • Figure 130: Middle East and Africa Market Value (USD Million) Analysis by Country, 2020 to 2035
  • Figure 131: Middle East and Africa Market Volume (Tons) Analysis by Country, 2020 to 2035
  • Figure 132: Middle East and Africa Market Value Share (%) and BPS Analysis by Country, 2025 to 2035
  • Figure 133: Middle East and Africa Market Y-o-Y Growth (%) Projections by Country, 2025 to 2035
  • Figure 134: Middle East and Africa Market Value (USD Million) Analysis by Product Type, 2020 to 2035
  • Figure 135: Middle East and Africa Market Volume (Tons) Analysis by Product Type, 2020 to 2035
  • Figure 136: Middle East and Africa Market Value Share (%) and BPS Analysis by Product Type, 2025 to 2035
  • Figure 137: Middle East and Africa Market Y-o-Y Growth (%) Projections by Product Type, 2025 to 2035
  • Figure 138: Middle East and Africa Market Value (USD Million) Analysis by Form, 2020 to 2035
  • Figure 139: Middle East and Africa Market Volume (Tons) Analysis by Form, 2020 to 2035
  • Figure 140: Middle East and Africa Market Value Share (%) and BPS Analysis by Form, 2025 to 2035
  • Figure 141: Middle East and Africa Market Y-o-Y Growth (%) Projections by Form, 2025 to 2035
  • Figure 142: Middle East and Africa Market Attractiveness by Product Type, 2025 to 2035
  • Figure 143: Middle East and Africa Market Attractiveness by Form, 2025 to 2035
  • Figure 144: Middle East and Africa Market Attractiveness by Country, 2025 to 2035
Dashboard
Dashboard
Dashboard
Dashboard
Dashboard
Dashboard

Full Research Suite comprises of:

Market outlook & trends analysis

Market outlook & trends analysis

Interviews & case studies

Interviews & case studies

Strategic recommendations

Strategic recommendations

Vendor profiles & capabilities analysis

Vendor profiles & capabilities analysis

5-year forecasts

5-year forecasts

8 regions and 60+ country-level data splits

8 regions and 60+ country-level data splits

Market segment data splits

Market segment data splits

12 months of continuous data updates

12 months of continuous data updates

DELIVERED AS:

PDF EXCEL ONLINE

Full Research Suite


$3500

$5000

$6500

Buy Report Now
Similar Industry Reports

Similar Industry Reports

Cattle Feeder Panels Market

Cattle Feeder Panels Market Size and Share Forecast Outlook 2025 to 2035

Cattle Feeder Market

Cattle Feeder Market Size and Share Forecast Outlook 2025 to 2035

Cattle Mineral Feeder Market

Cattle Mineral Feeder Market Size and Share Forecast Outlook 2025 to 2035

Dairy Cattle Feed Market

Dairy Cattle Feed Market

Cattle Squeeze Market

Cattle Squeeze Market Size and Share Forecast Outlook 2025 to 2035

Cattle Head Catch Market

Cattle Head Catch Market Size and Share Forecast Outlook 2025 to 2035

Cattle Grooming Chute Market

Cattle Grooming Chute Market Size and Share Forecast Outlook 2025 to 2035

Cattle Handling Systems Market

Cattle Handling Systems Market Size and Share Forecast Outlook 2025 to 2035

Cattle Blower Market

Cattle Blower Market Size and Share Forecast Outlook 2025 to 2035

Cattle Management Software Market

Cattle Management Software Market Size and Share Forecast Outlook 2025 to 2035

Cattle Supplies Market

Cattle Supplies Market Analysis & Forecast for 2025 to 2035

Cattle Nutrition Market

Cattle Nutrition Market Analysis by Cattle Type, Nutrition Type, Application, Life Stage Through 2025 to 2035

Smart Cattle Market
Smart Cattle Market

Smart Cattle Market

Automatic Cattle Waterer Market

Automatic Cattle Waterer Market – Trends & Growth Forecast 2025 to 2035

Feed Mixer Market
Feed Mixer Market

Feed Mixer Market Forecast and Outlook 2025 to 2035

Feed Grade Spray-dried Animal Plasma (SDAP) Market

Feed Grade Spray-dried Animal Plasma (SDAP) Market Size and Share Forecast Outlook 2025 to 2035

Feed Electrolytes Market

Feed Electrolytes Market Size and Share Forecast Outlook 2025 to 2035

Feed Micronutrients Market

Feed Micronutrients Market Size and Share Forecast Outlook 2025 to 2035

Feed Acidifier Market

Feed Acidifier Market Analysis Size Share and Forecast Outlook 2025 to 2035

Feed Flavors Market
Feed Flavors Market

Feed Flavors Market Size and Share Forecast Outlook 2025 to 2035

Future Market Insights

Cattle Feed Market

Chat With MaRIA

Chat With

MaRIA

Hi There, I am MaRIA, Your Market Research Intelligence Assistant. How may I help you?