Reports

- Global Locations -

Headquarters

Future Market Insights, Inc.

Christiana Corporate, 200
Continental Drive, Suite 401,
Newark, Delaware - 19713,
United States

T: +1-845-579-5705

Americas

Future Market Insights, Inc.

616 Corporate Way, Suite 2-9018,
Valley Cottage, NY 10989, United States

T: +1-347-918-3531

MEA

Future Market Insights

1602-6 Jumeirah Bay X2 Tower, Plot No: JLT-PH2-X2A,
Jumeirah Lakes Towers, Dubai,
United Arab Emirates

Europe

Future Market Insights

3rd Floor, 207 Regent Street,
W1B 3HH London
United Kingdom

T: + 44 (0) 20 8123 9659
D: +44 (0) 20 3287 4268

Asia Pacific

Future Market Insights

IndiaLand Global Tech Park, Unit UG-1, Behind Grand HighStreet, Phase 1, Hinjawadi, MH, Pune – 411057, India

Carton Liners Market Snapshot (2023 to 2033)

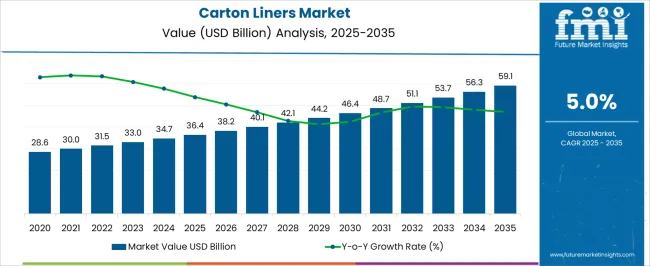
The global carton liners market size is expected to be valued at US$ 32.9 billion in 2023. Pharmaceutical cold chain packaging bolsters the overall scope for carton liners market, which is projected to grow at a CAGR of 5.2% between 2023 and 2033, totaling around US$ 54.6 billion by 2033.

Data Points Key Statistics
Carton Liners Market Value 2023 US$ 32.9 billion
Carton Liners Market Projected Value (2033) US$ 54.6 billion
Carton Liners Market CAGR (2023 to 2033) 5.2%

The growing concern about environmental sustainability has led to a significant shift in consumer preferences and purchasing behavior. Consumers are increasingly seeking products that align with their eco-conscious values, and this has extended to the packaging industry. Businesses, as a result, are under increasing pressure to adopt eco-friendly packaging solutions to meet consumer demands and reduce their environmental footprint.

Carton liners made from biodegradable and recyclable materials offer a sustainable packaging option that addresses these concerns. Biodegradable materials can naturally break down and decompose over time, minimizing the environmental impact and reducing the burden on landfills. On the other hand, recyclable materials can be collected and processed to create new products, promoting a circular economy and conserving natural resources.

One of the significant advantages of eco-friendly carton liners is their ability to replace single-use plastic liners. Traditional plastic liners can take hundreds of years to decompose, contributing to the global plastic waste problem and posing a threat to wildlife and ecosystems. In contrast, biodegradable and recyclable carton liners present a more responsible and planet-friendly alternative.

The adoption of eco-friendly carton liners can enhance a company's brand image and reputation among consumers. Businesses can attract eco-conscious consumers, build brand loyalty, and differentiate themselves from competitors, by showcasing a commitment to sustainability and environmental responsibility.

Don't pay for what you don't need

Customize your report by selecting specific countries or regions and save 30%!

Global Carton Liners Market Historical Analysis (2018 To 2022) Vs. Forecast Outlook (2023 To 2033)

The global demand for carton liners increased at a CAGR of 3.0% during the forecast period between 2018 and 2022, reaching a total of US$ 54.6 billion in 2033.

According to Future Market Insights, a market research and competitive intelligence provider, the carton liners market was valued at US$ 31.3 billion in 2022.

The rapid growth of the e-commerce and online retail industry has revolutionized the way consumers shop, presenting significant opportunities and challenges for the packaging sector. More and more consumers are turning to online shopping for their everyday needs, with the convenience of shopping from home and a wide range of products available at the click of a button. The shift in consumer behavior has resulted in a substantial increase in the volume of goods being shipped worldwide.

Carton liners play a crucial role in the e-commerce and retail industry by ensuring the safe and secure delivery of products to customers' doorsteps. The liners are designed to provide an additional layer of protection to products within the shipping boxes, safeguarding them from damage during transit. Fragile and delicate items, such as electronics, glassware, cosmetics, and other sensitive goods, greatly benefit from the added cushioning and shock-absorption properties of carton liners.

Carton liners contribute to enhancing the unboxing experience for customers, making it more enjoyable and memorable. Customized carton liners with branding, logos, or eye-catching designs add a touch of personalization, fostering a positive brand perception and encouraging customer loyalty. A well-packaged and attractive unboxing experience can leave a lasting impression on consumers, increasing the likelihood of repeat purchases and word-of-mouth recommendations.

In the highly competitive e-commerce landscape, where customer satisfaction is paramount, ensuring the safe delivery of products is essential. Damaged or broken items can result in customer complaints, returns, and negative reviews, all of which can have a detrimental impact on a brand's reputation and bottom line. Carton liners help mitigate these risks by providing an extra layer of protection, reducing the chances of product damage and ensuring that customers receive their orders in perfect condition.

Primary Factors Driving the Market for Carton Liners

Technological Advancements is Likely to be Beneficial for Market Growth

Technological advancements in manufacturing processes and materials have played a significant role in transforming carton liners from simple protective barriers to sophisticated and functional packaging solutions. The advancements have opened up new possibilities, allowing carton liners to cater to a broader range of industries and applications.

One key area of technological innovation in carton liners is the development of specialized coatings and treatments. For example, anti-static coatings are increasingly being applied to carton liners to prevent the buildup of static electricity. In industries where electronic components or sensitive devices are being shipped, such as the electronics industry, static electricity can pose a significant risk of damage. Anti-static carton liners help dissipate electrical charges, ensuring that the packaged items remain safe during transport.

Another area of advancement is the introduction of moisture-resistant coatings. The coatings provide an additional layer of protection against moisture and humidity, safeguarding the packaged products from potential water damage. Moisture-resistant carton liners are particularly valuable when shipping goods that are susceptible to moisture, such as pharmaceuticals, food items, and electronics.

Advancements in material science have led to the development of high-performance materials for carton liners. Manufacturers now have access to a wide range of materials, each with specific properties suited to different applications. For instance, corrugated board, kraft paper, and micro-flute materials offer varying degrees of strength, flexibility, and durability, allowing carton liners to be customized according to the specific needs of the products being shipped.

Increasing Use in Industrial Packaging to Fuel the Market Growth

The use of carton liners in industrial packaging has gained significant traction due to the unique advantages they offer for the safe and efficient handling of bulk and heavy items. The industrial sector encompasses a wide range of industries, including manufacturing, construction, automotive, and machinery, among others, all of which require robust packaging solutions to protect their products during storage and transportation.

One of the primary reasons for the increased use of carton liners in industrial packaging is their ability to provide an additional layer of protection to the goods being shipped. Industrial products, especially bulk and heavy items, are often more susceptible to damage during handling and transit due to their size and weight. Carton liners act as a cushioning and protective barrier, preventing physical impacts, abrasion, and surface scratches that can occur during movement or loading and unloading processes.

Carton liners offer excellent resistance against dust and moisture. In industrial environments, particularly in warehouses and manufacturing facilities, dust and dirt can accumulate on stored items over time, compromising their quality and appearance. Carton liners act as a barrier, preventing the ingress of dust and contaminants, thus preserving the integrity of the products.

Moisture is a common concern in many industrial applications. Carton liners with moisture-resistant coatings or materials act as a shield against humidity and external moisture, ensuring that the packaged items remain dry and unaffected, even in challenging environments.

Ismail Sutaria
Ismail Sutaria

Principal Consultant

Talk to Analyst

Find your sweet spots for generating winning opportunities in this market.

Category-wise Insights

Polyethylene (PE) to Take the Lion’s Share as The Most Desired Material

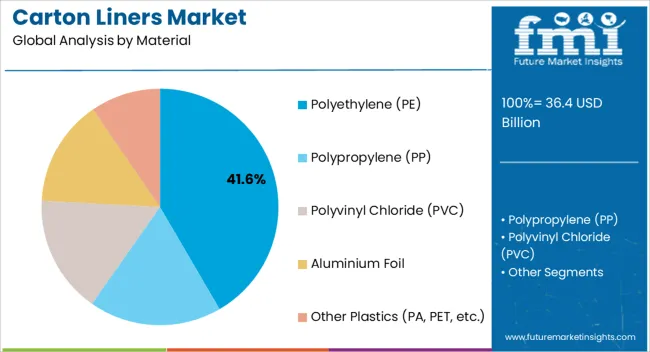
By material, polyethylene (PE) segment is estimated to be the leading segment at a CAGR of 5.1% during the forecast period.

The Polyethylene (PE) segment is expected to boost the growth of the carton liners Market. Polyethylene is a versatile and widely used material known for its excellent strength, flexibility, and moisture resistance, making it a preferred choice for various packaging applications, including carton liners.

Polyethylene carton liners offer exceptional protective properties, acting as a barrier against moisture, dust, and contaminants. They help preserve the quality and integrity of the packaged goods during storage and transportation, making them ideal for protecting a wide range of products.

Polyethylene is available in various forms, such as high-density polyethylene (HDPE) and low-density polyethylene (LDPE), each with distinct properties. The versatility allows manufacturers to tailor the carton liners to specific requirements, ensuring they meet the unique needs of different industries and products.

Polyethylene is a cost-effective material, making it an attractive option for businesses seeking efficient and affordable packaging solutions. Its availability and widespread use contribute to its cost-effectiveness, making it a popular choice for carton liners, particularly for high-volume packaging needs.

Food & Beverage Segment is considered to be the Most Lucrative End Use Segment

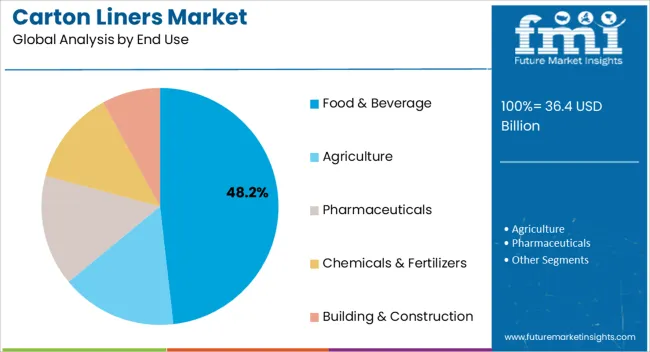
Based on the end-use, the food & beverage segment holds the largest share of the market. The segment is expected to hold a CAGR of 5.1% during the forecast period.

The food and beverage industry requires reliable and hygienic packaging solutions to protect perishable items during storage and transportation. Carton liners provide an additional layer of protection against moisture, contaminants, and external elements, ensuring the freshness and quality of food products. The demand for carton liners in the food and beverage sector is expected to grow, as consumer preferences for fresh and ready-to-eat food increase.

The stringent regulations and standards related to food safety and hygiene are driving the adoption of advanced packaging solutions in the food industry. Carton liners help food manufacturers comply with these regulations by offering a secure and clean packaging option. Carton liners with appropriate barrier properties are gaining prominence, as the industry continues to prioritize food safety.

Carton liners can be customized with attractive designs and branding, enhancing the shelf appeal of packaged food products. They provide a convenient packaging solution for various food items, such as grains, cereals, and powdered products. The demand for carton liners in the food and beverage sector is expected to rise, as consumers seek convenience and visually appealing packaging.

Region-wise Insights

Regional Outlook of the Carton Liners Market

Growth prospects of the carton liners market are high in the Asia Pacific market, which includes East Asia and South Asia & Pacific, is primarily owing to the increased use of cartons in packaging and shipments. China is expected to remain at the forefront of the Asia Pacific’s carton liners market. The region is expected to hold a CAGR of 5.1% over the analysis period.

High growth opportunities for the carton liners market and sales of carton liners are also expected in India and ASEAN countries, with a steady growth of trade activities and an increasing number of local carton liners market players in the region.

An embrace of research and development is underway in the carton liners market to leverage bioplastics and other eco-friendly materials to address mounting concerns over plastic pollution across the globe.

The strong presence of innovative companies in developed regions will continue to impact the growth of the carton liners market as well as boost demand for carton liners and escalate sales of carton liners.
Get the data you need at a Fraction of the cost

Personalize your report by choosing insights you need
and save 40%!

Competitive Landscape

Key players in the carton liners market are strongly focusing on profit generation from their existing product portfolios along while exploring potential new applications. The players are emphasizing on increasing their carton liners production capacities, to cater to the demand from numerous end use industries. Prominent players are also pushing for geographical expansion to decrease the dependency on imported carton liners.

Recent Developments:

  • In 2023, Sterling Packaging announced the launch of its new line of carton liners that are designed to be more water-resistant. The new liners can withstand exposure to water, making them a more suitable option for applications in wet environments.
  • In the same year, U. P. Packaging Industry announced the launch of its new line of carton liners that are designed to be more high-performance. The new liners are designed to meet the demanding requirements of a variety of applications, including food, beverage, and pharmaceutical.
  • In 2022, Sancell announced the launch of its new line of carton liners that are designed to be more cost-effective. The new liners are made from a lower-cost material that is still effective in a variety of applications.
  • In 2022, Prior Packaging announced the launch of its new line of carton liners that are designed to be more environmentally friendly. The new liners are made from materials that are derived from renewable resources and are recyclable in standard paper recycling streams.

Scope of the Report

Attribute Details
Forecast Period 2023 to 2033
Historical Data Available for 2018 to 2022
Market Analysis USD Billion for value and Tons for Volume
Key Regions Covered North America, Latin America, Western Europe, Eastern Europe, South Asia & Pacific, East Asia, and Middle East & Africa
Key Countries Covered United States, Canada, Brazil, Mexico, Germany, UK, France, Spain, Italy, Poland, Russia, Czech Republic, Romania, India, Bangladesh, Australia, New Zealand, China, Japan, South Korea, GCC Countries, South Africa, Israel.
Key Segments Covered Application, End Use, Material Type, Region
Key Companies Profiled
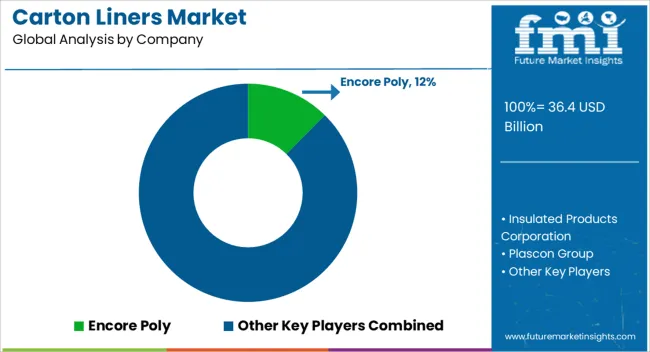
  • Encore Poly
  • Insulated Products Corporation
  • Plascon Group
  • Sancell
  • Alpine Packaging, Inc.
  • Heritage Packaging
  • American Plastics Company
  • Protective Lining Corp.
  • Prior Packaging
  • Chantler Packages
Report Coverage Market Forecast, brand share analysis, competition intelligence, DROT analysis, Market Dynamics and Challenges, Strategic Growth Initiatives
Customization & Pricing Available upon Request

Key Segments Profiled In The Global Carton Liners Market

By Material:

  • Polyethylene (PE)
  • Polypropylene (PP)
  • Polyvinyl Chloride (PVC)
  • Aluminium Foil
  • Other Plastics (PA, PET, etc.)

By Thickness:

  • Less than 50 Micron
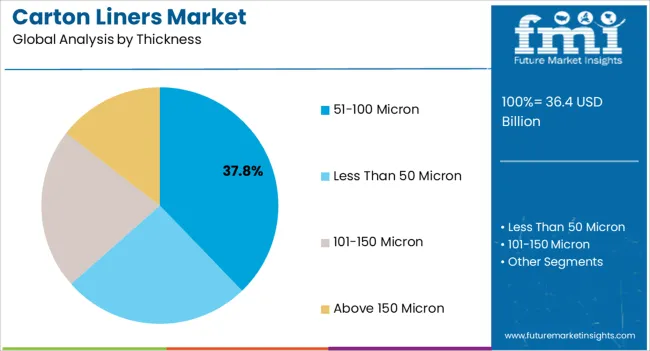
  • 51-100 Micron
  • 101-150 Micron
  • Above 150 Micron

By End Use:

  • Food & Beverage
  • Agriculture
  • Pharmaceuticals
  • Chemicals & Fertilizers
  • Building & Construction

By Region:

  • North America
  • Latin America
  • Western Europe
  • Eastern Europe
  • South Asia and Pacific
  • East Asia
  • Middle East and Africa (MEA)

Frequently Asked Questions

What is the expected growth of the global carton liners market from 2023 to 2033?

The global carton liners market is expected to grow at a 5.2% CAGR from 2023 to 2033.

What is expected be the outlook of the market by 2023?

By 2023, the global carton liners market is estimated to gain US$ 32.9 billion.

What is anticipated be the total market valuation by 2033?

By 2033, the carton liners market valuation can reach a sum of US$ 54.6 billion.

Which region is expected to be the most lucrative for the carton liners market?

In 2033, Asia Pacific is expected to hold a CAGR of 5.1% of the market during the forecast period.

By material, which segment gaining traction for the sales of carton liners?

The most popular material segment is polyethylene (PE) and is expected to witness a CAGR of 4.4% during the forecast period.

Which end-use segment of carton liners is sought to be more popular?

The most popular end-use segment is food & beverage, and is expected to hold a CAGR of 4.4% during the forecast period.

Table of Content

1. Executive Summary

    1.1. Global Market Outlook

    1.2. Demand-side Trends

    1.3. Supply-side Trends

    1.4. Technology Roadmap Analysis

    1.5. Analysis and Recommendations

2. Market Overview

    2.1. Market Coverage / Taxonomy

    2.2. Market Definition / Scope / Limitations

3. Market Background

    3.1. Market Dynamics

        3.1.1. Drivers

        3.1.2. Restraints

        3.1.3. Opportunity

        3.1.4. Trends

    3.2. Scenario Forecast

        3.2.1. Demand in Optimistic Scenario

        3.2.2. Demand in Likely Scenario

        3.2.3. Demand in Conservative Scenario

    3.3. Opportunity Map Analysis

    3.4. Product Life Cycle Analysis

    3.5. Supply Chain Analysis

        3.5.1. Supply Side Participants and their Roles

            3.5.1.1. Producers

            3.5.1.2. Mid-Level Participants (Traders/ Agents/ Brokers)

            3.5.1.3. Wholesalers and Distributors

        3.5.2. Value Added and Value Created at Node in the Supply Chain

        3.5.3. List of Raw Material Suppliers

        3.5.4. List of Existing and Potential Buyer’s

    3.6. Investment Feasibility Matrix

    3.7. Value Chain Analysis

        3.7.1. Profit Margin Analysis

        3.7.2. Wholesalers and Distributors

        3.7.3. Retailers

    3.8. PESTLE and Porter’s Analysis

    3.9. Regulatory Landscape

        3.9.1. By Key Regions

        3.9.2. By Key Countries

    3.10. Regional Parent Market Outlook

    3.11. Production and Consumption Statistics

    3.12. Import and Export Statistics

4. Global Market Analysis 2018 to 2022 and Forecast, 2023 to 2033

    4.1. Historical Market Size Value (US$ Million) & Volume (Units) Analysis, 2018 to 2022

    4.2. Current and Future Market Size Value (US$ Million) & Volume (Units) Projections, 2023 to 2033

        4.2.1. Y-o-Y Growth Trend Analysis

        4.2.2. Absolute $ Opportunity Analysis

5. Global Market Analysis 2018 to 2022 and Forecast 2023 to 2033, By Material

    5.1. Introduction / Key Findings

    5.2. Historical Market Size Value (US$ Million) & Volume (Units) Analysis By Material, 2018 to 2022

    5.3. Current and Future Market Size Value (US$ Million) & Volume (Units) Analysis and Forecast By Material, 2023 to 2033

        5.3.1. Polyethylene

        5.3.2. Polystyrene

        5.3.3. Aluminum Foil

        5.3.4. Others

    5.4. Y-o-Y Growth Trend Analysis By Material, 2018 to 2022

    5.5. Absolute $ Opportunity Analysis By Material, 2023 to 2033

6. Global Market Analysis 2018 to 2022 and Forecast 2023 to 2033, By Application

    6.1. Introduction / Key Findings

    6.2. Historical Market Size Value (US$ Million) & Volume (Units) Analysis By Application, 2018 to 2022

    6.3. Current and Future Market Size Value (US$ Million) & Volume (Units) Analysis and Forecast By Application, 2023 to 2033

        6.3.1. VCI (Volatile Corrosion Inhibitors)

        6.3.2. Thermal Protection

        6.3.3. Static Shielding / ESD Protection

        6.3.4. Moisture and Oxygen Barrier

        6.3.5. Others

    6.4. Y-o-Y Growth Trend Analysis By Application, 2018 to 2022

    6.5. Absolute $ Opportunity Analysis By Application, 2023 to 2033

7. Global Market Analysis 2018 to 2022 and Forecast 2023 to 2033, By End-Use Industry

    7.1. Introduction / Key Findings

    7.2. Historical Market Size Value (US$ Million) & Volume (Units) Analysis By End-Use Industry, 2018 to 2022

    7.3. Current and Future Market Size Value (US$ Million) & Volume (Units) Analysis and Forecast By End-Use Industry, 2023 to 2033

        7.3.1. Food Industry

        7.3.2. Metal Industry

        7.3.3. Automotive Industry

        7.3.4. Building & Construction Industry

        7.3.5. Chemical & Fertilizers Industry

        7.3.6. Healthcare Industry

        7.3.7. Others (Publications & Textiles)

    7.4. Y-o-Y Growth Trend Analysis By End-Use Industry, 2018 to 2022

    7.5. Absolute $ Opportunity Analysis By End-Use Industry, 2023 to 2033

8. Global Market Analysis 2018 to 2022 and Forecast 2023 to 2033, By Region

    8.1. Introduction

    8.2. Historical Market Size Value (US$ Million) & Volume (Units) Analysis By Region, 2018 to 2022

    8.3. Current Market Size Value (US$ Million) & Volume (Units) Analysis and Forecast By Region, 2023 to 2033

        8.3.1. North America

        8.3.2. Latin America

        8.3.3. Western Europe

        8.3.4. Eastern Europe

        8.3.5. South Asia and Pacific

        8.3.6. East Asia

        8.3.7. Middle East and Africa

    8.4. Market Attractiveness Analysis By Region

9. North America Market Analysis 2018 to 2022 and Forecast 2023 to 2033, By Country

    9.1. Historical Market Size Value (US$ Million) & Volume (Units) Trend Analysis By Market Taxonomy, 2018 to 2022

    9.2. Market Size Value (US$ Million) & Volume (Units) Forecast By Market Taxonomy, 2023 to 2033

        9.2.1. By Country

            9.2.1.1. USA

            9.2.1.2. Canada

        9.2.2. By Material

        9.2.3. By Application

        9.2.4. By End-Use Industry

    9.3. Market Attractiveness Analysis

        9.3.1. By Country

        9.3.2. By Material

        9.3.3. By Application

        9.3.4. By End-Use Industry

    9.4. Key Takeaways

10. Latin America Market Analysis 2018 to 2022 and Forecast 2023 to 2033, By Country

    10.1. Historical Market Size Value (US$ Million) & Volume (Units) Trend Analysis By Market Taxonomy, 2018 to 2022

    10.2. Market Size Value (US$ Million) & Volume (Units) Forecast By Market Taxonomy, 2023 to 2033

        10.2.1. By Country

            10.2.1.1. Brazil

            10.2.1.2. Mexico

            10.2.1.3. Rest of Latin America

        10.2.2. By Material

        10.2.3. By Application

        10.2.4. By End-Use Industry

    10.3. Market Attractiveness Analysis

        10.3.1. By Country

        10.3.2. By Material

        10.3.3. By Application

        10.3.4. By End-Use Industry

    10.4. Key Takeaways

11. Western Europe Market Analysis 2018 to 2022 and Forecast 2023 to 2033, By Country

    11.1. Historical Market Size Value (US$ Million) & Volume (Units) Trend Analysis By Market Taxonomy, 2018 to 2022

    11.2. Market Size Value (US$ Million) & Volume (Units) Forecast By Market Taxonomy, 2023 to 2033

        11.2.1. By Country

            11.2.1.1. Germany

            11.2.1.2. UK

            11.2.1.3. France

            11.2.1.4. Spain

            11.2.1.5. Italy

            11.2.1.6. Rest of Western Europe

        11.2.2. By Material

        11.2.3. By Application

        11.2.4. By End-Use Industry

    11.3. Market Attractiveness Analysis

        11.3.1. By Country

        11.3.2. By Material

        11.3.3. By Application

        11.3.4. By End-Use Industry

    11.4. Key Takeaways

12. Eastern Europe Market Analysis 2018 to 2022 and Forecast 2023 to 2033, By Country

    12.1. Historical Market Size Value (US$ Million) & Volume (Units) Trend Analysis By Market Taxonomy, 2018 to 2022

    12.2. Market Size Value (US$ Million) & Volume (Units) Forecast By Market Taxonomy, 2023 to 2033

        12.2.1. By Country

            12.2.1.1. Poland

            12.2.1.2. Russia

            12.2.1.3. Czech Republic

            12.2.1.4. Romania

            12.2.1.5. Rest of Eastern Europe

        12.2.2. By Material

        12.2.3. By Application

        12.2.4. By End-Use Industry

    12.3. Market Attractiveness Analysis

        12.3.1. By Country

        12.3.2. By Material

        12.3.3. By Application

        12.3.4. By End-Use Industry

    12.4. Key Takeaways

13. South Asia and Pacific Market Analysis 2018 to 2022 and Forecast 2023 to 2033, By Country

    13.1. Historical Market Size Value (US$ Million) & Volume (Units) Trend Analysis By Market Taxonomy, 2018 to 2022

    13.2. Market Size Value (US$ Million) & Volume (Units) Forecast By Market Taxonomy, 2023 to 2033

        13.2.1. By Country

            13.2.1.1. India

            13.2.1.2. Bangladesh

            13.2.1.3. Australia

            13.2.1.4. New Zealand

            13.2.1.5. Rest of South Asia and Pacific

        13.2.2. By Material

        13.2.3. By Application

        13.2.4. By End-Use Industry

    13.3. Market Attractiveness Analysis

        13.3.1. By Country

        13.3.2. By Material

        13.3.3. By Application

        13.3.4. By End-Use Industry

    13.4. Key Takeaways

14. East Asia Market Analysis 2018 to 2022 and Forecast 2023 to 2033, By Country

    14.1. Historical Market Size Value (US$ Million) & Volume (Units) Trend Analysis By Market Taxonomy, 2018 to 2022

    14.2. Market Size Value (US$ Million) & Volume (Units) Forecast By Market Taxonomy, 2023 to 2033

        14.2.1. By Country

            14.2.1.1. China

            14.2.1.2. Japan

            14.2.1.3. South Korea

        14.2.2. By Material

        14.2.3. By Application

        14.2.4. By End-Use Industry

    14.3. Market Attractiveness Analysis

        14.3.1. By Country

        14.3.2. By Material

        14.3.3. By Application

        14.3.4. By End-Use Industry

    14.4. Key Takeaways

15. Middle East and Africa Market Analysis 2018 to 2022 and Forecast 2023 to 2033, By Country

    15.1. Historical Market Size Value (US$ Million) & Volume (Units) Trend Analysis By Market Taxonomy, 2018 to 2022

    15.2. Market Size Value (US$ Million) & Volume (Units) Forecast By Market Taxonomy, 2023 to 2033

        15.2.1. By Country

            15.2.1.1. GCC Countries

            15.2.1.2. South Africa

            15.2.1.3. Israel

            15.2.1.4. Rest of MEA

        15.2.2. By Material

        15.2.3. By Application

        15.2.4. By End-Use Industry

    15.3. Market Attractiveness Analysis

        15.3.1. By Country

        15.3.2. By Material

        15.3.3. By Application

        15.3.4. By End-Use Industry

    15.4. Key Takeaways

16. Key Countries Market Analysis

    16.1. USA

        16.1.1. Pricing Analysis

        16.1.2. Market Share Analysis, 2022

            16.1.2.1. By Material

            16.1.2.2. By Application

            16.1.2.3. By End-Use Industry

    16.2. Canada

        16.2.1. Pricing Analysis

        16.2.2. Market Share Analysis, 2022

            16.2.2.1. By Material

            16.2.2.2. By Application

            16.2.2.3. By End-Use Industry

    16.3. Brazil

        16.3.1. Pricing Analysis

        16.3.2. Market Share Analysis, 2022

            16.3.2.1. By Material

            16.3.2.2. By Application

            16.3.2.3. By End-Use Industry

    16.4. Mexico

        16.4.1. Pricing Analysis

        16.4.2. Market Share Analysis, 2022

            16.4.2.1. By Material

            16.4.2.2. By Application

            16.4.2.3. By End-Use Industry

    16.5. Germany

        16.5.1. Pricing Analysis

        16.5.2. Market Share Analysis, 2022

            16.5.2.1. By Material

            16.5.2.2. By Application

            16.5.2.3. By End-Use Industry

    16.6. UK

        16.6.1. Pricing Analysis

        16.6.2. Market Share Analysis, 2022

            16.6.2.1. By Material

            16.6.2.2. By Application

            16.6.2.3. By End-Use Industry

    16.7. France

        16.7.1. Pricing Analysis

        16.7.2. Market Share Analysis, 2022

            16.7.2.1. By Material

            16.7.2.2. By Application

            16.7.2.3. By End-Use Industry

    16.8. Spain

        16.8.1. Pricing Analysis

        16.8.2. Market Share Analysis, 2022

            16.8.2.1. By Material

            16.8.2.2. By Application

            16.8.2.3. By End-Use Industry

    16.9. Italy

        16.9.1. Pricing Analysis

        16.9.2. Market Share Analysis, 2022

            16.9.2.1. By Material

            16.9.2.2. By Application

            16.9.2.3. By End-Use Industry

    16.10. Poland

        16.10.1. Pricing Analysis

        16.10.2. Market Share Analysis, 2022

            16.10.2.1. By Material

            16.10.2.2. By Application

            16.10.2.3. By End-Use Industry

    16.11. Russia

        16.11.1. Pricing Analysis

        16.11.2. Market Share Analysis, 2022

            16.11.2.1. By Material

            16.11.2.2. By Application

            16.11.2.3. By End-Use Industry

    16.12. Czech Republic

        16.12.1. Pricing Analysis

        16.12.2. Market Share Analysis, 2022

            16.12.2.1. By Material

            16.12.2.2. By Application

            16.12.2.3. By End-Use Industry

    16.13. Romania

        16.13.1. Pricing Analysis

        16.13.2. Market Share Analysis, 2022

            16.13.2.1. By Material

            16.13.2.2. By Application

            16.13.2.3. By End-Use Industry

    16.14. India

        16.14.1. Pricing Analysis

        16.14.2. Market Share Analysis, 2022

            16.14.2.1. By Material

            16.14.2.2. By Application

            16.14.2.3. By End-Use Industry

    16.15. Bangladesh

        16.15.1. Pricing Analysis

        16.15.2. Market Share Analysis, 2022

            16.15.2.1. By Material

            16.15.2.2. By Application

            16.15.2.3. By End-Use Industry

    16.16. Australia

        16.16.1. Pricing Analysis

        16.16.2. Market Share Analysis, 2022

            16.16.2.1. By Material

            16.16.2.2. By Application

            16.16.2.3. By End-Use Industry

    16.17. New Zealand

        16.17.1. Pricing Analysis

        16.17.2. Market Share Analysis, 2022

            16.17.2.1. By Material

            16.17.2.2. By Application

            16.17.2.3. By End-Use Industry

    16.18. China

        16.18.1. Pricing Analysis

        16.18.2. Market Share Analysis, 2022

            16.18.2.1. By Material

            16.18.2.2. By Application

            16.18.2.3. By End-Use Industry

    16.19. Japan

        16.19.1. Pricing Analysis

        16.19.2. Market Share Analysis, 2022

            16.19.2.1. By Material

            16.19.2.2. By Application

            16.19.2.3. By End-Use Industry

    16.20. South Korea

        16.20.1. Pricing Analysis

        16.20.2. Market Share Analysis, 2022

            16.20.2.1. By Material

            16.20.2.2. By Application

            16.20.2.3. By End-Use Industry

    16.21. GCC Countries

        16.21.1. Pricing Analysis

        16.21.2. Market Share Analysis, 2022

            16.21.2.1. By Material

            16.21.2.2. By Application

            16.21.2.3. By End-Use Industry

    16.22. South Africa

        16.22.1. Pricing Analysis

        16.22.2. Market Share Analysis, 2022

            16.22.2.1. By Material

            16.22.2.2. By Application

            16.22.2.3. By End-Use Industry

    16.23. Israel

        16.23.1. Pricing Analysis

        16.23.2. Market Share Analysis, 2022

            16.23.2.1. By Material

            16.23.2.2. By Application

            16.23.2.3. By End-Use Industry

17. Market Structure Analysis

    17.1. Competition Dashboard

    17.2. Competition Benchmarking

    17.3. Market Share Analysis of Top Players

        17.3.1. By Regional

        17.3.2. By Material

        17.3.3. By Application

        17.3.4. By End-Use Industry

18. Competition Analysis

    18.1. Competition Deep Dive

        18.1.1. Encore Poly

            18.1.1.1. Overview

            18.1.1.2. Product Portfolio

            18.1.1.3. Profitability by Market Segments

            18.1.1.4. Sales Footprint

            18.1.1.5. Strategy Overview

                18.1.1.5.1. Marketing Strategy

                18.1.1.5.2. Product Strategy

                18.1.1.5.3. Channel Strategy

        18.1.2. Insulated Products Corporation

            18.1.2.1. Overview

            18.1.2.2. Product Portfolio

            18.1.2.3. Profitability by Market Segments

            18.1.2.4. Sales Footprint

            18.1.2.5. Strategy Overview

                18.1.2.5.1. Marketing Strategy

                18.1.2.5.2. Product Strategy

                18.1.2.5.3. Channel Strategy

        18.1.3. Plascon Group

            18.1.3.1. Overview

            18.1.3.2. Product Portfolio

            18.1.3.3. Profitability by Market Segments

            18.1.3.4. Sales Footprint

            18.1.3.5. Strategy Overview

                18.1.3.5.1. Marketing Strategy

                18.1.3.5.2. Product Strategy

                18.1.3.5.3. Channel Strategy

        18.1.4. Sancell

            18.1.4.1. Overview

            18.1.4.2. Product Portfolio

            18.1.4.3. Profitability by Market Segments

            18.1.4.4. Sales Footprint

            18.1.4.5. Strategy Overview

                18.1.4.5.1. Marketing Strategy

                18.1.4.5.2. Product Strategy

                18.1.4.5.3. Channel Strategy

        18.1.5. Alpine Packaging

            18.1.5.1. Overview

            18.1.5.2. Product Portfolio

            18.1.5.3. Profitability by Market Segments

            18.1.5.4. Sales Footprint

            18.1.5.5. Strategy Overview

                18.1.5.5.1. Marketing Strategy

                18.1.5.5.2. Product Strategy

                18.1.5.5.3. Channel Strategy

        18.1.6. Heritage Packaging

            18.1.6.1. Overview

            18.1.6.2. Product Portfolio

            18.1.6.3. Profitability by Market Segments

            18.1.6.4. Sales Footprint

            18.1.6.5. Strategy Overview

                18.1.6.5.1. Marketing Strategy

                18.1.6.5.2. Product Strategy

                18.1.6.5.3. Channel Strategy

        18.1.7. American Plastics Company

            18.1.7.1. Overview

            18.1.7.2. Product Portfolio

            18.1.7.3. Profitability by Market Segments

            18.1.7.4. Sales Footprint

            18.1.7.5. Strategy Overview

                18.1.7.5.1. Marketing Strategy

                18.1.7.5.2. Product Strategy

                18.1.7.5.3. Channel Strategy

        18.1.8. Protective Lining Corp

            18.1.8.1. Overview

            18.1.8.2. Product Portfolio

            18.1.8.3. Profitability by Market Segments

            18.1.8.4. Sales Footprint

            18.1.8.5. Strategy Overview

                18.1.8.5.1. Marketing Strategy

                18.1.8.5.2. Product Strategy

                18.1.8.5.3. Channel Strategy

        18.1.9. Prior Packaging

            18.1.9.1. Overview

            18.1.9.2. Product Portfolio

            18.1.9.3. Profitability by Market Segments

            18.1.9.4. Sales Footprint

            18.1.9.5. Strategy Overview

                18.1.9.5.1. Marketing Strategy

                18.1.9.5.2. Product Strategy

                18.1.9.5.3. Channel Strategy

        18.1.10. Chantler Packages

            18.1.10.1. Overview

            18.1.10.2. Product Portfolio

            18.1.10.3. Profitability by Market Segments

            18.1.10.4. Sales Footprint

            18.1.10.5. Strategy Overview

                18.1.10.5.1. Marketing Strategy

                18.1.10.5.2. Product Strategy

                18.1.10.5.3. Channel Strategy

19. Assumptions & Acronyms Used

20. Research Methodology

Don't pay for what you don't need

Customize your report by selecting specific countries or regions and save 30%!

List of Tables

Table 1: Global Market Value (US$ Million) Forecast by Region, 2018 to 2033

Table 2: Global Market Volume (Units) Forecast by Region, 2018 to 2033

Table 3: Global Market Value (US$ Million) Forecast by Material, 2018 to 2033

Table 4: Global Market Volume (Units) Forecast by Material, 2018 to 2033

Table 5: Global Market Value (US$ Million) Forecast by Application, 2018 to 2033

Table 6: Global Market Volume (Units) Forecast by Application, 2018 to 2033

Table 7: Global Market Value (US$ Million) Forecast by End-Use Industry, 2018 to 2033

Table 8: Global Market Volume (Units) Forecast by End-Use Industry, 2018 to 2033

Table 9: North America Market Value (US$ Million) Forecast by Country, 2018 to 2033

Table 10: North America Market Volume (Units) Forecast by Country, 2018 to 2033

Table 11: North America Market Value (US$ Million) Forecast by Material, 2018 to 2033

Table 12: North America Market Volume (Units) Forecast by Material, 2018 to 2033

Table 13: North America Market Value (US$ Million) Forecast by Application, 2018 to 2033

Table 14: North America Market Volume (Units) Forecast by Application, 2018 to 2033

Table 15: North America Market Value (US$ Million) Forecast by End-Use Industry, 2018 to 2033

Table 16: North America Market Volume (Units) Forecast by End-Use Industry, 2018 to 2033

Table 17: Latin America Market Value (US$ Million) Forecast by Country, 2018 to 2033

Table 18: Latin America Market Volume (Units) Forecast by Country, 2018 to 2033

Table 19: Latin America Market Value (US$ Million) Forecast by Material, 2018 to 2033

Table 20: Latin America Market Volume (Units) Forecast by Material, 2018 to 2033

Table 21: Latin America Market Value (US$ Million) Forecast by Application, 2018 to 2033

Table 22: Latin America Market Volume (Units) Forecast by Application, 2018 to 2033

Table 23: Latin America Market Value (US$ Million) Forecast by End-Use Industry, 2018 to 2033

Table 24: Latin America Market Volume (Units) Forecast by End-Use Industry, 2018 to 2033

Table 25: Western Europe Market Value (US$ Million) Forecast by Country, 2018 to 2033

Table 26: Western Europe Market Volume (Units) Forecast by Country, 2018 to 2033

Table 27: Western Europe Market Value (US$ Million) Forecast by Material, 2018 to 2033

Table 28: Western Europe Market Volume (Units) Forecast by Material, 2018 to 2033

Table 29: Western Europe Market Value (US$ Million) Forecast by Application, 2018 to 2033

Table 30: Western Europe Market Volume (Units) Forecast by Application, 2018 to 2033

Table 31: Western Europe Market Value (US$ Million) Forecast by End-Use Industry, 2018 to 2033

Table 32: Western Europe Market Volume (Units) Forecast by End-Use Industry, 2018 to 2033

Table 33: Eastern Europe Market Value (US$ Million) Forecast by Country, 2018 to 2033

Table 34: Eastern Europe Market Volume (Units) Forecast by Country, 2018 to 2033

Table 35: Eastern Europe Market Value (US$ Million) Forecast by Material, 2018 to 2033

Table 36: Eastern Europe Market Volume (Units) Forecast by Material, 2018 to 2033

Table 37: Eastern Europe Market Value (US$ Million) Forecast by Application, 2018 to 2033

Table 38: Eastern Europe Market Volume (Units) Forecast by Application, 2018 to 2033

Table 39: Eastern Europe Market Value (US$ Million) Forecast by End-Use Industry, 2018 to 2033

Table 40: Eastern Europe Market Volume (Units) Forecast by End-Use Industry, 2018 to 2033

Table 41: South Asia and Pacific Market Value (US$ Million) Forecast by Country, 2018 to 2033

Table 42: South Asia and Pacific Market Volume (Units) Forecast by Country, 2018 to 2033

Table 43: South Asia and Pacific Market Value (US$ Million) Forecast by Material, 2018 to 2033

Table 44: South Asia and Pacific Market Volume (Units) Forecast by Material, 2018 to 2033

Table 45: South Asia and Pacific Market Value (US$ Million) Forecast by Application, 2018 to 2033

Table 46: South Asia and Pacific Market Volume (Units) Forecast by Application, 2018 to 2033

Table 47: South Asia and Pacific Market Value (US$ Million) Forecast by End-Use Industry, 2018 to 2033

Table 48: South Asia and Pacific Market Volume (Units) Forecast by End-Use Industry, 2018 to 2033

Table 49: East Asia Market Value (US$ Million) Forecast by Country, 2018 to 2033

Table 50: East Asia Market Volume (Units) Forecast by Country, 2018 to 2033

Table 51: East Asia Market Value (US$ Million) Forecast by Material, 2018 to 2033

Table 52: East Asia Market Volume (Units) Forecast by Material, 2018 to 2033

Table 53: East Asia Market Value (US$ Million) Forecast by Application, 2018 to 2033

Table 54: East Asia Market Volume (Units) Forecast by Application, 2018 to 2033

Table 55: East Asia Market Value (US$ Million) Forecast by End-Use Industry, 2018 to 2033

Table 56: East Asia Market Volume (Units) Forecast by End-Use Industry, 2018 to 2033

Table 57: Middle East and Africa Market Value (US$ Million) Forecast by Country, 2018 to 2033

Table 58: Middle East and Africa Market Volume (Units) Forecast by Country, 2018 to 2033

Table 59: Middle East and Africa Market Value (US$ Million) Forecast by Material, 2018 to 2033

Table 60: Middle East and Africa Market Volume (Units) Forecast by Material, 2018 to 2033

Table 61: Middle East and Africa Market Value (US$ Million) Forecast by Application, 2018 to 2033

Table 62: Middle East and Africa Market Volume (Units) Forecast by Application, 2018 to 2033

Table 63: Middle East and Africa Market Value (US$ Million) Forecast by End-Use Industry, 2018 to 2033

Table 64: Middle East and Africa Market Volume (Units) Forecast by End-Use Industry, 2018 to 2033
Ismail Sutaria
Ismail Sutaria

Principal Consultant

Talk to Analyst

Find your sweet spots for generating winning opportunities in this market.

List of Charts

Figure 1: Global Market Value (US$ Million) by Material, 2023 to 2033

Figure 2: Global Market Value (US$ Million) by Application, 2023 to 2033

Figure 3: Global Market Value (US$ Million) by End-Use Industry, 2023 to 2033

Figure 4: Global Market Value (US$ Million) by Region, 2023 to 2033

Figure 5: Global Market Value (US$ Million) Analysis by Region, 2018 to 2033

Figure 6: Global Market Volume (Units) Analysis by Region, 2018 to 2033

Figure 7: Global Market Value Share (%) and BPS Analysis by Region, 2023 to 2033

Figure 8: Global Market Y-o-Y Growth (%) Projections by Region, 2023 to 2033

Figure 9: Global Market Value (US$ Million) Analysis by Material, 2018 to 2033

Figure 10: Global Market Volume (Units) Analysis by Material, 2018 to 2033

Figure 11: Global Market Value Share (%) and BPS Analysis by Material, 2023 to 2033

Figure 12: Global Market Y-o-Y Growth (%) Projections by Material, 2023 to 2033

Figure 13: Global Market Value (US$ Million) Analysis by Application, 2018 to 2033

Figure 14: Global Market Volume (Units) Analysis by Application, 2018 to 2033

Figure 15: Global Market Value Share (%) and BPS Analysis by Application, 2023 to 2033

Figure 16: Global Market Y-o-Y Growth (%) Projections by Application, 2023 to 2033

Figure 17: Global Market Value (US$ Million) Analysis by End-Use Industry, 2018 to 2033

Figure 18: Global Market Volume (Units) Analysis by End-Use Industry, 2018 to 2033

Figure 19: Global Market Value Share (%) and BPS Analysis by End-Use Industry, 2023 to 2033

Figure 20: Global Market Y-o-Y Growth (%) Projections by End-Use Industry, 2023 to 2033

Figure 21: Global Market Attractiveness by Material, 2023 to 2033

Figure 22: Global Market Attractiveness by Application, 2023 to 2033

Figure 23: Global Market Attractiveness by End-Use Industry, 2023 to 2033

Figure 24: Global Market Attractiveness by Region, 2023 to 2033

Figure 25: North America Market Value (US$ Million) by Material, 2023 to 2033

Figure 26: North America Market Value (US$ Million) by Application, 2023 to 2033

Figure 27: North America Market Value (US$ Million) by End-Use Industry, 2023 to 2033

Figure 28: North America Market Value (US$ Million) by Country, 2023 to 2033

Figure 29: North America Market Value (US$ Million) Analysis by Country, 2018 to 2033

Figure 30: North America Market Volume (Units) Analysis by Country, 2018 to 2033

Figure 31: North America Market Value Share (%) and BPS Analysis by Country, 2023 to 2033

Figure 32: North America Market Y-o-Y Growth (%) Projections by Country, 2023 to 2033

Figure 33: North America Market Value (US$ Million) Analysis by Material, 2018 to 2033

Figure 34: North America Market Volume (Units) Analysis by Material, 2018 to 2033

Figure 35: North America Market Value Share (%) and BPS Analysis by Material, 2023 to 2033

Figure 36: North America Market Y-o-Y Growth (%) Projections by Material, 2023 to 2033

Figure 37: North America Market Value (US$ Million) Analysis by Application, 2018 to 2033

Figure 38: North America Market Volume (Units) Analysis by Application, 2018 to 2033

Figure 39: North America Market Value Share (%) and BPS Analysis by Application, 2023 to 2033

Figure 40: North America Market Y-o-Y Growth (%) Projections by Application, 2023 to 2033

Figure 41: North America Market Value (US$ Million) Analysis by End-Use Industry, 2018 to 2033

Figure 42: North America Market Volume (Units) Analysis by End-Use Industry, 2018 to 2033

Figure 43: North America Market Value Share (%) and BPS Analysis by End-Use Industry, 2023 to 2033

Figure 44: North America Market Y-o-Y Growth (%) Projections by End-Use Industry, 2023 to 2033

Figure 45: North America Market Attractiveness by Material, 2023 to 2033

Figure 46: North America Market Attractiveness by Application, 2023 to 2033

Figure 47: North America Market Attractiveness by End-Use Industry, 2023 to 2033

Figure 48: North America Market Attractiveness by Country, 2023 to 2033

Figure 49: Latin America Market Value (US$ Million) by Material, 2023 to 2033

Figure 50: Latin America Market Value (US$ Million) by Application, 2023 to 2033

Figure 51: Latin America Market Value (US$ Million) by End-Use Industry, 2023 to 2033

Figure 52: Latin America Market Value (US$ Million) by Country, 2023 to 2033

Figure 53: Latin America Market Value (US$ Million) Analysis by Country, 2018 to 2033

Figure 54: Latin America Market Volume (Units) Analysis by Country, 2018 to 2033

Figure 55: Latin America Market Value Share (%) and BPS Analysis by Country, 2023 to 2033

Figure 56: Latin America Market Y-o-Y Growth (%) Projections by Country, 2023 to 2033

Figure 57: Latin America Market Value (US$ Million) Analysis by Material, 2018 to 2033

Figure 58: Latin America Market Volume (Units) Analysis by Material, 2018 to 2033

Figure 59: Latin America Market Value Share (%) and BPS Analysis by Material, 2023 to 2033

Figure 60: Latin America Market Y-o-Y Growth (%) Projections by Material, 2023 to 2033

Figure 61: Latin America Market Value (US$ Million) Analysis by Application, 2018 to 2033

Figure 62: Latin America Market Volume (Units) Analysis by Application, 2018 to 2033

Figure 63: Latin America Market Value Share (%) and BPS Analysis by Application, 2023 to 2033

Figure 64: Latin America Market Y-o-Y Growth (%) Projections by Application, 2023 to 2033

Figure 65: Latin America Market Value (US$ Million) Analysis by End-Use Industry, 2018 to 2033

Figure 66: Latin America Market Volume (Units) Analysis by End-Use Industry, 2018 to 2033

Figure 67: Latin America Market Value Share (%) and BPS Analysis by End-Use Industry, 2023 to 2033

Figure 68: Latin America Market Y-o-Y Growth (%) Projections by End-Use Industry, 2023 to 2033

Figure 69: Latin America Market Attractiveness by Material, 2023 to 2033

Figure 70: Latin America Market Attractiveness by Application, 2023 to 2033

Figure 71: Latin America Market Attractiveness by End-Use Industry, 2023 to 2033

Figure 72: Latin America Market Attractiveness by Country, 2023 to 2033

Figure 73: Western Europe Market Value (US$ Million) by Material, 2023 to 2033

Figure 74: Western Europe Market Value (US$ Million) by Application, 2023 to 2033

Figure 75: Western Europe Market Value (US$ Million) by End-Use Industry, 2023 to 2033

Figure 76: Western Europe Market Value (US$ Million) by Country, 2023 to 2033

Figure 77: Western Europe Market Value (US$ Million) Analysis by Country, 2018 to 2033

Figure 78: Western Europe Market Volume (Units) Analysis by Country, 2018 to 2033

Figure 79: Western Europe Market Value Share (%) and BPS Analysis by Country, 2023 to 2033

Figure 80: Western Europe Market Y-o-Y Growth (%) Projections by Country, 2023 to 2033

Figure 81: Western Europe Market Value (US$ Million) Analysis by Material, 2018 to 2033

Figure 82: Western Europe Market Volume (Units) Analysis by Material, 2018 to 2033

Figure 83: Western Europe Market Value Share (%) and BPS Analysis by Material, 2023 to 2033

Figure 84: Western Europe Market Y-o-Y Growth (%) Projections by Material, 2023 to 2033

Figure 85: Western Europe Market Value (US$ Million) Analysis by Application, 2018 to 2033

Figure 86: Western Europe Market Volume (Units) Analysis by Application, 2018 to 2033

Figure 87: Western Europe Market Value Share (%) and BPS Analysis by Application, 2023 to 2033

Figure 88: Western Europe Market Y-o-Y Growth (%) Projections by Application, 2023 to 2033

Figure 89: Western Europe Market Value (US$ Million) Analysis by End-Use Industry, 2018 to 2033

Figure 90: Western Europe Market Volume (Units) Analysis by End-Use Industry, 2018 to 2033

Figure 91: Western Europe Market Value Share (%) and BPS Analysis by End-Use Industry, 2023 to 2033

Figure 92: Western Europe Market Y-o-Y Growth (%) Projections by End-Use Industry, 2023 to 2033

Figure 93: Western Europe Market Attractiveness by Material, 2023 to 2033

Figure 94: Western Europe Market Attractiveness by Application, 2023 to 2033

Figure 95: Western Europe Market Attractiveness by End-Use Industry, 2023 to 2033

Figure 96: Western Europe Market Attractiveness by Country, 2023 to 2033

Figure 97: Eastern Europe Market Value (US$ Million) by Material, 2023 to 2033

Figure 98: Eastern Europe Market Value (US$ Million) by Application, 2023 to 2033

Figure 99: Eastern Europe Market Value (US$ Million) by End-Use Industry, 2023 to 2033

Figure 100: Eastern Europe Market Value (US$ Million) by Country, 2023 to 2033

Figure 101: Eastern Europe Market Value (US$ Million) Analysis by Country, 2018 to 2033

Figure 102: Eastern Europe Market Volume (Units) Analysis by Country, 2018 to 2033

Figure 103: Eastern Europe Market Value Share (%) and BPS Analysis by Country, 2023 to 2033

Figure 104: Eastern Europe Market Y-o-Y Growth (%) Projections by Country, 2023 to 2033

Figure 105: Eastern Europe Market Value (US$ Million) Analysis by Material, 2018 to 2033

Figure 106: Eastern Europe Market Volume (Units) Analysis by Material, 2018 to 2033

Figure 107: Eastern Europe Market Value Share (%) and BPS Analysis by Material, 2023 to 2033

Figure 108: Eastern Europe Market Y-o-Y Growth (%) Projections by Material, 2023 to 2033

Figure 109: Eastern Europe Market Value (US$ Million) Analysis by Application, 2018 to 2033

Figure 110: Eastern Europe Market Volume (Units) Analysis by Application, 2018 to 2033

Figure 111: Eastern Europe Market Value Share (%) and BPS Analysis by Application, 2023 to 2033

Figure 112: Eastern Europe Market Y-o-Y Growth (%) Projections by Application, 2023 to 2033

Figure 113: Eastern Europe Market Value (US$ Million) Analysis by End-Use Industry, 2018 to 2033

Figure 114: Eastern Europe Market Volume (Units) Analysis by End-Use Industry, 2018 to 2033

Figure 115: Eastern Europe Market Value Share (%) and BPS Analysis by End-Use Industry, 2023 to 2033

Figure 116: Eastern Europe Market Y-o-Y Growth (%) Projections by End-Use Industry, 2023 to 2033

Figure 117: Eastern Europe Market Attractiveness by Material, 2023 to 2033

Figure 118: Eastern Europe Market Attractiveness by Application, 2023 to 2033

Figure 119: Eastern Europe Market Attractiveness by End-Use Industry, 2023 to 2033

Figure 120: Eastern Europe Market Attractiveness by Country, 2023 to 2033

Figure 121: South Asia and Pacific Market Value (US$ Million) by Material, 2023 to 2033

Figure 122: South Asia and Pacific Market Value (US$ Million) by Application, 2023 to 2033

Figure 123: South Asia and Pacific Market Value (US$ Million) by End-Use Industry, 2023 to 2033

Figure 124: South Asia and Pacific Market Value (US$ Million) by Country, 2023 to 2033

Figure 125: South Asia and Pacific Market Value (US$ Million) Analysis by Country, 2018 to 2033

Figure 126: South Asia and Pacific Market Volume (Units) Analysis by Country, 2018 to 2033

Figure 127: South Asia and Pacific Market Value Share (%) and BPS Analysis by Country, 2023 to 2033

Figure 128: South Asia and Pacific Market Y-o-Y Growth (%) Projections by Country, 2023 to 2033

Figure 129: South Asia and Pacific Market Value (US$ Million) Analysis by Material, 2018 to 2033

Figure 130: South Asia and Pacific Market Volume (Units) Analysis by Material, 2018 to 2033

Figure 131: South Asia and Pacific Market Value Share (%) and BPS Analysis by Material, 2023 to 2033

Figure 132: South Asia and Pacific Market Y-o-Y Growth (%) Projections by Material, 2023 to 2033

Figure 133: South Asia and Pacific Market Value (US$ Million) Analysis by Application, 2018 to 2033

Figure 134: South Asia and Pacific Market Volume (Units) Analysis by Application, 2018 to 2033

Figure 135: South Asia and Pacific Market Value Share (%) and BPS Analysis by Application, 2023 to 2033

Figure 136: South Asia and Pacific Market Y-o-Y Growth (%) Projections by Application, 2023 to 2033

Figure 137: South Asia and Pacific Market Value (US$ Million) Analysis by End-Use Industry, 2018 to 2033

Figure 138: South Asia and Pacific Market Volume (Units) Analysis by End-Use Industry, 2018 to 2033

Figure 139: South Asia and Pacific Market Value Share (%) and BPS Analysis by End-Use Industry, 2023 to 2033

Figure 140: South Asia and Pacific Market Y-o-Y Growth (%) Projections by End-Use Industry, 2023 to 2033

Figure 141: South Asia and Pacific Market Attractiveness by Material, 2023 to 2033

Figure 142: South Asia and Pacific Market Attractiveness by Application, 2023 to 2033

Figure 143: South Asia and Pacific Market Attractiveness by End-Use Industry, 2023 to 2033

Figure 144: South Asia and Pacific Market Attractiveness by Country, 2023 to 2033

Figure 145: East Asia Market Value (US$ Million) by Material, 2023 to 2033

Figure 146: East Asia Market Value (US$ Million) by Application, 2023 to 2033

Figure 147: East Asia Market Value (US$ Million) by End-Use Industry, 2023 to 2033

Figure 148: East Asia Market Value (US$ Million) by Country, 2023 to 2033

Figure 149: East Asia Market Value (US$ Million) Analysis by Country, 2018 to 2033

Figure 150: East Asia Market Volume (Units) Analysis by Country, 2018 to 2033

Figure 151: East Asia Market Value Share (%) and BPS Analysis by Country, 2023 to 2033

Figure 152: East Asia Market Y-o-Y Growth (%) Projections by Country, 2023 to 2033

Figure 153: East Asia Market Value (US$ Million) Analysis by Material, 2018 to 2033

Figure 154: East Asia Market Volume (Units) Analysis by Material, 2018 to 2033

Figure 155: East Asia Market Value Share (%) and BPS Analysis by Material, 2023 to 2033

Figure 156: East Asia Market Y-o-Y Growth (%) Projections by Material, 2023 to 2033

Figure 157: East Asia Market Value (US$ Million) Analysis by Application, 2018 to 2033

Figure 158: East Asia Market Volume (Units) Analysis by Application, 2018 to 2033

Figure 159: East Asia Market Value Share (%) and BPS Analysis by Application, 2023 to 2033

Figure 160: East Asia Market Y-o-Y Growth (%) Projections by Application, 2023 to 2033

Figure 161: East Asia Market Value (US$ Million) Analysis by End-Use Industry, 2018 to 2033

Figure 162: East Asia Market Volume (Units) Analysis by End-Use Industry, 2018 to 2033

Figure 163: East Asia Market Value Share (%) and BPS Analysis by End-Use Industry, 2023 to 2033

Figure 164: East Asia Market Y-o-Y Growth (%) Projections by End-Use Industry, 2023 to 2033

Figure 165: East Asia Market Attractiveness by Material, 2023 to 2033

Figure 166: East Asia Market Attractiveness by Application, 2023 to 2033

Figure 167: East Asia Market Attractiveness by End-Use Industry, 2023 to 2033

Figure 168: East Asia Market Attractiveness by Country, 2023 to 2033

Figure 169: Middle East and Africa Market Value (US$ Million) by Material, 2023 to 2033

Figure 170: Middle East and Africa Market Value (US$ Million) by Application, 2023 to 2033

Figure 171: Middle East and Africa Market Value (US$ Million) by End-Use Industry, 2023 to 2033

Figure 172: Middle East and Africa Market Value (US$ Million) by Country, 2023 to 2033

Figure 173: Middle East and Africa Market Value (US$ Million) Analysis by Country, 2018 to 2033

Figure 174: Middle East and Africa Market Volume (Units) Analysis by Country, 2018 to 2033

Figure 175: Middle East and Africa Market Value Share (%) and BPS Analysis by Country, 2023 to 2033

Figure 176: Middle East and Africa Market Y-o-Y Growth (%) Projections by Country, 2023 to 2033

Figure 177: Middle East and Africa Market Value (US$ Million) Analysis by Material, 2018 to 2033

Figure 178: Middle East and Africa Market Volume (Units) Analysis by Material, 2018 to 2033

Figure 179: Middle East and Africa Market Value Share (%) and BPS Analysis by Material, 2023 to 2033

Figure 180: Middle East and Africa Market Y-o-Y Growth (%) Projections by Material, 2023 to 2033

Figure 181: Middle East and Africa Market Value (US$ Million) Analysis by Application, 2018 to 2033

Figure 182: Middle East and Africa Market Volume (Units) Analysis by Application, 2018 to 2033

Figure 183: Middle East and Africa Market Value Share (%) and BPS Analysis by Application, 2023 to 2033

Figure 184: Middle East and Africa Market Y-o-Y Growth (%) Projections by Application, 2023 to 2033

Figure 185: Middle East and Africa Market Value (US$ Million) Analysis by End-Use Industry, 2018 to 2033

Figure 186: Middle East and Africa Market Volume (Units) Analysis by End-Use Industry, 2018 to 2033

Figure 187: Middle East and Africa Market Value Share (%) and BPS Analysis by End-Use Industry, 2023 to 2033

Figure 188: Middle East and Africa Market Y-o-Y Growth (%) Projections by End-Use Industry, 2023 to 2033

Figure 189: Middle East and Africa Market Attractiveness by Material, 2023 to 2033

Figure 190: Middle East and Africa Market Attractiveness by Application, 2023 to 2033

Figure 191: Middle East and Africa Market Attractiveness by End-Use Industry, 2023 to 2033

Figure 192: Middle East and Africa Market Attractiveness by Country, 2023 to 2033

Recommendations

Packaging

Egg Carton Market

Published : March 2024

Packaging

Fluted Carton Trays Market

Published : March 2023

Packaging

Tetrahedron Carton Market

Published : February 2023

Packaging

Carton Sealer Machine Market

Published : September 2022

Explore Packaging Insights

View Reports