Cavendish Banana Market Forecast and Outlook 2025 to 2035 

The Cavendish banana market is estimated to be valued at USD 18.8 billion in 2025 and is projected to reach USD 28.6 billion by 2035, registering a compound annual growth rate (CAGR) of 4.3% over the forecast period.
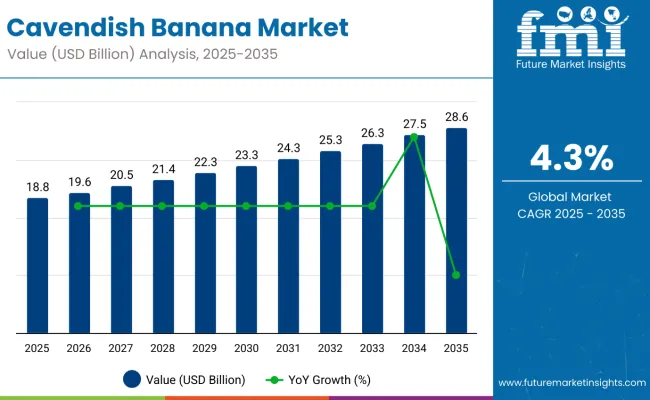
Quick Stats for Cavendish Banana Market

  • Cavendish Banana Market Value (2025): USD 18.8 billion
  • Cavendish Banana Market Forecast Value (2035): USD 28.6 billion
  • Cavendish Banana Market Forecast CAGR: 4.3%
  • Leading Segment in Cavendish Banana Market in 2025: Food and Beverage Processing (38%)
  • Key Growth Regions in Cavendish Banana Market: Asia-Pacific, North America, and Europe
  • Key Players in Cavendish Banana Market: Dole Food Company, Chiquita Brands International Sàrl, Fresh Del Monte Produce, GinaFruit S.A., and Agro export Carmita

Cavendish Banana Market

Metric Value
Estimated Value in 2025 (E) USD 18.8 billion
Forecast Value in 2035 (F) USD 28.6 billion
Forecast CAGR (2025 to 2035) 4.3%

The market is expected to add an absolute dollar opportunity of USD 9.8 billion during this period. This reflects a 1.52 times growth at a compound annual growth rate of 4.3%.The market evolution is expected to be shaped by increasing consumer awareness of health and wellness, as well as the rising popularity of organic banana varieties. The market benefits from Cavendish bananas being widely used as convenient, nutritious snacks and as key ingredients in diverse food and beverage products.

By 2030, the market is likely to reach USD 23.7 billion, adding about USD 4.9 billion in incremental value during the first half of the decade. The remaining USD 4.9 billion is expected during the second half, indicating a balanced growth pattern. Product innovation focused on disease-resistant cultivars and organic farming techniques is gaining traction due to growing consumer demand for sustainable, high-quality, and nutrient-rich bananas. Additionally, advances in supply chain technology and packaging are enhancing freshness and shelf life, supporting expanded market penetration globally.

Companies such as Dole Food Company continue to innovate and invest in disease-resistant banana cultivars and sustainable farming techniques. Moving forward, regulatory compliance, quality control, and technological advancements will shape competitive dynamics, ensuring that the Cavendish banana remains a leading tropical fruit commodity globally.

The market holds a strong position across its parent industries, reflecting its rising adoption in food, beverages, and export-oriented agriculture. Within the organic fruit market, Cavendish bananas account for around 35%, driven by rising consumer demand for pesticide-free and sustainably sourced produce. In the food and beverage processing segment, the market contributes nearly 38%, supported by its versatile use in smoothies, baked goods, dairy alternatives, and ready-to-eat products. In the retail fresh fruit market, it holds close to 30%, where its convenience and nutritional benefits strengthen consumer preference. Within the broader tropical fruit market, Cavendish bananas represent about 25%, underscoring their role as a staple fruit across global regions.

Growth is being driven by innovations such as disease-resistant banana cultivars, which improve yield and supply stability. Producers are expanding organic and fair trade offerings, supported by sustainable farming practices. Collaborations with foodservice providers, retailers, and the growth of online grocery platforms are widening market reach and reshaping distribution channels, challenging traditional fruit consumption patterns and increasing year-round availability

Why is the Cavendish Banana Market Growing?

Cavendish bananas’ unique combination of affordability, consistent availability, and strong nutritional value is driving their adoption across global markets. Their rich potassium, fiber, and vitamin content makes them indispensable as a staple fruit, while convenience and year-round supply support demand in both fresh consumption and processed food categories.

Rising demand for organic and sustainably sourced produce is further propelling market growth, supported by increasing health consciousness, urbanization, and consumer preference for clean-label and pesticide-free fruits. Their versatility in smoothies, baked goods, dairy alternatives, and ready-to-eat products enhances their value in the food and beverage processing industry.

Expanding retail networks, supermarket penetration, and e-commerce platforms are strengthening market accessibility, while growing export trade ensures wider global reach. As consumers prioritize nutrition, affordability, and convenience, Cavendish bananas continue to dominate the tropical fruit segment. With producers focusing on quality, sustainability, and global supply chain efficiency, the market is set to witness steady expansion in the coming years.

Cavendish Banana Market Analysis by Top Investment Segments

The market is segmented by product type, application, sales channel, and region. By product type, the market is categorized into organic Cavendish banana, conventional Cavendish banana, organic fair trade Cavendish banana, and conventional fair trade Cavendish banana. Based on application, the market is segmented into food and beverage processing, cosmetic and personal care, pharmaceutical and supplements, animal feed, foodservice (HoReCa), household (retail), and others. In terms of sales channel, the market is bifurcated into direct sales, retail sales (modern trade, convenience store, departmental store, online retailers, traditional grocery store, and other sales channels). Regionally, the market spans across North America, Latin America, Europe, Asia Pacific, and the Middle East & Africa (MEA).
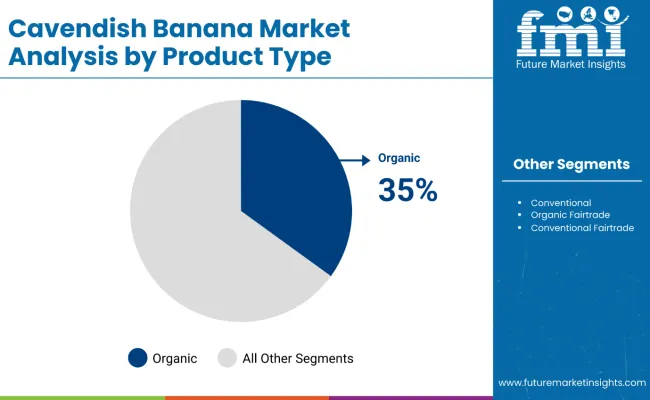
By Product Type, Organic Cavendish Banana Accounts for 35% of the Market Share

Cavendish Banana Market By Product

The organic Cavendish banana segment is poised to maintain strong growth, with an estimated market share of around 35%, making it the leading product type in the growing market. The organic Cavendish banana segment represents a rapidly growing portion of the market, driven by increasing consumer awareness of health, sustainability, and environmental concerns. Organic bananas are cultivated without synthetic pesticides, herbicides, or genetically modified organisms, appealing to health-conscious buyers who prioritize natural and chemical-free foods. This segment’s growth is fueled by a global shift toward organic produce, supported by favorable government policies and certifications that assure quality and authenticity.

Consumers value organic Cavendish bananas for their perceived nutritional benefits and contribution to sustainable farming practices, including reduced soil degradation and biodiversity preservation. Retailers and foodservice providers are expanding their organic offerings, enhancing availability in supermarkets, online platforms, and specialty stores. Additionally, organic bananas are integrated into premium food and beverage products targeting niche markets.
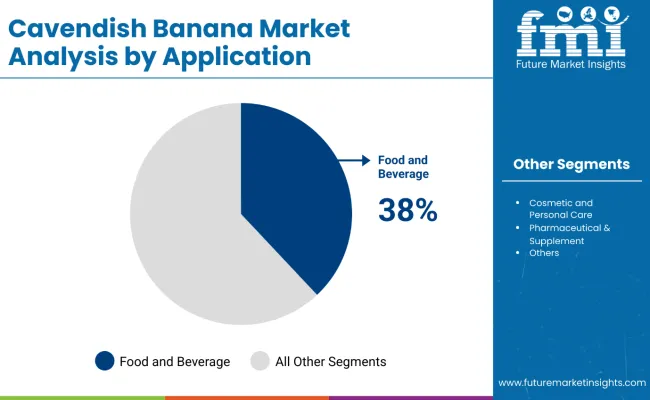
By Application, Food and Beverage Processing Accounts for 38% of the Market Share

Cavendish Banana Market By Application

The food and beverage processing segment is the largest and most significant application within the market, accounting for 38% of the market share. This segment’s growth is driven by the versatile use of Cavendish bananas as a key ingredient in a wide range of food and beverage products. Bananas are commonly incorporated into smoothies, fruit juices, baked goods such as banana bread and muffins, dairy alternatives like banana-flavored yogurts, and energy bars.

Their natural sweetness, nutritional benefits, and consumer preference for convenient, healthy products boost demand in this segment. The segment also benefits from innovations like ready-to-drink beverages and baby foods containing banana puree. Additionally, the rise of the health and wellness trend globally encourages manufacturers to create nutrient-rich products that include Cavendish bananas. Food and beverage processing remains pivotal in expanding the market’s reach across retail, foodservice, and online channels, reinforcing its position as the leading application segment in the market.

What are the Drivers, Restraints, and Key Trends of the Cavendish Banana Market?

From 2025 to 2035, rising consumer demand for healthy, organic, and sustainably sourced fruits is driving significant growth in the market. Increasing preference for organic Cavendish bananas and their incorporation into fortified and convenience foods has positioned producers investing in disease-resistant cultivars and sustainable farming practices as key players in meeting evolving consumer needs and expanding product offerings.

Growing Consumer Health Awareness Drives Market Growth

The steady rise in consumer focus on wellness, natural foods, and nutritional value is a primary catalyst for growth in the market. Increased demand for organic and fresh bananas as a convenient, nutrient-rich snack is fueling the expansion. By 2025, producers are expected to improve quality through sustainable cultivation and supply chain innovations to meet consumer expectations for freshness and safety.

Innovation in Product Development Expands Market Opportunities

Recent innovations in cultivation, organic certification, and supply chain management have expanded the market’s reach beyond traditional fresh produce. These advancements enable improved disease resistance, extended shelf life, and consistent quality, creating new opportunities in retail, foodservice, and processed food sectors. Producers adopting sustainable practices and certifications cater to environmentally conscious consumers, reinforcing long-term market growth.
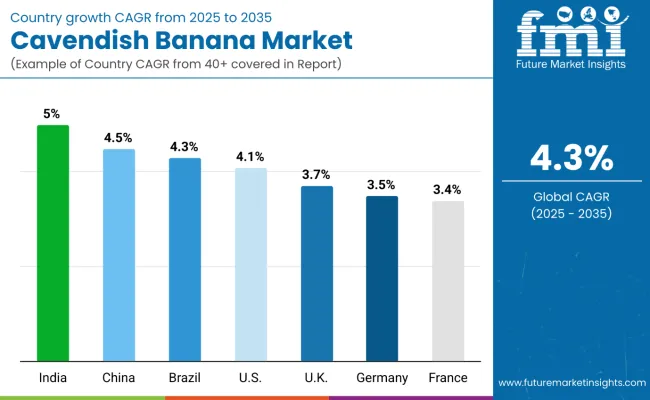
Cavendish Banana Market Analysis by Key Countries

Cavendish Banana Market By Country

Countries CAGR (%)
India 5.0
China 4.5
Brazil 4.3
USA 4.1
UK 3.7
Germany 3.5
France 3.4

The market shows diverse growth rates among key countries. India leads with a remarkable 5% CAGR, driven by large-scale production and government support for sustainable farming. China follows with 4.5%, fueled by rising urbanization and organic cultivation. Brazil’s market grows at 4.3%, supported by strong local production and expanding retail channels. The USA sees 4.1% growth, propelled by imports and health-conscious consumers. The UK and Germany have moderate growth at 3.7% and 3.5%, focusing on organic and fair trade bananas. France grows steadily at 3.4%, driven by environmental awareness and organic product demand. India holds leadership due to its dominant role in cultivation and exports.

The report covers an in-depth analysis of 40+ countries; seven top-performing OECD countries are highlighted below.

Production Capacity Trends in Cavendish Banana Market in India

The Cavendish banana market in India is expected to expand at a CAGR of 5% from 2025 to 2035, due to its status as the world’s largest banana producer. The country is investing heavily in sustainable and organic cultivation practices, supported by strong government initiatives aimed at boosting exports and modernizing agriculture. Expansion of cold chain infrastructure and supply networks improves banana freshness and market reach both domestically and internationally.

Increasing urbanization and health awareness among consumers are driving demand for organic and fair trade bananas. Online and modern retail channels are growing rapidly, making Cavendish bananas more accessible. Challenges such as disease control are addressed through research and innovation, enhancing yield and quality. This combination of factors positions India as a leading market in cultivation, export, and consumption.

  • Expansion of cold chain and supply chain infrastructure
  • Robust government initiatives supporting exports and modern agriculture
  • Ongoing research and innovation in disease-resistant and high-yield cultivars

Growth Outlook of the Cavendish Banana Market in China

Revenue from Cavendish banana in China is expected to grow at a CAGR of 4.5% from 2025 to 2035, driven by increasing urbanization and rising disposable incomes. Domestic consumption is supplemented by growing imports to satisfy healthy eating trends. Organic banana cultivation is gaining traction as consumer demand shifts toward natural, pesticide-free produce. Investments in cold storage, supply chain logistics, and quality control are supporting year-round availability and better product consistency.

Retail expansion through supermarkets, convenience stores, and online platforms is making bananas more accessible. The government is encouraging sustainable agriculture practices, aligning with environmental policies. Market players focus on enhancing processing and packaging innovations to cater to evolving consumer preferences. Overall, China’s market reflects balanced growth with increased production, imports, and consumption.

  • Rising demand from middle-class consumer base
  • Higher import values to bridge domestic supply gap
  • Expansion of farmland dedicated to organic cultivation

Dynamics of the Cavendish Banana Market in Brazil

Revenue from Cavendish banana in Brazil is expected to grow at a 4.3% CAGR from 2025 to 2035, driven by strong local production and expanding domestic demand. Research initiatives focused on disease resistance and yield improvement are enhancing production efficiency. The expanding urban middle class and rising health awareness promote higher banana consumption in both retail and foodservice sectors.

Modern retail channels such as supermarkets and online stores are growing, improving accessibility for consumers. Foodservice adoption of banana-based products is also increasing, supported by convenience and nutrition trends. Sustainability practices and quality control measures are gaining importance to meet market demands. Brazil plays a crucial role as a producer and consumer in the global banana landscape.
  • Rising urban and middle-class demand
  • Widening presence across retail and online channels
  • Rising adoption in foodservice channels

Expansion of Cavendish Banana Market in the USA

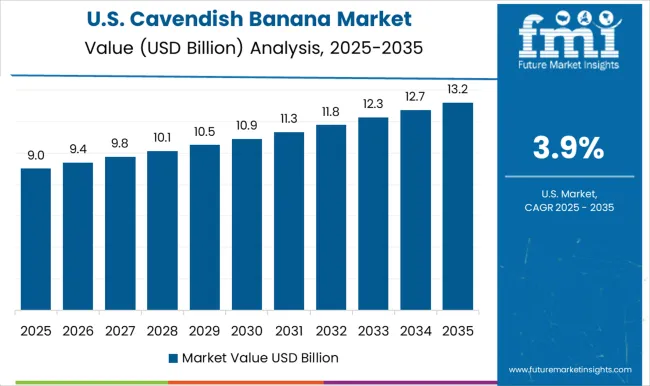
Demand for Cavendish banana in the USA is projected to grow at a CAGR of 4.1% from 2025 to 2035, driven by a health-conscious consumer base seeking organic and fresh produce. Imports primarily from Latin America ensure consistent supply throughout the year. Foodservice providers and retailers are adopting innovative banana-based products, including smoothies, snacks, and ready-to-eat foods.

The growth of online grocery platforms has further boosted availability and convenience. Consumers increasingly favor nutrient-rich and convenient foods, aligning with wellness trends. Import infrastructure and cold chain logistics continue to improve, supporting market expansion. Industry players are also investing in sustainable sourcing and certifications to meet ethical demands.

  • Rising preference for organic and fresh bananas
  • Strong import volume from Latin America
  • Rising adoption in the foodservice sector

Development Trends in Cavendish Banana Market in the UK

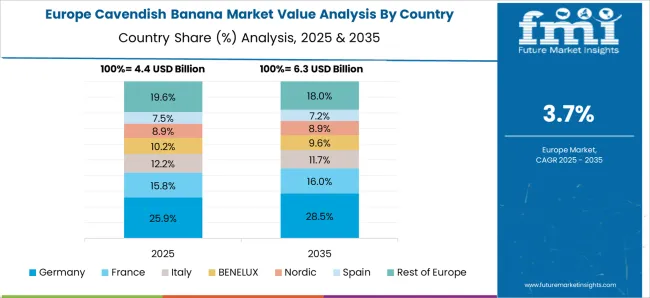
Sales of Cavendish banana in the UK are expected to grow at a CAGR of 3.7% from 2025 to 2035, driven by strong consumer interest in organic and ethically sourced fruit. British consumers prioritize health, convenience, and sustainable sourcing when purchasing bananas. Retailers are actively promoting organic products through certification labels and targeted marketing campaigns. The rise of online supermarkets and quick-delivery services is enhancing product accessibility.

Foodservice businesses are increasingly featuring bananas in nutritious and ready-to-eat options for the growing on-the-go consumer base. Efforts to reduce environmental impact through improved supply chain practices support market growth. The UK market reflects a blend of evolving consumer preferences and retail innovation.
  • Strong consumer preference for organic bananas
  • Certification and sustainability-driven marketing
  • Growth in online sales and quick delivery

Germany Cavendish Banana Market Outlook

Sales of Cavendish banana in Germany are expected to grow at a CAGR of 3.5% from 2025 to 2035, driven by increasing consumer preference for sustainably sourced fruits and rising health consciousness promoting higher fruit intake. Sensitivity to sustainability and ethical sourcing fuels demand among environmentally conscious consumers. The country benefits from well-established retail chains and rapidly growing e-commerce platforms facilitating broad distribution.

Stringent regulatory standards ensure product quality, safety, and traceability, reinforcing consumer trust. Foodservice sectors increasingly feature organic bananas in their offerings, aligning with health trends. Retailers actively promote organic products through certifications and marketing. Efforts toward reducing carbon footprints in supply chains are shaping competitive strategies. Growth in Germany is steady, supported by consumer preferences for quality and responsibility.

  • High demand for organic and fair trade bananas
  • Focus on sustainability and regulatory compliance
  • Emphasis on supply chain transparency and ethics

Clean-Label Demand of the Cavendish Banana Market in France

The Cavendish banana market in France is expected to grow at a CAGR of 3.4% from 2025 to 2035, supported by increasing consumer demand for organic and fair trade bananas. French consumers show strong preference for sustainably sourced and high-quality fresh produce, reflecting awareness of the environment and lifestyle health trends. Retailers are expanding organic product ranges in supermarkets and specialty stores, while online grocery shopping is gaining traction.

Foodservice providers incorporate bananas into health-focused menus and snacks. Strict regulatory frameworks ensure product safety, quality, and traceability. The market benefits from collaborations between growers, distributors, and retailers focused on sustainability certifications and carbon footprint reduction. These efforts create a steady growth environment aligned with consumer expectations.
  • Growing demand for organic and fair trade produce
  • Expansion of organic product lines in retail
  • Growth in digital grocery purchases

Competitive Landscape of Cavendish Banana Market

Cavendish Banana Market By Company

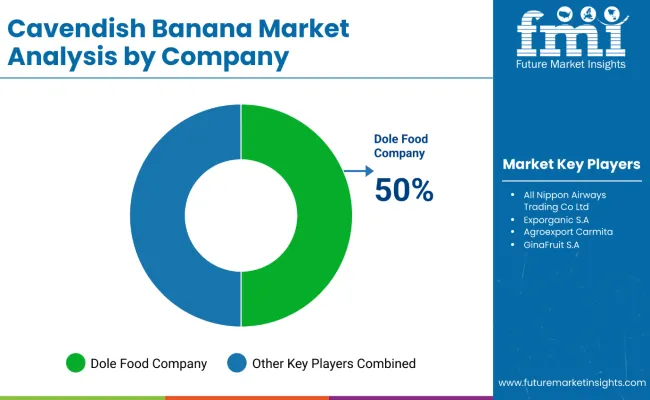
The market is moderately consolidated, with key players differentiating themselves through cultivation expertise, product innovation, and strong regional presence. Dole Food Company holds a significant market share of 50%, reflecting its strong global footprint and extensive distribution network. Leading companies such as Dole Food Company and Chiquita Brands International dominate through large-scale production capabilities and diverse product offerings, including organic, fair trade, and conventional bananas catering to both retail and foodservice sectors. Their strengths lie in sustainable farming practices, disease-resistant cultivar development, quality control, and extensive global distribution networks.

Mid-sized and regional players focus on local sourcing, organic certification, and product customization to serve niche markets, particularly in Asia-Pacific and Latin America. Barriers to entry are moderate due to the need for advanced agricultural techniques, compliance with quality and safety standards, and sustainable sourcing. Competitiveness hinges on innovation in cultivation, environmental sustainability initiatives, and the ability to adapt to shifting consumer preferences and regulatory landscapes across diverse regions.

Report Scope - Cavendish Banana Market

Items Values
Quantitative Units (2025) USD 18.8 Billion
Product Type Organic Cavendish Banana, Conventional Cavendish Banana, Organic Fairtrade Cavendish Banana, and Conventional Fairtrade Cavendish Banana
Application Food and Beverage Processing, Cosmetic and Personal Care, Pharmaceutical & Supplements, Animal Feed, Foodservice (HoReCa), Household (Retail), and Others (Industrial uses, by-products)
Sales Channel Direct Sales, Retail Sales (Modern Trade, Convenience Stores, Departmental Stores, Online Retailers, Traditional Grocery Stores, and Other Sales Channels.
Regions Covered North America, Latin America, Europe, Asia Pacific, and Middle East & Africa
Countries Covered United States, Canada, United Kingdom, Germany, France, China, Japan, South Korea, Brazil, Australia and 40+ countries
Key Companies Profiled All Nippon Airways Trading Co Ltd., Exporganic S.A., DISCOVERY ORGANICS, Salix Fruits, Agroexport Carmita, Union de Bananeros de Uraba, GinaFruit S.A., Chiquita Brands International Sàrl, Dole Food Company, Fresh Del Monte Produce Incorporated, Pisum Food Services Private Limited, Reybanpac, and Rey Banano del Pacífico C.A.
Additional Attributes Dollar sales by product type, application, and sales channel, regional demand trends, competitive landscape, consumer preferences for organic versus conventional alternatives, integration with responsible sourcing practices, innovations in processing technology, and quality standardization for diverse industrial applications

Key Segments

By Product:

  • Organic
  • Conventional
  • Organic
  • Conventional

By Application:

  • Food and Beverage Processing
  • Cosmetic and Personal Care
  • Pharmaceutical & Supplements
  • Animal Feed
  • Foodservice (HoReCa)
  • Household (Retail)
  • Others

By Sales Channel:

  • Direct Sales
  • Retail Sales
  • Modern Trade
  • Convenience Store
  • Departmental Store
  • Online Retailers
  • Traditional Grocery Store
  • Other Sales Channels

By Region:

  • North America
  • Latin America
  • Europe
  • Asia Pacific
  • Middle East and Africa

Table of Content

  1. Executive Summary
    • Global Market Outlook
    • Demand-side Trends
    • Supply-side Trends
    • Technology Roadmap Analysis
    • Analysis and Recommendations
  2. Market Overview
    • Market Coverage / Taxonomy
    • Market Definition / Scope / Limitations
  3. Market Background
    • Market Dynamics
      • Drivers
      • Restraints
      • Opportunity
      • Trends
    • Scenario Forecast
      • Demand in Optimistic Scenario
      • Demand in Likely Scenario
      • Demand in Conservative Scenario
    • Opportunity Map Analysis
    • Product Life Cycle Analysis
    • Supply Chain Analysis
      • Supply Side Participants and their Roles
        • Producers
        • Mid-Level Participants (Traders/ Agents/ Brokers)
        • Wholesalers and Distributors
      • Value Added and Value Created at Node in the Supply Chain
      • List of Raw Material Suppliers
      • List of Existing and Potential Buyer’s
    • Investment Feasibility Matrix
    • Value Chain Analysis
      • Profit Margin Analysis
      • Wholesalers and Distributors
      • Retailers
    • PESTLE and Porter’s Analysis
    • Regulatory Landscape
      • By Key Regions
      • By Key Countries
    • Regional Parent Market Outlook
    • Production and Consumption Statistics
    • Import and Export Statistics
  4. Global Market Analysis 2020 to 2024 and Forecast, 2025 to 2035
    • Historical Market Size Value (USD Billion) & Volume (Metric Tons) Analysis, 2020 to 2024
    • Current and Future Market Size Value (USD Billion) & Volume (Metric Tons) Projections, 2025 to 2035
      • Y-o-Y Growth Trend Analysis
      • Absolute $ Opportunity Analysis
  5. Global Market Pricing Analysis 2020 to 2024 and Forecast 2025 to 2035
  6. Global Market Analysis 2020 to 2024 and Forecast 2025 to 2035, By Product Type
    • Introduction / Key Findings
    • Historical Market Size Value (USD Billion) & Volume (Metric Tons) Analysis By Product Type, 2020 to 2024
    • Current and Future Market Size Value (USD Billion) & Volume (Metric Tons) Analysis and Forecast By Product Type, 2025 to 2035
      • Organic
      • Conventional
      • Organic Fairtrade
      • Conventional Fairtrade
    • Y-o-Y Growth Trend Analysis By Product Type, 2020 to 2024
    • Absolute $ Opportunity Analysis By Product Type, 2025 to 2035
  7. Global Market Analysis 2020 to 2024 and Forecast 2025 to 2035, By Application
    • Introduction / Key Findings
    • Historical Market Size Value (USD Billion) & Volume (Metric Tons) Analysis By Application, 2020 to 2024
    • Current and Future Market Size Value (USD Billion) & Volume (Metric Tons) Analysis and Forecast By Application, 2025 to 2035
      • Food and Beverage Processing
      • Cosmetic and Personal Care
      • Pharmaceutical & Supplements
      • Animal Feed
      • Foodservice (HoReCa)
      • Household (Retail)
      • Others
    • Y-o-Y Growth Trend Analysis By Application, 2020 to 2024
    • Absolute $ Opportunity Analysis By Application, 2025 to 2035
  8. Global Market Analysis 2020 to 2024 and Forecast 2025 to 2035, By Sales Channel
    • Introduction / Key Findings
    • Historical Market Size Value (USD Billion) & Volume (Metric Tons) Analysis By Sales Channel, 2020 to 2024
    • Current and Future Market Size Value (USD Billion) & Volume (Metric Tons) Analysis and Forecast By Sales Channel, 2025 to 2035
      • Direct Sales
      • Retail Sales
        • Modern Trade
        • Convenience Store
        • Departmental Store
        • Online Retailers
        • Traditional Grocery Store
        • Other Sales Channel
    • Y-o-Y Growth Trend Analysis By Sales Channel, 2020 to 2024
    • Absolute $ Opportunity Analysis By Sales Channel, 2025 to 2035
  9. Global Market Analysis 2020 to 2024 and Forecast 2025 to 2035, By Region
    • Introduction
    • Historical Market Size Value (USD Billion) & Volume (Metric Tons) Analysis By Region, 2020 to 2024
    • Current Market Size Value (USD Billion) & Volume (Metric Tons) Analysis and Forecast By Region, 2025 to 2035
      • North America
      • Latin America
      • Western Europe
      • Eastern Europe
      • East Asia
      • South Asia & Pacific
      • Middle East and Africa
    • Market Attractiveness Analysis By Region
  10. North America Market Analysis 2020 to 2024 and Forecast 2025 to 2035, By Country
    • Historical Market Size Value (USD Billion) & Volume (Metric Tons) Trend Analysis By Market Taxonomy, 2020 to 2024
    • Market Size Value (USD Billion) & Volume (Metric Tons) Forecast By Market Taxonomy, 2025 to 2035
      • By Country
        • USA
        • Canada
        • Mexico
      • By Product Type
      • By Application
      • By Sales Channel
    • Market Attractiveness Analysis
      • By Country
      • By Product Type
      • By Application
      • By Sales Channel
    • Key Takeaways
  11. Latin America Market Analysis 2020 to 2024 and Forecast 2025 to 2035, By Country
    • Historical Market Size Value (USD Billion) & Volume (Metric Tons) Trend Analysis By Market Taxonomy, 2020 to 2024
    • Market Size Value (USD Billion) & Volume (Metric Tons) Forecast By Market Taxonomy, 2025 to 2035
      • By Country
        • Brazil
        • Argentina
        • Rest of LATAM
      • By Product Type
      • By Application
      • By Sales Channel
    • Market Attractiveness Analysis
      • By Country
      • By Product Type
      • By Application
      • By Sales Channel
    • Key Takeaways
  12. Western Europe Market Analysis 2020 to 2024 and Forecast 2025 to 2035, By Country
    • Historical Market Size Value (USD Billion) & Volume (Metric Tons) Trend Analysis By Market Taxonomy, 2020 to 2024
    • Market Size Value (USD Billion) & Volume (Metric Tons) Forecast By Market Taxonomy, 2025 to 2035
      • By Country
        • Germany
        • Italy
        • France
        • UK
        • Spain
        • BENELUX
        • Nordic
        • Rest of W.Europe
      • By Product Type
      • By Application
      • By Sales Channel
    • Market Attractiveness Analysis
      • By Country
      • By Product Type
      • By Application
      • By Sales Channel
    • Key Takeaways
  13. Eastern Europe Market Analysis 2020 to 2024 and Forecast 2025 to 2035, By Country
    • Historical Market Size Value (USD Billion) & Volume (Metric Tons) Trend Analysis By Market Taxonomy, 2020 to 2024
    • Market Size Value (USD Billion) & Volume (Metric Tons) Forecast By Market Taxonomy, 2025 to 2035
      • By Country
        • Russia
        • Hungary
        • Poland
        • Balkan & Baltics
        • Rest of E. Europe
      • By Product Type
      • By Application
      • By Sales Channel
    • Market Attractiveness Analysis
      • By Country
      • By Product Type
      • By Application
      • By Sales Channel
    • Key Takeaways
  14. East Asia Market Analysis 2020 to 2024 and Forecast 2025 to 2035, By Country
    • Historical Market Size Value (USD Billion) & Volume (Metric Tons) Trend Analysis By Market Taxonomy, 2020 to 2024
    • Market Size Value (USD Billion) & Volume (Metric Tons) Forecast By Market Taxonomy, 2025 to 2035
      • By Country
        • China
        • Japan
        • South Korea
      • By Product Type
      • By Application
      • By Sales Channel
    • Market Attractiveness Analysis
      • By Country
      • By Product Type
      • By Application
      • By Sales Channel
    • Key Takeaways
  15. South Asia & Pacific Market Analysis 2020 to 2024 and Forecast 2025 to 2035, By Country
    • Historical Market Size Value (USD Billion) & Volume (Metric Tons) Trend Analysis By Market Taxonomy, 2020 to 2024
    • Market Size Value (USD Billion) & Volume (Metric Tons) Forecast By Market Taxonomy, 2025 to 2035
      • By Country
        • India
        • Australia & New Zealand
        • ASEAN
        • Rest of SAP
      • By Product Type
      • By Application
      • By Sales Channel
    • Market Attractiveness Analysis
      • By Country
      • By Product Type
      • By Application
      • By Sales Channel
    • Key Takeaways
  16. Middle East and Africa Market Analysis 2020 to 2024 and Forecast 2025 to 2035, By Country
    • Historical Market Size Value (USD Billion) & Volume (Metric Tons) Trend Analysis By Market Taxonomy, 2020 to 2024
    • Market Size Value (USD Billion) & Volume (Metric Tons) Forecast By Market Taxonomy, 2025 to 2035
      • By Country
        • GCC Countries
        • Northern Africa
        • South Africa
        • Turkiye
        • Rest of MEA
      • By Product Type
      • By Application
      • By Sales Channel
    • Market Attractiveness Analysis
      • By Country
      • By Product Type
      • By Application
      • By Sales Channel
    • Key Takeaways
  17. Key Countries Market Analysis
    • USA
      • Pricing Analysis
      • Market Share Analysis, 2024
        • By Product Type
        • By Application
        • By Sales Channel
    • Canada
      • Pricing Analysis
      • Market Share Analysis, 2024
        • By Product Type
        • By Application
        • By Sales Channel
    • Brazil
      • Pricing Analysis
      • Market Share Analysis, 2024
        • By Product Type
        • By Application
        • By Sales Channel
    • Mexico
      • Pricing Analysis
      • Market Share Analysis, 2024
        • By Product Type
        • By Application
        • By Sales Channel
    • Argentina
      • Pricing Analysis
      • Market Share Analysis, 2024
        • By Product Type
        • By Application
        • By Sales Channel
  18. Market Structure Analysis
    • Competition Dashboard
    • Competition Benchmarking
    • Market Share Analysis of Top Players
      • By Regional
      • By Product Type
      • By Application
      • By Sales Channel
  19. Competition Analysis
    • Competition Deep Dive
      • All Nippon Airways Trading Co Ltd.
        • Overview
        • Product Portfolio
        • Profitability by Market Segments (Product/Age /Sales Channel/Region)
        • Sales Footprint
        • Strategy Overview
          • Marketing Strategy
          • Product Strategy
          • Channel Strategy
      • Exporganic S.A.
        • Overview
        • Product Portfolio
        • Profitability by Market Segments (Product/Age /Sales Channel/Region)
        • Sales Footprint
        • Strategy Overview
          • Marketing Strategy
          • Product Strategy
          • Channel Strategy
      • DISCOVERY ORGANICS
        • Overview
        • Product Portfolio
        • Profitability by Market Segments (Product/Age /Sales Channel/Region)
        • Sales Footprint
        • Strategy Overview
          • Marketing Strategy
          • Product Strategy
          • Channel Strategy
      • Salix Fruits
        • Overview
        • Product Portfolio
        • Profitability by Market Segments (Product/Age /Sales Channel/Region)
        • Sales Footprint
        • Strategy Overview
          • Marketing Strategy
          • Product Strategy
          • Channel Strategy
      • Agroexport Carmita
        • Overview
        • Product Portfolio
        • Profitability by Market Segments (Product/Age /Sales Channel/Region)
        • Sales Footprint
        • Strategy Overview
          • Marketing Strategy
          • Product Strategy
          • Channel Strategy
      • Union de Bananeros de Uraba
        • Overview
        • Product Portfolio
        • Profitability by Market Segments (Product/Age /Sales Channel/Region)
        • Sales Footprint
        • Strategy Overview
          • Marketing Strategy
          • Product Strategy
          • Channel Strategy
      • GinaFruit S.A.
        • Overview
        • Product Portfolio
        • Profitability by Market Segments (Product/Age /Sales Channel/Region)
        • Sales Footprint
        • Strategy Overview
          • Marketing Strategy
          • Product Strategy
          • Channel Strategy
      • Chiquita Brands International Sàrl
        • Overview
        • Product Portfolio
        • Profitability by Market Segments (Product/Age /Sales Channel/Region)
        • Sales Footprint
        • Strategy Overview
          • Marketing Strategy
          • Product Strategy
          • Channel Strategy
      • Dole Food Company
        • Overview
        • Product Portfolio
        • Profitability by Market Segments (Product/Age /Sales Channel/Region)
        • Sales Footprint
        • Strategy Overview
          • Marketing Strategy
          • Product Strategy
          • Channel Strategy
      • Fresh Del Monte Produce Incorporated
        • Overview
        • Product Portfolio
        • Profitability by Market Segments (Product/Age /Sales Channel/Region)
        • Sales Footprint
        • Strategy Overview
          • Marketing Strategy
          • Product Strategy
          • Channel Strategy
      • Pisum Food Services Private Limited
        • Overview
        • Product Portfolio
        • Profitability by Market Segments (Product/Age /Sales Channel/Region)
        • Sales Footprint
        • Strategy Overview
          • Marketing Strategy
          • Product Strategy
          • Channel Strategy
      • Reybanpac, Rey Banano del Pacífico C.A.
        • Overview
        • Product Portfolio
        • Profitability by Market Segments (Product/Age /Sales Channel/Region)
        • Sales Footprint
        • Strategy Overview
          • Marketing Strategy
          • Product Strategy
          • Channel Strategy
  20. Assumptions & Acronyms Used
  21. Research Methodology

List of Tables

  • Table 1: Global Market Value (USD Billion) Forecast by Region, 2020-2035
  • Table 2: Global Market Volume (Metric Tons) Forecast by Region, 2020-2035
  • Table 3: Global Market Value (USD Billion) Forecast by Product Type, 2020-2035
  • Table 4: Global Market Volume (Metric Tons) Forecast by Product Type, 2020-2035
  • Table 5: Global Market Value (USD Billion) Forecast by Application, 2020-2035
  • Table 6: Global Market Volume (Metric Tons) Forecast by Application, 2020-2035
  • Table 7: Global Market Value (USD Billion) Forecast by Sales Channel, 2020-2035
  • Table 8: Global Market Volume (Metric Tons) Forecast by Sales Channel, 2020-2035
  • Table 9: North America Market Value (USD Billion) Forecast by Country, 2020-2035
  • Table 10: North America Market Volume (Metric Tons) Forecast by Country, 2020-2035
  • Table 11: North America Market Value (USD Billion) Forecast by Product Type, 2020-2035
  • Table 12: North America Market Volume (Metric Tons) Forecast by Product Type, 2020-2035
  • Table 13: North America Market Value (USD Billion) Forecast by Application, 2020-2035
  • Table 14: North America Market Volume (Metric Tons) Forecast by Application, 2020-2035
  • Table 15: North America Market Value (USD Billion) Forecast by Sales Channel, 2020-2035
  • Table 16: North America Market Volume (Metric Tons) Forecast by Sales Channel, 2020-2035
  • Table 17: Latin America Market Value (USD Billion) Forecast by Country, 2020-2035
  • Table 18: Latin America Market Volume (Metric Tons) Forecast by Country, 2020-2035
  • Table 19: Latin America Market Value (USD Billion) Forecast by Product Type, 2020-2035
  • Table 20: Latin America Market Volume (Metric Tons) Forecast by Product Type, 2020-2035
  • Table 21: Latin America Market Value (USD Billion) Forecast by Application, 2020-2035
  • Table 22: Latin America Market Volume (Metric Tons) Forecast by Application, 2020-2035
  • Table 23: Latin America Market Value (USD Billion) Forecast by Sales Channel, 2020-2035
  • Table 24: Latin America Market Volume (Metric Tons) Forecast by Sales Channel, 2020-2035
  • Table 25: Western Europe Market Value (USD Billion) Forecast by Country, 2020-2035
  • Table 26: Western Europe Market Volume (Metric Tons) Forecast by Country, 2020-2035
  • Table 27: Western Europe Market Value (USD Billion) Forecast by Product Type, 2020-2035
  • Table 28: Western Europe Market Volume (Metric Tons) Forecast by Product Type, 2020-2035
  • Table 29: Western Europe Market Value (USD Billion) Forecast by Application, 2020-2035
  • Table 30: Western Europe Market Volume (Metric Tons) Forecast by Application, 2020-2035
  • Table 31: Western Europe Market Value (USD Billion) Forecast by Sales Channel, 2020-2035
  • Table 32: Western Europe Market Volume (Metric Tons) Forecast by Sales Channel, 2020-2035
  • Table 33: Eastern Europe Market Value (USD Billion) Forecast by Country, 2020-2035
  • Table 34: Eastern Europe Market Volume (Metric Tons) Forecast by Country, 2020-2035
  • Table 35: Eastern Europe Market Value (USD Billion) Forecast by Product Type, 2020-2035
  • Table 36: Eastern Europe Market Volume (Metric Tons) Forecast by Product Type, 2020-2035
  • Table 37: Eastern Europe Market Value (USD Billion) Forecast by Application, 2020-2035
  • Table 38: Eastern Europe Market Volume (Metric Tons) Forecast by Application, 2020-2035
  • Table 39: Eastern Europe Market Value (USD Billion) Forecast by Sales Channel, 2020-2035
  • Table 40: Eastern Europe Market Volume (Metric Tons) Forecast by Sales Channel, 2020-2035
  • Table 41: East Asia Market Value (USD Billion) Forecast by Country, 2020-2035
  • Table 42: East Asia Market Volume (Metric Tons) Forecast by Country, 2020-2035
  • Table 43: East Asia Market Value (USD Billion) Forecast by Product Type, 2020-2035
  • Table 44: East Asia Market Volume (Metric Tons) Forecast by Product Type, 2020-2035
  • Table 45: East Asia Market Value (USD Billion) Forecast by Application, 2020-2035
  • Table 46: East Asia Market Volume (Metric Tons) Forecast by Application, 2020-2035
  • Table 47: East Asia Market Value (USD Billion) Forecast by Sales Channel, 2020-2035
  • Table 48: East Asia Market Volume (Metric Tons) Forecast by Sales Channel, 2020-2035
  • Table 49: South Asia & Pacific Market Value (USD Billion) Forecast by Country, 2020-2035
  • Table 50: South Asia & Pacific Market Volume (Metric Tons) Forecast by Country, 2020-2035
  • Table 51: South Asia & Pacific Market Value (USD Billion) Forecast by Product Type, 2020-2035
  • Table 52: South Asia & Pacific Market Volume (Metric Tons) Forecast by Product Type, 2020-2035
  • Table 53: South Asia & Pacific Market Value (USD Billion) Forecast by Application, 2020-2035
  • Table 54: South Asia & Pacific Market Volume (Metric Tons) Forecast by Application, 2020-2035
  • Table 55: South Asia & Pacific Market Value (USD Billion) Forecast by Sales Channel, 2020-2035
  • Table 56: South Asia & Pacific Market Volume (Metric Tons) Forecast by Sales Channel, 2020-2035
  • Table 57: Middle East and Africa Market Value (USD Billion) Forecast by Country, 2020-2035
  • Table 58: Middle East and Africa Market Volume (Metric Tons) Forecast by Country, 2020-2035
  • Table 59: Middle East and Africa Market Value (USD Billion) Forecast by Product Type, 2020-2035
  • Table 60: Middle East and Africa Market Volume (Metric Tons) Forecast by Product Type, 2020-2035
  • Table 61: Middle East and Africa Market Value (USD Billion) Forecast by Application, 2020-2035
  • Table 62: Middle East and Africa Market Volume (Metric Tons) Forecast by Application, 2020-2035
  • Table 63: Middle East and Africa Market Value (USD Billion) Forecast by Sales Channel, 2020-2035
  • Table 64: Middle East and Africa Market Volume (Metric Tons) Forecast by Sales Channel, 2020-2035

List of Figures

  • Figure 1: Global Market Volume (Metric Tons) Forecast 2020-2035
  • Figure 2: Global Market Pricing Analysis
  • Figure 3: Global Market Value (USD Billion) Forecast 2020-2035
  • Figure 4: Global Market Value Share and BPS Analysis by Product Type, 2025 and 2035
  • Figure 5: Global Market Y-o-Y Growth Comparison by Product Type, 2025-2035
  • Figure 6: Global Market Attractiveness Analysis by Product Type
  • Figure 7: Global Market Value Share and BPS Analysis by Application, 2025 and 2035
  • Figure 8: Global Market Y-o-Y Growth Comparison by Application, 2025-2035
  • Figure 9: Global Market Attractiveness Analysis by Application
  • Figure 10: Global Market Value Share and BPS Analysis by Sales Channel, 2025 and 2035
  • Figure 11: Global Market Y-o-Y Growth Comparison by Sales Channel, 2025-2035
  • Figure 12: Global Market Attractiveness Analysis by Sales Channel
  • Figure 13: Global Market Value (USD Billion) Share and BPS Analysis by Region, 2025 and 2035
  • Figure 14: Global Market Y-o-Y Growth Comparison by Region, 2025-2035
  • Figure 15: Global Market Attractiveness Analysis by Region
  • Figure 16: North America Market Incremental $ Opportunity, 2025-2035
  • Figure 17: Latin America Market Incremental $ Opportunity, 2025-2035
  • Figure 18: Western Europe Market Incremental $ Opportunity, 2025-2035
  • Figure 19: Eastern Europe Market Incremental $ Opportunity, 2025-2035
  • Figure 20: East Asia Market Incremental $ Opportunity, 2025-2035
  • Figure 21: South Asia & Pacific Market Incremental $ Opportunity, 2025-2035
  • Figure 22: Middle East and Africa Market Incremental $ Opportunity, 2025-2035
  • Figure 23: North America Market Value Share and BPS Analysis by Country, 2025 and 2035
  • Figure 24: North America Market Value Share and BPS Analysis by Product Type, 2025 and 2035
  • Figure 25: North America Market Y-o-Y Growth Comparison by Product Type, 2025-2035
  • Figure 26: North America Market Attractiveness Analysis by Product Type
  • Figure 27: North America Market Value Share and BPS Analysis by Application, 2025 and 2035
  • Figure 28: North America Market Y-o-Y Growth Comparison by Application, 2025-2035
  • Figure 29: North America Market Attractiveness Analysis by Application
  • Figure 30: North America Market Value Share and BPS Analysis by Sales Channel, 2025 and 2035
  • Figure 31: North America Market Y-o-Y Growth Comparison by Sales Channel, 2025-2035
  • Figure 32: North America Market Attractiveness Analysis by Sales Channel
  • Figure 33: Latin America Market Value Share and BPS Analysis by Country, 2025 and 2035
  • Figure 34: Latin America Market Value Share and BPS Analysis by Product Type, 2025 and 2035
  • Figure 35: Latin America Market Y-o-Y Growth Comparison by Product Type, 2025-2035
  • Figure 36: Latin America Market Attractiveness Analysis by Product Type
  • Figure 37: Latin America Market Value Share and BPS Analysis by Application, 2025 and 2035
  • Figure 38: Latin America Market Y-o-Y Growth Comparison by Application, 2025-2035
  • Figure 39: Latin America Market Attractiveness Analysis by Application
  • Figure 40: Latin America Market Value Share and BPS Analysis by Sales Channel, 2025 and 2035
  • Figure 41: Latin America Market Y-o-Y Growth Comparison by Sales Channel, 2025-2035
  • Figure 42: Latin America Market Attractiveness Analysis by Sales Channel
  • Figure 43: Western Europe Market Value Share and BPS Analysis by Country, 2025 and 2035
  • Figure 44: Western Europe Market Value Share and BPS Analysis by Product Type, 2025 and 2035
  • Figure 45: Western Europe Market Y-o-Y Growth Comparison by Product Type, 2025-2035
  • Figure 46: Western Europe Market Attractiveness Analysis by Product Type
  • Figure 47: Western Europe Market Value Share and BPS Analysis by Application, 2025 and 2035
  • Figure 48: Western Europe Market Y-o-Y Growth Comparison by Application, 2025-2035
  • Figure 49: Western Europe Market Attractiveness Analysis by Application
  • Figure 50: Western Europe Market Value Share and BPS Analysis by Sales Channel, 2025 and 2035
  • Figure 51: Western Europe Market Y-o-Y Growth Comparison by Sales Channel, 2025-2035
  • Figure 52: Western Europe Market Attractiveness Analysis by Sales Channel
  • Figure 53: Eastern Europe Market Value Share and BPS Analysis by Country, 2025 and 2035
  • Figure 54: Eastern Europe Market Value Share and BPS Analysis by Product Type, 2025 and 2035
  • Figure 55: Eastern Europe Market Y-o-Y Growth Comparison by Product Type, 2025-2035
  • Figure 56: Eastern Europe Market Attractiveness Analysis by Product Type
  • Figure 57: Eastern Europe Market Value Share and BPS Analysis by Application, 2025 and 2035
  • Figure 58: Eastern Europe Market Y-o-Y Growth Comparison by Application, 2025-2035
  • Figure 59: Eastern Europe Market Attractiveness Analysis by Application
  • Figure 60: Eastern Europe Market Value Share and BPS Analysis by Sales Channel, 2025 and 2035
  • Figure 61: Eastern Europe Market Y-o-Y Growth Comparison by Sales Channel, 2025-2035
  • Figure 62: Eastern Europe Market Attractiveness Analysis by Sales Channel
  • Figure 63: East Asia Market Value Share and BPS Analysis by Country, 2025 and 2035
  • Figure 64: East Asia Market Value Share and BPS Analysis by Product Type, 2025 and 2035
  • Figure 65: East Asia Market Y-o-Y Growth Comparison by Product Type, 2025-2035
  • Figure 66: East Asia Market Attractiveness Analysis by Product Type
  • Figure 67: East Asia Market Value Share and BPS Analysis by Application, 2025 and 2035
  • Figure 68: East Asia Market Y-o-Y Growth Comparison by Application, 2025-2035
  • Figure 69: East Asia Market Attractiveness Analysis by Application
  • Figure 70: East Asia Market Value Share and BPS Analysis by Sales Channel, 2025 and 2035
  • Figure 71: East Asia Market Y-o-Y Growth Comparison by Sales Channel, 2025-2035
  • Figure 72: East Asia Market Attractiveness Analysis by Sales Channel
  • Figure 73: South Asia & Pacific Market Value Share and BPS Analysis by Country, 2025 and 2035
  • Figure 74: South Asia & Pacific Market Value Share and BPS Analysis by Product Type, 2025 and 2035
  • Figure 75: South Asia & Pacific Market Y-o-Y Growth Comparison by Product Type, 2025-2035
  • Figure 76: South Asia & Pacific Market Attractiveness Analysis by Product Type
  • Figure 77: South Asia & Pacific Market Value Share and BPS Analysis by Application, 2025 and 2035
  • Figure 78: South Asia & Pacific Market Y-o-Y Growth Comparison by Application, 2025-2035
  • Figure 79: South Asia & Pacific Market Attractiveness Analysis by Application
  • Figure 80: South Asia & Pacific Market Value Share and BPS Analysis by Sales Channel, 2025 and 2035
  • Figure 81: South Asia & Pacific Market Y-o-Y Growth Comparison by Sales Channel, 2025-2035
  • Figure 82: South Asia & Pacific Market Attractiveness Analysis by Sales Channel
  • Figure 83: Middle East and Africa Market Value Share and BPS Analysis by Country, 2025 and 2035
  • Figure 84: Middle East and Africa Market Value Share and BPS Analysis by Product Type, 2025 and 2035
  • Figure 85: Middle East and Africa Market Y-o-Y Growth Comparison by Product Type, 2025-2035
  • Figure 86: Middle East and Africa Market Attractiveness Analysis by Product Type
  • Figure 87: Middle East and Africa Market Value Share and BPS Analysis by Application, 2025 and 2035
  • Figure 88: Middle East and Africa Market Y-o-Y Growth Comparison by Application, 2025-2035
  • Figure 89: Middle East and Africa Market Attractiveness Analysis by Application
  • Figure 90: Middle East and Africa Market Value Share and BPS Analysis by Sales Channel, 2025 and 2035
  • Figure 91: Middle East and Africa Market Y-o-Y Growth Comparison by Sales Channel, 2025-2035
  • Figure 92: Middle East and Africa Market Attractiveness Analysis by Sales Channel
  • Figure 93: Global Market - Tier Structure Analysis
  • Figure 94: Global Market - Company Share Analysis

Frequently Asked Questions

How big is the Cavendish banana market in 2025?

The global Cavendish banana market is estimated to be valued at USD 18.8 billion in 2025.

What will be the size of the Cavendish banana market in 2035?

The market size for the Cavendish banana is projected to reach USD 28.6 billion by 2035.

How much will be the Cavendish banana market growth between 2025 and 2035?

The Cavendish banana market is expected to grow at a 4.3% CAGR between 2025 and 2035.

Which product type segment is projected to lead in the Cavendish banana market in 2025?

The organic Cavendish banana segment is projected to lead the Cavendish banana market with 35% market share in 2025.

Which application segment will contribute a significant share in the Cavendish banana market in 2025?

In terms of application, the food and beverage processing segment is expected to command 38% share in the Cavendish banana market in 2025.

Explore Similar Insights

Future Market Insights

Cavendish Banana Market