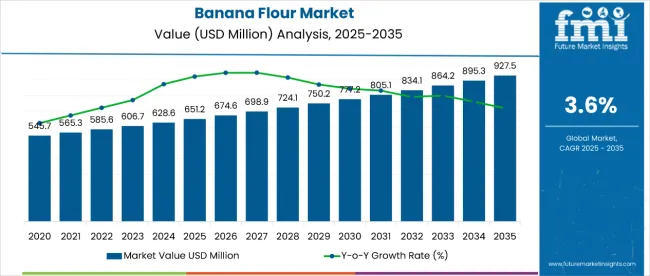
The banana flour market is estimated to be valued at USD 651.2 million in 2025 and is projected to reach USD 927.5 million by 2035, registering a compound annual growth rate (CAGR) of 3.6% over the forecast period.
The market is projected to add an absolute dollar opportunity of USD 273 million during this period. This reflects a 1.42 times growth at a CAGR of 3.6%. The market evolution is expected to be driven by the growing demandfor gluten-free and functional food products, rising adoption of spray-dried processing for better quality and shelf stability, and increasing consumer preference for conventional banana flour due to its wider availability and cost-effectiveness across both developed and emerging markets.
By 2030, the market is projected to reach USD 783.6 million, contributing nearly USD 132.4 million in incremental value during the first half of the decade. The remaining USD 140.6 million is expected to be added between 2030 and 2035, indicating balanced growth supported by consumer shift towards clean-label and natural ingredients.
Companies such as NuNatural Inc., Zuvii, NOW Health Group Inc., Natural Evolution, Ceres Enterprises Ltd., Diana Foods, International Agriculture Group, ADM Wild Europe GmbH & Co., and KADAC Pty Ltd are actively shaping competitive dynamics in the banana flour industry. These players are focusing on capacity expansion, product innovation in gluten-free and functional food categories, and geographical diversification to tap into emerging markets. Strategic collaborations across the value chain, investments in sustainable sourcing, and expanding distribution through modern trade and e-retail channels are likely to reinforce their market positions.
The market holds a strategic position within the broader food and nutrition industry, reflecting its rising adoption in gluten-free, functional, and clean-label food applications. Within the global gluten-free products market, banana flour is estimated to contribute 9%, supported by its use as a wheat substitute. In the specialty flours category, it accounts for nearly 7%, highlighting its importance in bakery and snack innovation. Within the plant-based ingredients market, its share is around 6%, driven by demand for natural and minimally processed alternatives. In the functional food ingredients sector, banana flour holds close to 5%, owing to its prebiotic fiber and nutritional profile. Collectively, these shares underscore their growing importanceacross health-oriented and specialty food segments.
The market is driven by increasing consumer demand for gluten-free and plant-based diets, rising awareness of gut health benefits, and the expanding adoption of spray-dried banana flour in food and beverage formulations. Innovations include the development of fortified banana flour blends, improved spray-drying techniques for better texture and shelf stability, and applications in infant nutrition and pet food. Developments involve sustainable sourcing practices, expansion of production capacity, and partnerships with food processors to enhance product penetration.
| Metric | Value |
|---|---|
| Estimated Size (2025E) | USD 651.2 million |
| Projected Value (2035F) | USD 927.5 million |
| CAGR (2025 to 2035) | 3.6% |
Banana flour’s unique ability to serve as a gluten-free alternative, improve digestive health, and support functional nutrition is driving its adoption. Its natural properties, such as high resistant starch content, prebiotic benefits, and clean-label positioning, make it indispensable in bakery, snacks, infant food, and dietary supplements where health, texture, and nutrition are critical for consumer preference.
Increasing investments in food innovation, rising adoption of spray-dried processes for enhanced quality, and the expanding use of banana flour in both conventional and specialty food categories are further fueling market growth. Food manufacturers prioritize ingredients that extend shelf life, enhance nutritional value, and align with cost-effective, sustainable formulations.
Government initiatives promoting plant-based diets, supportive labeling regulations for gluten-free and organic products, and growing accessibility through modern trade and e-retail distribution channels are strengthening the market outlook. With research focusing on fortified blends, clean-label innovations, and wider applications in functional foods, the banana flour market is expected to witness steady adoption across developed and emerging regions, particularly in markets with high consumer demand for natural and gluten-free alternatives.
The market is segmented by process, application, source, sales channel, and region. By process, the market is categorized into sun-dried, freeze-dried, spray-dried, and others. Based on application, the market is segmented into beverages, pet food and feed industry, household, food industry, bakery & snacks, infant foods, fillings and dressings, soups and sauces, and others. In terms of source, the market is bifurcated into organic and conventional. In terms of sales channel, the market is divided into direct sales and indirect sales (modern trade, convenience stores, specialty stores, e-retailers, and others). Regionally, the market spans North America, Latin America, Western Europe, Eastern Europe, South Asia and Pacific, East Asia, and the Middle East & Africa.
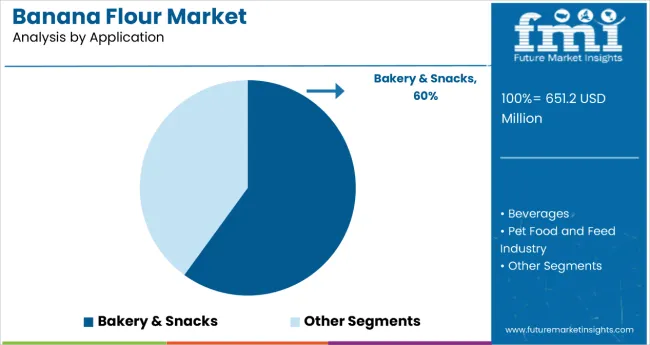
The bakery & snacks segment dominates the application category with 60% of the market share in 2025, driven by rising consumer demand for gluten-free, functional, and plant-based food products. Banana flour is increasingly incorporated into bread, cookies, cakes, and snack bars, making this segment the primary driver of market growth.
Food manufacturers favor bakery and snack applications because banana flour provides functional benefits, consistent texture, and enhanced nutritional value. It has become essential for producers aiming to cater to health-conscious and gluten-free consumer segments.
Ongoing product innovations, improved processing techniques, and expanded distribution through modern retail and e-commerce channels are further boosting adoption. With growing awareness of functional ingredients, the bakery & snacks segment is expected to maintain its leadership throughout the forecast period.
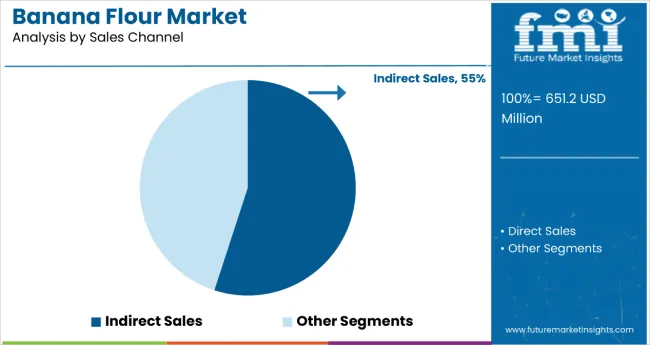
The indirect sales channel dominates the banana flour market with 55% of the market share in 2025, owing to its strong network of distributors, wholesalers, and retail partners. This channel ensures widespread availability of banana flour across supermarkets, health food stores, and e-commerce platforms, enabling manufacturers to reach a broad consumer base efficiently. The extensive distribution infrastructure helps maintain a steady supply, particularly for large-scale buyers in the bakery, snacks, and functional food industries.
Food brands and manufacturers prefer the indirect sales channel because it reduces logistical complexities and provides competitive pricing through bulk procurement. Indirect sales also allow businesses to tap into regional and international markets without investing heavily in their own sales and distribution networks. Moreover, distributors often offer value-added services such as inventory management, marketing support, and demand forecasting, further incentivizing manufacturers to rely on this channel for consistent market access.
Ongoing growth in global demand for gluten-free, natural, and health-focused products is expected to sustain the dominance of the indirect sales channel. Expanding partnerships between suppliers and retail chains, coupled with improvements in supply chain efficiency, are driving adoption across regions. With its ability to provide broad reach, reliability, and scalability, the indirect sales segment is projected to retain its leading position throughout the forecast period, while direct sales channels gradually grow as niche and premium segments expand.
In 2025, the global banana flour market expanded steadily, with North America and Europe accounting for substantial shares due to well-established gluten-free and functional food industries. Key applications include bakery & snacks, beverages, infant foods, and dietary supplements, where banana flour is increasingly used as a natural, gluten-free, and functional ingredient. Food manufacturers and brands are adopting spray-dried and conventional banana flour to improve nutritional quality, texture, and shelf stability. Rising consumer awareness of plant-based and clean-label products, government initiatives promoting healthy diets, and growing e-retail and modern trade distribution channels are strengthening market adoption.
Rising Demand for Gluten-Free and Functional Foods Drives Market Adoption
The increasing consumer preference for gluten-free, plant-based, and functional foods is driving the adoption of banana flour across various applications. Spray-dried and conventional banana flour are widely used in bakery products, snacks, beverages, and nutritional supplements due to their prebiotic benefits, resistant starch content, and clean-label positioning. Expanding food manufacturing capabilities, rising health-consciousness among consumers, and increasing availability through modern trade and e-commerce channels are further strengthening demand. Versatility in product formulation, ease of integration, and growing awareness of health benefits make banana flour an essential ingredient in both developed and emerging markets.
Processing Challenges and Cost Constraints Restrain Growth
Market growth is restrained by higher production costs for spray-dried banana flour, variability in raw material quality, and challenges in maintaining consistent texture, flavor, and nutritional content during processing. Limited awareness in emerging markets and competition from alternative gluten-free flours such as rice, chickpea, or millet also restrict penetration. Additionally, ensuring standardized quality, efficient storage, and supply chain continuity poses challenges for manufacturers. These factors are encouraging companies to invest in process optimization, quality control, and educational initiatives to drive broader adoption while maintaining consumer trust and product reliability.
| Countries | CAGR (2025 to 2035) |
|---|---|
| USA | 8.6% |
| Brazil | 7.6% |
| Australia | 7.4% |
| India | 4.3% |
| China | 3.7% |
| Germany | 3.2% |
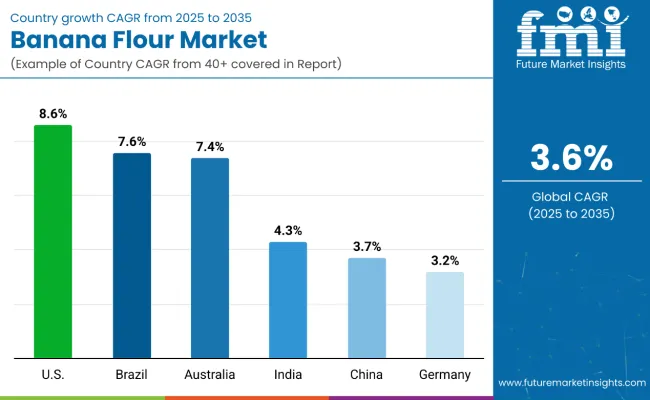
The banana flour market exhibits diverse growth patterns across the top six countries. The USA leads with the highest projected CAGR of 8.6% from 2025, driven by rising demand for gluten-free and functional foods, growing consumer awareness of health benefits, and increasing incorporation of banana flour in bakery and snack products. Brazil follows at 7.6%, supported by expanding food processing industries, government initiatives promoting alternative flours, and increased consumption of plant-based products. Australia shows strong growth at 7.4%, fueled by health-conscious consumer trends and demand for clean-label ingredients. India records a CAGR of 4.3%, with steady growth due to rising adoption of nutritious and natural flours and increasing domestic production. China’s market grows at 3.7%, driven by expanding bakery and convenience food sectors. Germany, at 3.2%, experiences moderate growth, supported by established food processing infrastructure and growing interest in functional and gluten-free products.
The report covers an in-depth analysis of 40+ countries; six top-performing OECD countries are highlighted below.
The banana flour market in the USA is projected to expand at a CAGR of 8.6% from 2025 to 2035, driven by increasing consumer demand for gluten-free, functional, and plant-based foods. Rising incorporation of banana flour in bakery, snack, and health food products, along with growing awareness of its nutritional benefits, is supporting market growth. Retail and e-commerce channels are enhancing product accessibility across urban and health-conscious regions. The growing trend of clean-label and sustainable ingredients is further boosting demand. Innovations in product formulation, such as fortified and ready-to-use mixes, are attracting a wider consumer base.
Key Statistics
Revenue from banana flour in Brazil is projected to grow at a CAGR of 7.6% from 2025 to 2035, driven by expanding food processing industries, government initiatives promoting alternative flours, and increasing adoption in urban diets. Urbanization and growing interest in nutritious ingredients support adoption in bakery and snack segments. Additionally, increasing export opportunities are encouraging local producers to expand production. Consumer preference for plant-based diets and functional foods is further accelerating market uptake.
Key Statistics
Sales of banana flour in Australia are expected to grow at a CAGR of 7.4% from 2025 to 2035, fueled by health-conscious consumer trends and increasing demand for clean-label, gluten-free products. E-commerce and retail expansion are key drivers of accessibility in urban centers. The rise of specialty cafes and health-focused bakeries is promoting innovative banana flour-based products. Consumer education campaigns on gluten intolerance and plant-based nutrition are also supporting adoption.
Key Statistics
The banana flour market in India is projected to grow at a CAGR of 4.3% from 2025 to 2035, driven by rising awareness of nutritious and alternative flours and increasing adoption in bakery, snack, and infant food products. Expansion of domestic banana production and penetration in Tier-2 and Tier-3 cities are further supporting market growth. Additionally, government initiatives promoting local and sustainable agriculture are helping stabilize supply chains. Growing demand from health-conscious and urban populations is encouraging new product launches.
Key Statistics
Sales of banana flour in China are expected to grow at a CAGR of 3.7% from 2025 to 2035, fueled by expanding bakery and convenience food sectors and growing interest in gluten-free and plant-based alternatives. Major urban centers such as Beijing, Shanghai, and Guangzhou are key demand hubs. Increasing awareness of functional foods and wellness trends is encouraging wider adoption. Partnerships between food manufacturers and retail chains are helping reach more consumers efficiently.
Key Statistics
Demand for banana flour in Germany is projected to grow at a CAGR of 3.2% from 2025 to 2035, supported by a mature food processing industry, high consumer awareness of gluten-free and functional foods, and adoption in specialty bakeries. Growth is moderated by already high market penetration. Consumer preference for clean-label and organic products is further driving adoption in the bakery and snack segments. Additionally, collaboration between food brands and nutrition experts is promoting innovation in ready-to-use banana flour products.
Key Statistics
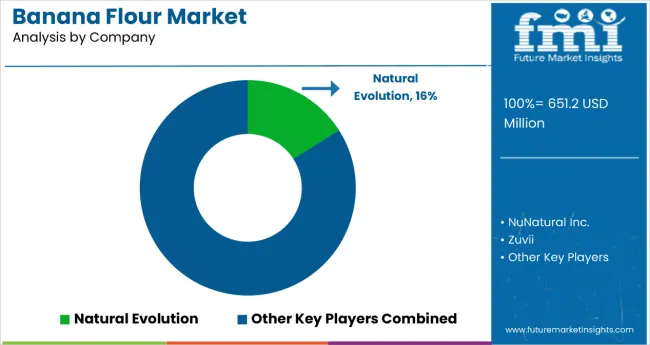
The Banana Flour Market is witnessing robust expansion, supported by the growing preference for gluten-free, clean-label, and functional food ingredients. Leading manufacturers such as NuNaturals Inc., NOW Health Group Inc., and Natural Evolution Pty Ltd. are pioneering the production of high-quality banana flour through advanced drying and milling processes that preserve resistant starch content and nutritional value. This has positioned banana flour as a favored alternative to wheat flour among health-conscious consumers and the rapidly expanding vegan and paleo communities.
Zuvii and Ceres Enterprises Ltd. are focusing on innovative formulations targeting bakery, snack, and infant nutrition applications, where the demand for natural carbohydrate sources and digestive wellness products continues to rise. The product’s unique properties, such as low sugar content, high fiber levels, and prebiotic benefits—are increasingly appealing to food manufacturers reformulating products for better nutritional profiles and sustainability claims.
| Items | Values |
|---|---|
| Quantitative Units (2025) | USD 651.2 million |
| Process | Sun-dried, Freeze-dried, Spray-dried, and Others |
| Application | Beverages, Pet Food and Feed Industry, Household, Food Industry, Bakery & Snacks, Infant Foods, Filling and Dressings, Soups and Sauces, and Others |
| Source | Organic and Conventional |
| Sales Channel | Direct Sales and Indirect Sales (Modern Trade, Convenience Store, Specialty Store, E-Retailers, and Others) |
| Regions Covered | North America, Latin America, Western Europe, Eastern Europe, South Asia and Pacific, East Asia, and Middle East & Africa |
| Country Covered | United States, Canada, United Kingdom, Germany, France, China, Japan, South Korea, Brazil, Australia, and 40+ countries |
| Key Companies Profiled |
NuNaturals Inc., Zuvii, NOW Health Group Inc., Natural Evolution Pty Ltd., Ceres Enterprises Ltd. |
| Additional Attributes | Dollar sales by process, application, source, and sales channel; regional adoption trends; competitive landscape; consumer preferences; innovations in processing and packaging; sustainability initiatives; organic certifications shaping demand |
The global banana flour market is estimated to be valued at USD 651.2 million in 2025.
The market size for banana flour is projected to reach USD 927.5 million by 2035.
The banana flour market is expected to grow at a 3.6% CAGR between 2025 and 2035.
The bakery & snacks segment is projected to lead in the banana flour market with 60% market share in 2025.
In terms of sales channel, indirect sales are projected to command 55% share in the banana flour market in 2025.


Full Research Suite comprises of:
Market outlook & trends analysis
Interviews & case studies
Strategic recommendations
Vendor profiles & capabilities analysis
5-year forecasts
8 regions and 60+ country-level data splits
Market segment data splits
12 months of continuous data updates
DELIVERED AS:
PDF EXCEL ONLINE
Korea Banana Flour Market Analysis by Source, Application, Distribution Channel, and Region Through 2035
Green Banana Flour Market Analysis - Growth & Demand 2025 to 2035
Upcycled Banana Flour Market Size, Growth, and Forecast 2025 to 2035
Demand for Banana Flour in EU Size and Share Forecast Outlook 2025 to 2035
Western Europe Banana Flour Market Analysis by Source, Application, Distribution Channel, and Country Through 2025 to 2035
Banana Flour in Japan - Size and Share Forecast Outlook 2025 to 2035
Banana Flakes Market Size and Share Forecast Outlook 2025 to 2035
Banana Puree Market Analysis - Size, Share, and Forecast Outlook 2025 to 2035
Banana Bread Market Analysis - Size, Share, and Forecast Outlook 2025 to 2035
Banana Milk Market Trends - Demand & Growth 2025 to 2035
Cavendish Banana Market Size and Share Forecast Outlook 2025 to 2035
Flour Mixes Market Growth – Specialty Baking & Industry Trends 2025 to 2035
Flour Substitutes Market Analysis by Baked Goods, Noodles, Pastry, Fried Food, Pasta, Bread, Crackers Applications Through 2035
Flour Conditioner Market
Flour Improvers Market
Corn Flour Market Size and Share Forecast Outlook 2025 to 2035
Bean Flour Market Size and Share Forecast Outlook 2025 to 2035
Market Share Breakdown of Bean Flour Manufacturers
Pulse Flours Market Size and Share Forecast Outlook 2025 to 2035
Vegan Flour Market Growth - Plant-Based Innovation & Industry Demand 2025 to 2035

Thank you!
You will receive an email from our Business Development Manager. Please be sure to check your SPAM/JUNK folder too.
Chat With
MaRIA