Corn Flour Market Size and Share Forecast Outlook 2025 to 2035

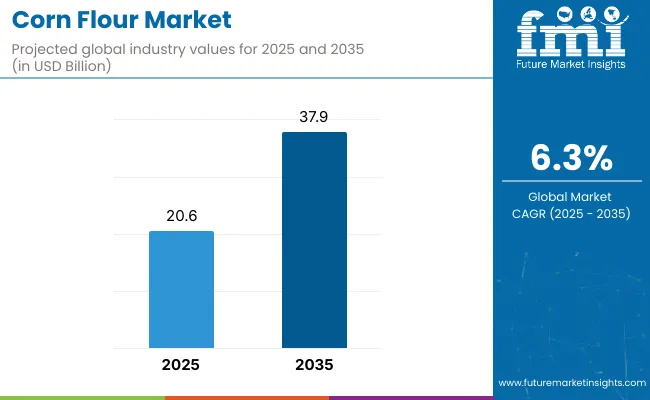
The corn flour market is estimated to be valued at USD 20.6 billion in 2025. It is projected to reach USD 37.9 billion by 2035, registering a compound annual growth rate (CAGR) of 6.3% over the forecast period. The market is projected to add an absolute dollar opportunity of USD 17.3 billion over the forecast period. This reflects a 1.84 times growth at a compound annual growth rate of 6.3%. The market's evolution is expected to be shaped by increasing demand for gluten-free and health-conscious food alternatives, the rising popularity of convenient food formats, and the growing influence of Western-style bakery consumption across developing economies.

By 2030, the market is likely to reach USD 28.8 billion, reflecting USD 8.2 billion growth from 2025. The remaining USD 9.1 billion will be added from 2030 to 2035, suggesting a moderately back-loaded growth pattern. Product innovation in corn separation and processing technologies is gaining traction due to corn flour’s favorable nutritional advantages and enhanced product quality profiles.

Companies such as Archer Daniels Midland Company and Ardent Mills LLC are advancing their competitive positions through investment in advanced processing technologies and scalable production systems. Health-conscious procurement models are supporting expansion into gluten-free bakery, functional food, and snack applications. Market performance will remain anchored in nutritional efficacy, processing innovation, and clean-label compliance benchmarks.
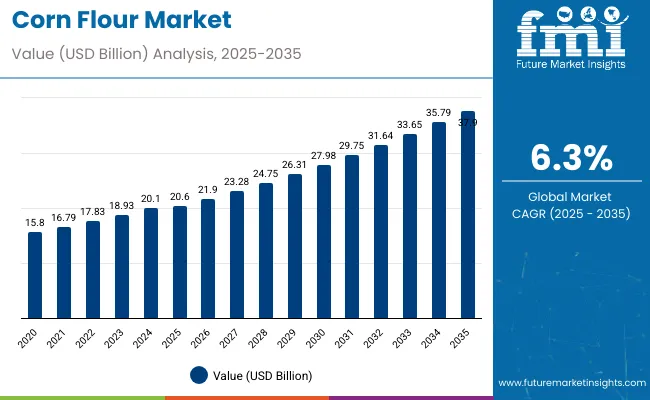
Corn Flour Market Value Analysis

Quick Stats for Corn Flour Market

  • Corn Flour Market Value (2025): USD 20.6 billion
  • Corn Flour Market Forecast Value (2035): USD 37.9 billion
  • Corn Flour Market Forecast CAGR: 6.3%
  • Leading Segment in Corn Flour Market in 2025: Bakery & Confectionery Products (43% market share)
  • Key Growth Regions in Corn Flour Market: Asia Pacific, Latin America, and Middle East & Africa
  • Key Players in Corn Flour Market: Archer Daniels Midland Company, Bob's Red Mill Natural Foods, King Arthur Flour, Ardent Mills LLC, Grain Craft, General Mills Inc., Cargill Inc., Ingredion Incorporated, Bunge Limited, Gruma S.A.B. de C.V.

Corn Flour Market

Metric Value
Estimated Size (2025E) USD 20.6 billion
Projected Value (2035F) USD 37.9 billion
CAGR (2025 to 2035) 6.3%

The market holds varying shares across its parent markets. Within the broader flour market, it accounts for 12% due to rising demand for gluten-free alternatives. Within the corn products segment, corn flour represents around 22%, with the remainder consisting of corn starch and cornmeal. Its share in the gluten-free products market is estimated at 8%, driven by bakery and snack applications. Within the food ingredients market, corn flour represents nearly 5%, while in the bakery ingredients segment, it holds a 10% share. In functional and grain-based products markets, its share ranges from 6% to 9%.

The market is undergoing structural change driven by rising demand for gluten-free, health-conscious, and convenient food alternatives. Advanced processing technologies using enzymatic corn separation and bio-based extraction methods have enhanced nutritional profiles and product quality, making corn flour a viable substitute for traditional wheat-based ingredients. Manufacturers are introducing specialized formulations tailored for specific applications, expanding beyond basic baking into functional foods and wellness segments. Government initiatives promoting food security in India and the United States have widened consumer acceptance, reshaping traditional flour sourcing. Innovations such as enzymatic separation by Novozymes and upcycled corn flour by Renewal Mill are contributing to sustainability while expanding health applications.

Why is the Corn Flour Market Growing?

Corn flour's gluten-free properties, superior nutritional profile, and functional versatility make it an attractive ingredient for health-conscious consumers and food manufacturers seeking wheat alternatives and clean-label solutions. Its high fiber content, low glycemic index, and allergen-free characteristics align perfectly with rising demand for diabetic-friendly and celiac-appropriate food products.

Growing awareness of gluten-free diets and functional foods is further propelling adoption, especially in the bakery, confectionery, and snack food sectors. Government initiatives promoting food security and healthy eating in key markets like India and the United States, along with innovations in enzymatic separation and bio-based processing technologies, are also enhancing product quality and application versatility.

As health and wellness trends accelerate across demographics and clean-label preferences become critical, the market outlook remains favorable. With consumers and manufacturers prioritizing nutritional density, gluten-free formulations, and sustainable sourcing, corn flour is well-positioned to expand across various food, beverage, and specialty nutrition applications.

Segmental Analysis

The market is segmented by application, distribution channel, and region. By application, the market is categorized into bakery and confectionery products, snack foods, and other applications (soups, pasta, gravies, baby food, and culinary mixes). Based on distribution channel, the market is divided into online retail, supermarkets/hypermarkets, convenience stores, and other distribution channels (independent grocery stores, health food stores, and wholesale outlets). Regionally, the market is classified into North America, Latin America, Western Europe, Eastern Europe, South Asia and Pacific, East Asia, the Middle East and Africa.
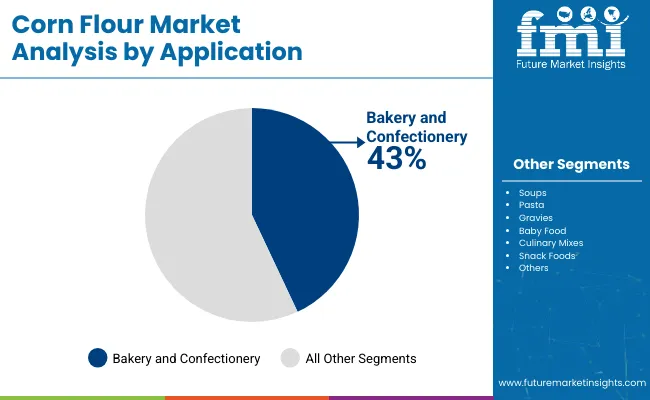
By Application, Bakery and Confectionery Products Segment Accounts for 43% of the Market Share

Corn Flour Market By Application

The bakery and confectionery segment holds a dominant position with 43% of the market share in the application category, owing to rising health awareness and increasing demand for gluten-free baked goods. Corn flour blends seamlessly with other flours, making it ideal for producing cookies, cakes, and pastries while delivering superior nutritional benefits, including high fiber content and low glycemic index properties.

Consumer preference for nutritious, allergen-free bakery items is reinforcing demand within this segment, especially in Western markets and urban Asia. The ingredient's functional versatility supports product innovation in gluten-free formulations, celiac-friendly products, and diabetic-appropriate baked goods.

Manufacturers are leveraging corn flour's binding properties and neutral taste profile to create premium bakery products that cater to health-conscious consumers. The segment is poised to expand further as gluten-free baking continues to gain mainstream acceptance across developed and emerging markets.
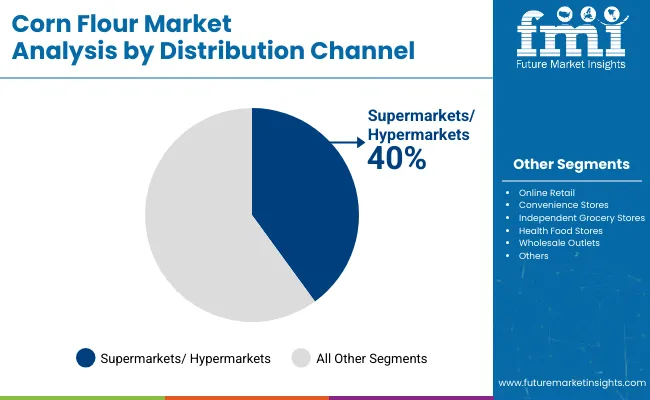
By Distribution Channel, Supermarkets/Hypermarkets Segment Accounts for 40% of the Market Share

Corn Flour Market By Distribution Channel

Supermarkets and hypermarkets dominate the corn flour distribution landscape with 40% of the market share in 2025, as these outlets offer a wide product variety, competitive pricing, and the convenience of physical inspection before purchase. Consumer preference for trusted brands and fresh stock increases foot traffic in these retail environments.

These channels facilitate in-store promotions, product sampling, and higher visibility for new gluten-free products through dedicated specialty aisles that attract health-conscious shoppers. Their one-stop shopping convenience allows consumers to access multiple corn flour brands and compare options effectively.

Modern retail expansion, especially in urban and semi-urban zones of Asia and Latin America, is supporting this segment's continued dominance in the corn flour distribution ecosystem.

What are the Drivers, Restraints, and Key Trends of the Corn Flour Market?

In 2024, global corn flour consumption grew by 14% year-on-year, with North America and Asia-Pacific taking a combined 55% share. Applications include gluten-free bakery formulations, health-conscious snack production, and functional food enhancement. Manufacturers are introducing specialized corn flour grades and multi-functional blends that deliver superior binding properties and nutritional density. Clean-label formulations now support transparent ingredient positioning for allergen-free products. Gluten-free consumption trends and nutritional efficacy support consumer confidence. Technology providers increasingly supply ready-to-use corn flour solutions with integrated nutritional profiles to reduce formulation complexity.

Gluten-Free Preferences and Nutritional Benefits Accelerate Market Growth

Food manufacturers and bakery companies are choosing corn flour ingredients to achieve gluten-free certification, enhance nutritional profiles, and meet consumer demands for allergen-free food products. In nutritional testing, high-quality corn flour delivers up to 12% protein content and 7-9% fiber compared to refined wheat flour at 10-11% protein and 2-3% fiber. Products formulated with corn flour maintain structural integrity throughout processing and baking cycles. In gluten-free formats, corn flour-enhanced baked goods help achieve texture and taste profiles comparable to wheat-based products while reducing glycemic impact by up to 25%. Corn flour applications are now being deployed for clean-label positioning, increasing adoption in sectors demanding natural gluten alternatives. These advantages help explain why corn flour adoption rates in food manufacturing rose 28% in 2024 across North America and Europe.

Raw Material Costs, Infrastructure Gaps and Market Competition Limit Growth Potential

Growth faces constraints due to corn price fluctuations, specialized processing requirements, and competition from alternative flours. Raw corn costs can vary from USD 4 to USD 7 per bushel, depending on seasonal factors and regional supply conditions, impacting flour pricing and leading to procurement delays of up to 15% in industrial applications. Specialized milling technology requirements and quality control standards add 3 to 5 weeks to product development cycles. Transportation logistics and storage conditions extend distribution costs by 12-18% compared to conventional wheat flour. Limited availability among fine-milling capable processing facilities limits scalable production, especially for specialty grade projects. These constraints make corn flour adoption challenging in price-sensitive markets despite growing gluten-free benefits and commercial interest.
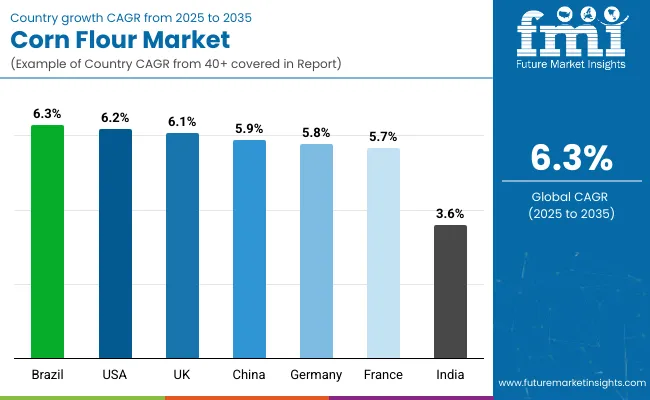
Corn Flour Market Analysis by Top Countries

Country Wise Analysis Of Corn Flour Market

Country CAGR (2025 to 2035)
Brazil 6.3%
USA 6.2%
UK 6.1%
China 5.9%
Germany 5.8%
France 5.7%
India 3.6%

In the corn flour market, Brazil leads with the highest projected CAGR of 6.3% from 2025 to 2035, driven by the expansion of gluten-free food segments and rising health consciousness. The USA follows closely with a 6.2% CAGR, supported by strong demand for allergen-free baking ingredients and clean-label products. The UK shows solid growth at 6.1%, benefiting from premium gluten-free market expansion. China demonstrates robust performance at 5.9% CAGR, fueled by the adoption of Western-style bakeries and urbanization trends. Germany and France exhibit steady growth at 5.8% and 5.7% respectively, supported by functional food innovations. India shows the lowest increase at 3.6%, reflecting market maturity despite strong agricultural foundations.

The report covers a comprehensive analysis of 40+ countries; seven top-performing markets are highlighted below.

Market Expansion in the Corn Flour Market in Brazil

Revenue from corn flour in Brazil is projected to grow at a CAGR of 6.3% from 2025 to 2035, matching the global average. Growth is fueled by increasing demand for gluten-free products and health-conscious food alternatives across major urban centers like São Paulo, Rio de Janeiro, and Brasília. Brazilian food manufacturers are investing in advanced corn processing technologies to improve product quality and nutritional profiles. Strong domestic corn production capabilities and rising export activity to neighboring Latin American markets are reinforcing Brazil's position as a regional leader in corn flour manufacturing and distribution.

Key Statistics:

  • 2.8 million tons of corn flour processed across food manufacturing sectors in 2024
  • 47% of product applications focused on gluten-free bakery and snack foods
  • USD 890 million invested in corn processing facility upgrades across six states in 2024

Innovation Leadership in the Corn Flour Market in the United States

The corn flour market in the USA is anticipated to expand at a CAGR of 6.2% from 2025 to 2035, slightly below the global rate. Growth is centered on gluten-free product innovation and clean-label food applications in major markets, including California, Texas, and Illinois. Advanced milling technologies and enzymatic processing methods are being deployed for specialty corn flour production targeting health-conscious consumers. Strategic partnerships between USA corn processors and food manufacturers have strengthened significantly, with particular focus on organic certifications and sustainable sourcing practices in premium dietary segments.

Key Statistics:

  • 42 commercial corn flour facilities certified for USDA organic standards in 2024
  • 73% of USA corn flour products meet clean-label compliance requirements
  • 1,245 food technologists employed in corn flour research and development nationwide

Market Development in the Corn Flour Market in the United Kingdom

Sales of corn flour in the UK are projected to flourish at a CAGR of 6.1% from 2025 to 2035, marginally below the global average. Growth is concentrated in premium gluten-free applications and specialty food production across the London, Manchester, and Birmingham regions. Corn flour adoption is shifting toward health-focused bakery products and functional food enhancement. Custom milling services and specialized processing capabilities lead commercial deployment strategies. Domestic partnerships between UK food manufacturers and European corn suppliers have strengthened, supported by increasing demand for allergen-free ingredients in mainstream retail channels.

Key Statistics:

  • 3.7 million GBP allocated to corn flour innovation projects in the UK in 2024
  • 38% of corn flour applications focused on premium gluten-free bakery products
  • 89 partnership agreements established between UK manufacturers and ingredient suppliers

Growth Assessment for Corn Flour Market in China

Revenue from corn flour in China is expected to grow at a CAGR of 5.9% from 2025 to 2035, underperforming the global average by 0.4%. Demand is driven by Western-style bakery expansion and processed food development in major cities like Beijing, Shanghai, and Guangzhou. Food manufacturers are increasingly adopting corn flour for product diversification and nutritional enhancement in traditional and modern food applications. However, strong competition from conventional wheat flour and rice-based alternatives limits market penetration.

Key Statistics:

  • 4.2 billion RMB invested in China's corn flour supply chain development in 2024
  • 31% of corn flour consumption is attributed to Western-style bakery applications
  • 567 food companies using corn flour ingredients across major Chinese markets

Germany Corn Flour Market Analysis by Application Segments

Demand for corn flour in Germany is anticipated to increase at a CAGR of 5.8% from 2025 to 2035, supported by strong demand for gluten-free products and functional food applications. Urban markets like Berlin, Munich, and Hamburg are experiencing increased adoption of corn flour in artisanal bakeries and health food production. German food manufacturers are leveraging advanced milling technologies to meet stringent quality standards for organic and clean-label products.

Key Statistics:

  • 34.2% of Germany's corn flour market share is attributed to bakery applications in 2025
  • 28.7% of applications focused on gluten-free and specialty food products
  • €127.8 million revenue contribution from corn flour products in Germany in 2025

France Corn Flour Market Development Analysis

The corn flour market in France is anticipated to expand at a CAGR of 5.7% from 2025 to 2035, driven by artisanal food production and premium bakery applications in Paris, Lyon, and Marseille regions. French food manufacturers are focusing on traditional and gourmet applications, integrating corn flour into high-end patisserie and specialty food products. Market growth is supported by increasing consumer awareness of gluten intolerance and French culinary traditions adapting to include alternative flour ingredients in traditional recipes and modern food innovations.

Key Statistics:

  • 2.1 million EUR invested in French corn flour processing facility modernization in 2024
  • 44% of corn flour applications concentrated in artisanal bakery and confectionery sectors
  • 156 premium food manufacturers incorporating corn flour ingredients across France

India Corn Flour Market Growth Constraints Analysis

Sales of corn flour in India are estimated to increase at a CAGR of 3.6% from 2025 to 2035, significantly underperforming the global average. Growth is limited by a strong preference for traditional wheat flour and established regional grain consumption patterns across major markets, including Delhi, Mumbai, and Bangalore. Indian food manufacturers face challenges from low consumer awareness of corn flour benefits and price sensitivity in mass market segments. However, urban health-conscious consumers and diabetic population segments are driving modest demand growth, particularly in metropolitan areas.

Key Statistics:
  • 840 million INR allocated to corn flour market development initiatives in India in 2024
  • 23% of corn flour consumption is attributed to health-conscious urban demographics
  • 234 food processing companies experimenting with corn flour formulations nationwide

Competitive Landscape of the Corn Flour Market

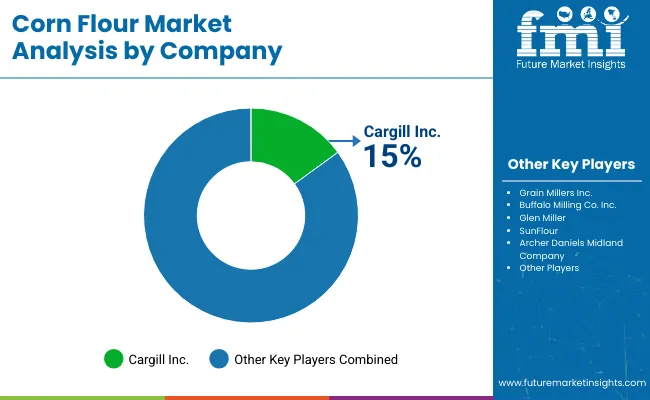
Corn Flour Market By Company

The market is moderately consolidated, featuring a mix of global agribusiness corporations, specialized milling companies, and regional processors with varying degrees of processing technology, product innovation, and application expertise. Archer Daniels Midland Company and Cargill Inc. lead the industrial corn flour segment, supplying high-volume ingredients for food manufacturing, bakery applications, and processed food production. Their strength lies in comprehensive corn processing capabilities, global distribution networks, and established relationships with major food manufacturers.

General Mills Inc. and Ardent Mills LLC differentiate through advanced milling technologies, custom flour formulations, and application-specific solutions that cater to premium bakery, gluten-free, and specialty food applications. King Arthur Flour and Bob's Red Mill Natural Foods focus on organic and specialty corn flour production, addressing growing demand for clean-label, non-GMO, and artisanal baking ingredient applications.

Regional specialists such as Grain Millers Inc., Grain Craft, and Ingredion Incorporated emphasize processing innovation, sustainable sourcing practices, and functional flour development, creating value in health-focused ingredient markets and specialized dietary applications.

Entry barriers remain significant, driven by challenges in advanced milling technology, corn supply chain integration, and compliance with food safety and quality standards across multiple application categories. Competitiveness increasingly depends on milling efficiency, nutritional enhancement capabilities, and product development expertise for diverse food manufacturing and consumer retail environments.

Scope of Report

Items Value
Quantitative Units USD 20.6 billion
By Application Bakery and Confectionery Products, Snack Foods, Other Applications (Soups, Pasta, Gravies, Baby Food, and Culinary Mixes)
By Distribution Channel Hypermarkets/Supermarkets, Online Retail, Convenience Stores, Other Distribution Channels ( Independent Grocery Stores, Health Food Stores, and Wholesale Outlets)
Regions Covered North America, Latin America, Western Europe, Eastern Europe, South Asia , the Pacific, East Asia, the Middle East and Africa
Countries Covered United States, Canada, United Kingdom, Germany, France, China, Japan, South Korea, Brazil, Australia , India and 40+ countries
Key Companies Profiled Grain Millers Inc., Buffalo Milling Co. Inc., Glen Miller, SunFlour , Archer Daniels Midland Company, General Mills Inc., Bob’s Red Mill Natural Foods, King Arthur Flour, Ardent Mills LLC, Grain Craft, Italgrani USA, Miller Milling
Additional Attributes Dollar sales by application and distribution channel; regional demand trends; competitive landscape; consumer preferences for whole-grain, gluten-free, and fortified variants; integration with sustainable and non-GMO sourcing; innovations in milling and formulation; and quality & safety standardization across retail and foodservice channels

Key Segmentation

By Application:

  • Bakery and Confectionery Products
  • Snack Foods
  • Other Applications

By Distribution Channel:

  • Sales via Online Retail
  • Sales via Supermarkets/Hypermarkets
  • Sales via Convenience Stores
  • Sales via Other Distribution Channels

By Region:

  • North America
  • Latin America
  • Europe
  • Asia Pacific
  • Middle East & Africa

Table of Content

  1. Executive Summary
    • Global Market Outlook
    • Demand-side Trends
    • Supply-side Trends
    • Technology Roadmap Analysis
    • Analysis and Recommendations
  2. Market Overview
    • Market Coverage / Taxonomy
    • Market Definition / Scope / Limitations
  3. Market Background
    • Market Dynamics
      • Drivers
      • Restraints
      • Opportunity
      • Trends
    • Scenario Forecast
      • Demand in Optimistic Scenario
      • Demand in Likely Scenario
      • Demand in Conservative Scenario
    • Opportunity Map Analysis
    • Product Life Cycle Analysis
    • Supply Chain Analysis
      • Supply Side Participants and their Roles
        • Producers
        • Mid-Level Participants (Traders/ Agents/ Brokers)
        • Wholesalers and Distributors
      • Value Added and Value Created at Node in the Supply Chain
      • List of Raw Material Suppliers
      • List of Existing and Potential Buyer’s
    • Investment Feasibility Matrix
    • Value Chain Analysis
      • Profit Margin Analysis
      • Wholesalers and Distributors
      • Retailers
    • PESTLE and Porter’s Analysis
    • Regulatory Landscape
      • By Key Regions
      • By Key Countries
    • Regional Parent Market Outlook
    • Production and Consumption Statistics
    • Import and Export Statistics
  4. Global Market Analysis 2020 to 2024 and Forecast, 2025 to 2035
    • Historical Market Size Value (USD Billion) & Volume (Kilotons) Analysis, 2020 to 2024
    • Current and Future Market Size Value (USD Billion) & Volume (Kilotons) Projections, 2025 to 2035
      • Y-o-Y Growth Trend Analysis
      • Absolute $ Opportunity Analysis
  5. Global Market Pricing Analysis 2020 to 2024 and Forecast 2025 to 2035
  6. Global Market Analysis 2020 to 2024 and Forecast 2025 to 2035, By Application
    • Introduction / Key Findings
    • Historical Market Size Value (USD Billion) & Volume (Kilotons) Analysis By Application, 2020 to 2024
    • Current and Future Market Size Value (USD Billion) & Volume (Kilotons) Analysis and Forecast By Application, 2025 to 2035
      • Bakery and Confectionery Products
      • Snack Foods
      • Other Applications
        • Soups
        • Pasta
        • Gravies
        • Baby Food
        • Culinary Mixes
    • Y-o-Y Growth Trend Analysis By Application, 2020 to 2024
    • Absolute $ Opportunity Analysis By Application, 2025 to 2035
  7. Global Market Analysis 2020 to 2024 and Forecast 2025 to 2035, By Distribution Channel
    • Introduction / Key Findings
    • Historical Market Size Value (USD Billion) & Volume (Kilotons) Analysis By Distribution Channel, 2020 to 2024
    • Current and Future Market Size Value (USD Billion) & Volume (Kilotons) Analysis and Forecast By Distribution Channel, 2025 to 2035
      • Online Retail
      • Supermarkets/Hypermarkets
      • Convenience Stores
      • Other Distribution Channels
        • Independent Grocery Stores
        • Health Food Stores
        • Wholesale Outlets
    • Y-o-Y Growth Trend Analysis By Distribution Channel, 2020 to 2024
    • Absolute $ Opportunity Analysis By Distribution Channel, 2025 to 2035
  8. Global Market Analysis 2020 to 2024 and Forecast 2025 to 2035, By Region
    • Introduction
    • Historical Market Size Value (USD Billion) & Volume (Kilotons) Analysis By Region, 2020 to 2024
    • Current Market Size Value (USD Billion) & Volume (Kilotons) Analysis and Forecast By Region, 2025 to 2035
      • North America
      • Latin America
      • Western Europe
      • Eastern Europe
      • East Asia
      • South Asia & Pacific
      • Middle East and Africa
    • Market Attractiveness Analysis By Region
  9. North America Market Analysis 2020 to 2024 and Forecast 2025 to 2035, By Country
    • Historical Market Size Value (USD Billion) & Volume (Kilotons) Trend Analysis By Market Taxonomy, 2020 to 2024
    • Market Size Value (USD Billion) & Volume (Kilotons) Forecast By Market Taxonomy, 2025 to 2035
      • By Country
        • USA
        • Canada
        • Mexico
      • By Application
      • By Distribution Channel
    • Market Attractiveness Analysis
      • By Country
      • By Application
      • By Distribution Channel
    • Key Takeaways
  10. Latin America Market Analysis 2020 to 2024 and Forecast 2025 to 2035, By Country
    • Historical Market Size Value (USD Billion) & Volume (Kilotons) Trend Analysis By Market Taxonomy, 2020 to 2024
    • Market Size Value (USD Billion) & Volume (Kilotons) Forecast By Market Taxonomy, 2025 to 2035
      • By Country
        • Brazil
        • Argentina
        • Rest of LATAM
      • By Application
      • By Distribution Channel
    • Market Attractiveness Analysis
      • By Country
      • By Application
      • By Distribution Channel
    • Key Takeaways
  11. Western Europe Market Analysis 2020 to 2024 and Forecast 2025 to 2035, By Country
    • Historical Market Size Value (USD Billion) & Volume (Kilotons) Trend Analysis By Market Taxonomy, 2020 to 2024
    • Market Size Value (USD Billion) & Volume (Kilotons) Forecast By Market Taxonomy, 2025 to 2035
      • By Country
        • Germany
        • Italy
        • France
        • UK
        • Spain
        • BENELUX
        • Nordic
        • Rest of W.Europe
      • By Application
      • By Distribution Channel
    • Market Attractiveness Analysis
      • By Country
      • By Application
      • By Distribution Channel
    • Key Takeaways
  12. Eastern Europe Market Analysis 2020 to 2024 and Forecast 2025 to 2035, By Country
    • Historical Market Size Value (USD Billion) & Volume (Kilotons) Trend Analysis By Market Taxonomy, 2020 to 2024
    • Market Size Value (USD Billion) & Volume (Kilotons) Forecast By Market Taxonomy, 2025 to 2035
      • By Country
        • Russia
        • Hungary
        • Poland
        • Balkan & Baltics
        • Rest of E. Europe
      • By Application
      • By Distribution Channel
    • Market Attractiveness Analysis
      • By Country
      • By Application
      • By Distribution Channel
    • Key Takeaways
  13. East Asia Market Analysis 2020 to 2024 and Forecast 2025 to 2035, By Country
    • Historical Market Size Value (USD Billion) & Volume (Kilotons) Trend Analysis By Market Taxonomy, 2020 to 2024
    • Market Size Value (USD Billion) & Volume (Kilotons) Forecast By Market Taxonomy, 2025 to 2035
      • By Country
        • China
        • Japan
        • South Korea
      • By Application
      • By Distribution Channel
    • Market Attractiveness Analysis
      • By Country
      • By Application
      • By Distribution Channel
    • Key Takeaways
  14. South Asia & Pacific Market Analysis 2020 to 2024 and Forecast 2025 to 2035, By Country
    • Historical Market Size Value (USD Billion) & Volume (Kilotons) Trend Analysis By Market Taxonomy, 2020 to 2024
    • Market Size Value (USD Billion) & Volume (Kilotons) Forecast By Market Taxonomy, 2025 to 2035
      • By Country
        • India
        • Australia & New Zealand
        • ASEAN
        • Rest of SAP
      • By Application
      • By Distribution Channel
    • Market Attractiveness Analysis
      • By Country
      • By Application
      • By Distribution Channel
    • Key Takeaways
  15. Middle East and Africa Market Analysis 2020 to 2024 and Forecast 2025 to 2035, By Country
    • Historical Market Size Value (USD Billion) & Volume (Kilotons) Trend Analysis By Market Taxonomy, 2020 to 2024
    • Market Size Value (USD Billion) & Volume (Kilotons) Forecast By Market Taxonomy, 2025 to 2035
      • By Country
        • GCC Countries
        • Northern Africa
        • South Africa
        • Turkiye
        • Rest of MEA
      • By Application
      • By Distribution Channel
    • Market Attractiveness Analysis
      • By Country
      • By Application
      • By Distribution Channel
    • Key Takeaways
  16. Key Countries Market Analysis
    • USA
      • Pricing Analysis
      • Market Share Analysis, 2024
        • By Application
        • By Distribution Channel
    • Canada
      • Pricing Analysis
      • Market Share Analysis, 2024
        • By Application
        • By Distribution Channel
    • Brazil
      • Pricing Analysis
      • Market Share Analysis, 2024
        • By Application
        • By Distribution Channel
    • Mexico
      • Pricing Analysis
      • Market Share Analysis, 2024
        • By Application
        • By Distribution Channel
    • Argentina
      • Pricing Analysis
      • Market Share Analysis, 2024
        • By Application
        • By Distribution Channel
  17. Market Structure Analysis
    • Competition Dashboard
    • Competition Benchmarking
    • Market Share Analysis of Top Players
      • By Regional
      • By Application
      • By Distribution Channel
  18. Competition Analysis
    • Competition Deep Dive
      • Grain Millers Inc.
        • Overview
        • Product Portfolio
        • Profitability by Market Segments (Product/Age /Sales Channel/Region)
        • Sales Footprint
        • Strategy Overview
          • Marketing Strategy
          • Product Strategy
          • Channel Strategy
      • Buffaloe Milling Co. Inc.
        • Overview
        • Product Portfolio
        • Profitability by Market Segments (Product/Age /Sales Channel/Region)
        • Sales Footprint
        • Strategy Overview
          • Marketing Strategy
          • Product Strategy
          • Channel Strategy
      • Glen Miller
        • Overview
        • Product Portfolio
        • Profitability by Market Segments (Product/Age /Sales Channel/Region)
        • Sales Footprint
        • Strategy Overview
          • Marketing Strategy
          • Product Strategy
          • Channel Strategy
      • SunFlour
        • Overview
        • Product Portfolio
        • Profitability by Market Segments (Product/Age /Sales Channel/Region)
        • Sales Footprint
        • Strategy Overview
          • Marketing Strategy
          • Product Strategy
          • Channel Strategy
      • Archer Daniels Midland Company
        • Overview
        • Product Portfolio
        • Profitability by Market Segments (Product/Age /Sales Channel/Region)
        • Sales Footprint
        • Strategy Overview
          • Marketing Strategy
          • Product Strategy
          • Channel Strategy
      • General Mills Inc.
        • Overview
        • Product Portfolio
        • Profitability by Market Segments (Product/Age /Sales Channel/Region)
        • Sales Footprint
        • Strategy Overview
          • Marketing Strategy
          • Product Strategy
          • Channel Strategy
      • Bob’s Red Mill Natural Foods
        • Overview
        • Product Portfolio
        • Profitability by Market Segments (Product/Age /Sales Channel/Region)
        • Sales Footprint
        • Strategy Overview
          • Marketing Strategy
          • Product Strategy
          • Channel Strategy
      • King Arthur Flour
        • Overview
        • Product Portfolio
        • Profitability by Market Segments (Product/Age /Sales Channel/Region)
        • Sales Footprint
        • Strategy Overview
          • Marketing Strategy
          • Product Strategy
          • Channel Strategy
      • Ardent Mills LLC
        • Overview
        • Product Portfolio
        • Profitability by Market Segments (Product/Age /Sales Channel/Region)
        • Sales Footprint
        • Strategy Overview
          • Marketing Strategy
          • Product Strategy
          • Channel Strategy
      • Grain Craft
        • Overview
        • Product Portfolio
        • Profitability by Market Segments (Product/Age /Sales Channel/Region)
        • Sales Footprint
        • Strategy Overview
          • Marketing Strategy
          • Product Strategy
          • Channel Strategy
      • Italgrani USA
        • Overview
        • Product Portfolio
        • Profitability by Market Segments (Product/Age /Sales Channel/Region)
        • Sales Footprint
        • Strategy Overview
          • Marketing Strategy
          • Product Strategy
          • Channel Strategy
  19. Assumptions & Acronyms Used
  20. Research Methodology

List of Tables

  • Table 1: Global Market Value (USD Billion) Forecast by Region, 2020-2035
  • Table 2: Global Market Volume (Kilotons) Forecast by Region, 2020-2035
  • Table 3: Global Market Value (USD Billion) Forecast by Application, 2020-2035
  • Table 4: Global Market Volume (Kilotons) Forecast by Application, 2020-2035
  • Table 5: Global Market Value (USD Billion) Forecast by Distribution Channel, 2020-2035
  • Table 6: Global Market Volume (Kilotons) Forecast by Distribution Channel, 2020-2035
  • Table 7: North America Market Value (USD Billion) Forecast by Country, 2020-2035
  • Table 8: North America Market Volume (Kilotons) Forecast by Country, 2020-2035
  • Table 9: North America Market Value (USD Billion) Forecast by Application, 2020-2035
  • Table 10: North America Market Volume (Kilotons) Forecast by Application, 2020-2035
  • Table 11: North America Market Value (USD Billion) Forecast by Distribution Channel, 2020-2035
  • Table 12: North America Market Volume (Kilotons) Forecast by Distribution Channel, 2020-2035
  • Table 13: Latin America Market Value (USD Billion) Forecast by Country, 2020-2035
  • Table 14: Latin America Market Volume (Kilotons) Forecast by Country, 2020-2035
  • Table 15: Latin America Market Value (USD Billion) Forecast by Application, 2020-2035
  • Table 16: Latin America Market Volume (Kilotons) Forecast by Application, 2020-2035
  • Table 17: Latin America Market Value (USD Billion) Forecast by Distribution Channel, 2020-2035
  • Table 18: Latin America Market Volume (Kilotons) Forecast by Distribution Channel, 2020-2035
  • Table 19: Western Europe Market Value (USD Billion) Forecast by Country, 2020-2035
  • Table 20: Western Europe Market Volume (Kilotons) Forecast by Country, 2020-2035
  • Table 21: Western Europe Market Value (USD Billion) Forecast by Application, 2020-2035
  • Table 22: Western Europe Market Volume (Kilotons) Forecast by Application, 2020-2035
  • Table 23: Western Europe Market Value (USD Billion) Forecast by Distribution Channel, 2020-2035
  • Table 24: Western Europe Market Volume (Kilotons) Forecast by Distribution Channel, 2020-2035
  • Table 25: Eastern Europe Market Value (USD Billion) Forecast by Country, 2020-2035
  • Table 26: Eastern Europe Market Volume (Kilotons) Forecast by Country, 2020-2035
  • Table 27: Eastern Europe Market Value (USD Billion) Forecast by Application, 2020-2035
  • Table 28: Eastern Europe Market Volume (Kilotons) Forecast by Application, 2020-2035
  • Table 29: Eastern Europe Market Value (USD Billion) Forecast by Distribution Channel, 2020-2035
  • Table 30: Eastern Europe Market Volume (Kilotons) Forecast by Distribution Channel, 2020-2035
  • Table 31: East Asia Market Value (USD Billion) Forecast by Country, 2020-2035
  • Table 32: East Asia Market Volume (Kilotons) Forecast by Country, 2020-2035
  • Table 33: East Asia Market Value (USD Billion) Forecast by Application, 2020-2035
  • Table 34: East Asia Market Volume (Kilotons) Forecast by Application, 2020-2035
  • Table 35: East Asia Market Value (USD Billion) Forecast by Distribution Channel, 2020-2035
  • Table 36: East Asia Market Volume (Kilotons) Forecast by Distribution Channel, 2020-2035
  • Table 37: South Asia & Pacific Market Value (USD Billion) Forecast by Country, 2020-2035
  • Table 38: South Asia & Pacific Market Volume (Kilotons) Forecast by Country, 2020-2035
  • Table 39: South Asia & Pacific Market Value (USD Billion) Forecast by Application, 2020-2035
  • Table 40: South Asia & Pacific Market Volume (Kilotons) Forecast by Application, 2020-2035
  • Table 41: South Asia & Pacific Market Value (USD Billion) Forecast by Distribution Channel, 2020-2035
  • Table 42: South Asia & Pacific Market Volume (Kilotons) Forecast by Distribution Channel, 2020-2035
  • Table 43: Middle East and Africa Market Value (USD Billion) Forecast by Country, 2020-2035
  • Table 44: Middle East and Africa Market Volume (Kilotons) Forecast by Country, 2020-2035
  • Table 45: Middle East and Africa Market Value (USD Billion) Forecast by Application, 2020-2035
  • Table 46: Middle East and Africa Market Volume (Kilotons) Forecast by Application, 2020-2035
  • Table 47: Middle East and Africa Market Value (USD Billion) Forecast by Distribution Channel, 2020-2035
  • Table 48: Middle East and Africa Market Volume (Kilotons) Forecast by Distribution Channel, 2020-2035

List of Figures

  • Figure 1: Global Market Volume (Kilotons) Forecast 2020-2035
  • Figure 2: Global Market Pricing Analysis
  • Figure 3: Global Market Value (USD Billion) Forecast 2020-2035
  • Figure 4: Global Market Value Share and BPS Analysis by Application, 2025 and 2035
  • Figure 5: Global Market Y-o-Y Growth Comparison by Application, 2025-2035
  • Figure 6: Global Market Attractiveness Analysis by Application
  • Figure 7: Global Market Value Share and BPS Analysis by Distribution Channel, 2025 and 2035
  • Figure 8: Global Market Y-o-Y Growth Comparison by Distribution Channel, 2025-2035
  • Figure 9: Global Market Attractiveness Analysis by Distribution Channel
  • Figure 10: Global Market Value (USD Billion) Share and BPS Analysis by Region, 2025 and 2035
  • Figure 11: Global Market Y-o-Y Growth Comparison by Region, 2025-2035
  • Figure 12: Global Market Attractiveness Analysis by Region
  • Figure 13: North America Market Incremental $ Opportunity, 2025-2035
  • Figure 14: Latin America Market Incremental $ Opportunity, 2025-2035
  • Figure 15: Western Europe Market Incremental $ Opportunity, 2025-2035
  • Figure 16: Eastern Europe Market Incremental $ Opportunity, 2025-2035
  • Figure 17: East Asia Market Incremental $ Opportunity, 2025-2035
  • Figure 18: South Asia & Pacific Market Incremental $ Opportunity, 2025-2035
  • Figure 19: Middle East and Africa Market Incremental $ Opportunity, 2025-2035
  • Figure 20: North America Market Value Share and BPS Analysis by Country, 2025 and 2035
  • Figure 21: North America Market Value Share and BPS Analysis by Application, 2025 and 2035
  • Figure 22: North America Market Y-o-Y Growth Comparison by Application, 2025-2035
  • Figure 23: North America Market Attractiveness Analysis by Application
  • Figure 24: North America Market Value Share and BPS Analysis by Distribution Channel, 2025 and 2035
  • Figure 25: North America Market Y-o-Y Growth Comparison by Distribution Channel, 2025-2035
  • Figure 26: North America Market Attractiveness Analysis by Distribution Channel
  • Figure 27: Latin America Market Value Share and BPS Analysis by Country, 2025 and 2035
  • Figure 28: Latin America Market Value Share and BPS Analysis by Application, 2025 and 2035
  • Figure 29: Latin America Market Y-o-Y Growth Comparison by Application, 2025-2035
  • Figure 30: Latin America Market Attractiveness Analysis by Application
  • Figure 31: Latin America Market Value Share and BPS Analysis by Distribution Channel, 2025 and 2035
  • Figure 32: Latin America Market Y-o-Y Growth Comparison by Distribution Channel, 2025-2035
  • Figure 33: Latin America Market Attractiveness Analysis by Distribution Channel
  • Figure 34: Western Europe Market Value Share and BPS Analysis by Country, 2025 and 2035
  • Figure 35: Western Europe Market Value Share and BPS Analysis by Application, 2025 and 2035
  • Figure 36: Western Europe Market Y-o-Y Growth Comparison by Application, 2025-2035
  • Figure 37: Western Europe Market Attractiveness Analysis by Application
  • Figure 38: Western Europe Market Value Share and BPS Analysis by Distribution Channel, 2025 and 2035
  • Figure 39: Western Europe Market Y-o-Y Growth Comparison by Distribution Channel, 2025-2035
  • Figure 40: Western Europe Market Attractiveness Analysis by Distribution Channel
  • Figure 41: Eastern Europe Market Value Share and BPS Analysis by Country, 2025 and 2035
  • Figure 42: Eastern Europe Market Value Share and BPS Analysis by Application, 2025 and 2035
  • Figure 43: Eastern Europe Market Y-o-Y Growth Comparison by Application, 2025-2035
  • Figure 44: Eastern Europe Market Attractiveness Analysis by Application
  • Figure 45: Eastern Europe Market Value Share and BPS Analysis by Distribution Channel, 2025 and 2035
  • Figure 46: Eastern Europe Market Y-o-Y Growth Comparison by Distribution Channel, 2025-2035
  • Figure 47: Eastern Europe Market Attractiveness Analysis by Distribution Channel
  • Figure 48: East Asia Market Value Share and BPS Analysis by Country, 2025 and 2035
  • Figure 49: East Asia Market Value Share and BPS Analysis by Application, 2025 and 2035
  • Figure 50: East Asia Market Y-o-Y Growth Comparison by Application, 2025-2035
  • Figure 51: East Asia Market Attractiveness Analysis by Application
  • Figure 52: East Asia Market Value Share and BPS Analysis by Distribution Channel, 2025 and 2035
  • Figure 53: East Asia Market Y-o-Y Growth Comparison by Distribution Channel, 2025-2035
  • Figure 54: East Asia Market Attractiveness Analysis by Distribution Channel
  • Figure 55: South Asia & Pacific Market Value Share and BPS Analysis by Country, 2025 and 2035
  • Figure 56: South Asia & Pacific Market Value Share and BPS Analysis by Application, 2025 and 2035
  • Figure 57: South Asia & Pacific Market Y-o-Y Growth Comparison by Application, 2025-2035
  • Figure 58: South Asia & Pacific Market Attractiveness Analysis by Application
  • Figure 59: South Asia & Pacific Market Value Share and BPS Analysis by Distribution Channel, 2025 and 2035
  • Figure 60: South Asia & Pacific Market Y-o-Y Growth Comparison by Distribution Channel, 2025-2035
  • Figure 61: South Asia & Pacific Market Attractiveness Analysis by Distribution Channel
  • Figure 62: Middle East and Africa Market Value Share and BPS Analysis by Country, 2025 and 2035
  • Figure 63: Middle East and Africa Market Value Share and BPS Analysis by Application, 2025 and 2035
  • Figure 64: Middle East and Africa Market Y-o-Y Growth Comparison by Application, 2025-2035
  • Figure 65: Middle East and Africa Market Attractiveness Analysis by Application
  • Figure 66: Middle East and Africa Market Value Share and BPS Analysis by Distribution Channel, 2025 and 2035
  • Figure 67: Middle East and Africa Market Y-o-Y Growth Comparison by Distribution Channel, 2025-2035
  • Figure 68: Middle East and Africa Market Attractiveness Analysis by Distribution Channel
  • Figure 69: Global Market - Tier Structure Analysis
  • Figure 70: Global Market - Company Share Analysis

Frequently Asked Questions

How big is the corn flour market in 2025?

The global corn flour market is estimated to be valued at USD 20.6 billion in 2025.

What will be the size of the corn flour market in 2035?

The market size for corn flour is projected to reach USD 37.9 billion by 2035.

How much will be the corn flour market growth between 2025 and 2035?

The corn flour market is expected to grow at a 6.3% CAGR between 2025 and 2035.

Which application segment is projected to lead in the corn flour market in 2025?

The bakery and confectionery products segment is projected to lead in the corn flour market with 43% market share in 2025.

Which distribution channel segment is expected to dominate the corn flour market in 2025?

The hypermarkets/supermarkets segment is expected to dominate with 40% market share in 2025.

Explore Similar Insights

Future Market Insights

Corn Flour Market

Chat With

MaRIA

Hi There, I am MaRIA, Your Market Research Intelligence Assistant. How may I help you?