The Corn Puff Making Machine Market is estimated to be valued at USD 2.2 billion in 2025 and is projected to reach USD 4.6 billion by 2035, registering a compound annual growth rate (CAGR) of 7.6% over the forecast period.
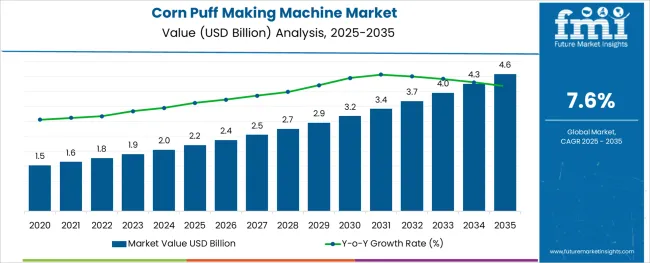
The corn puff making machine market is experiencing notable growth as automation, efficiency, and evolving consumer demand for convenient snacks shape industry dynamics. Rising global consumption of ready-to-eat and extruded snacks has accelerated the need for reliable, high-capacity production equipment.
Technological advancements enabling consistent quality, reduced wastage, and energy efficiency are encouraging adoption across diverse scales of operation. Future growth is expected to be supported by increasing investments in automated food processing lines, a shift toward healthier snack options driving innovation in formulations, and an expanding footprint of snack manufacturers in emerging economies.
Strategic collaborations between equipment manufacturers and food brands, as well as growing awareness of hygiene and compliance in production facilities, are paving the way for further market expansion and modernization.
The market is segmented by Mode of Operation, Application, and End User and region. By Mode of Operation, the market is divided into Automatic, Semi-automatic, and Manual. In terms of Application, the market is classified into Commercial and Household. Based on End User, the market is segmented into Food Processors, HoReCa, and Other Applications. Regionally, the market is classified into North America, Latin America, Western Europe, Eastern Europe, Balkan & Baltic Countries, Russia & Belarus, Central Asia, East Asia, South Asia & Pacific, and the Middle East & Africa.
The market is segmented by Mode of Operation, Application, and End User and region. By Mode of Operation, the market is divided into Automatic, Semi-automatic, and Manual. In terms of Application, the market is classified into Commercial and Household. Based on End User, the market is segmented into Food Processors, HoReCa, and Other Applications. Regionally, the market is classified into North America, Latin America, Western Europe, Eastern Europe, Balkan & Baltic Countries, Russia & Belarus, Central Asia, East Asia, South Asia & Pacific, and the Middle East & Africa.
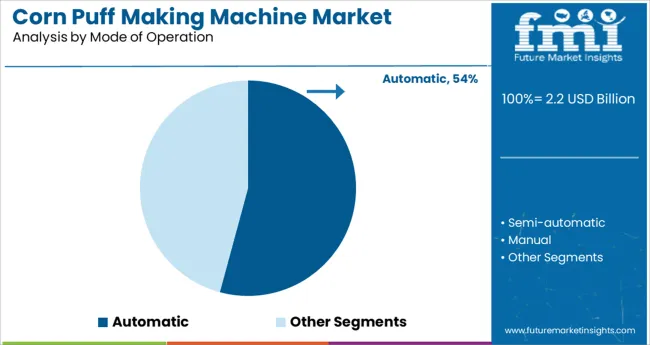
When segmented by mode of operation, the automatic segment is projected to command 54.2% of the total market revenue in 2025, asserting itself as the leading operational mode. This leadership has been driven by the growing demand for uninterrupted production lines capable of delivering consistent product quality with minimal human intervention.
Automation has allowed manufacturers to improve throughput, reduce labor costs, and ensure compliance with stringent hygiene standards. The integration of programmable controls, real-time monitoring, and self-cleaning mechanisms has further enhanced the appeal of automatic machines by minimizing downtime and operational errors.
These attributes have reinforced the segment’s prominence, as efficiency, scalability, and reliability have become critical factors in meeting increasing market demand.
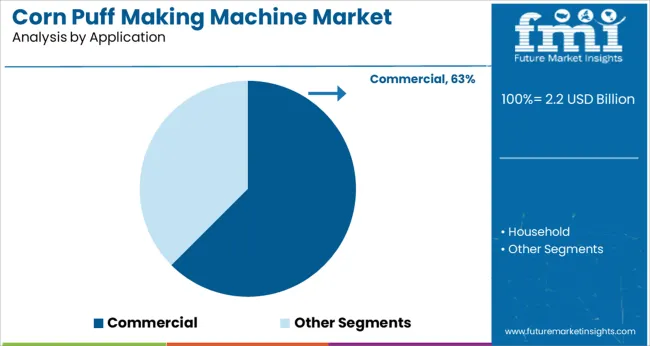
In terms of application, the commercial segment is expected to account for 62.5% of the market revenue in 2025, establishing itself as the most significant application area. This dominance has been attributed to the robust demand from large-scale snack producers and contract manufacturers seeking high-volume production capabilities.
Commercial operations have benefited from machines designed to handle extended production runs with precision and efficiency, supporting the growth of branded and private label snack offerings. The need to meet diverse consumer tastes and packaging requirements has encouraged commercial producers to invest in versatile and reliable machinery, capable of accommodating various formulations and shapes.
The emphasis on operational efficiency and output consistency has reinforced the commercial segment’s leadership in the market.
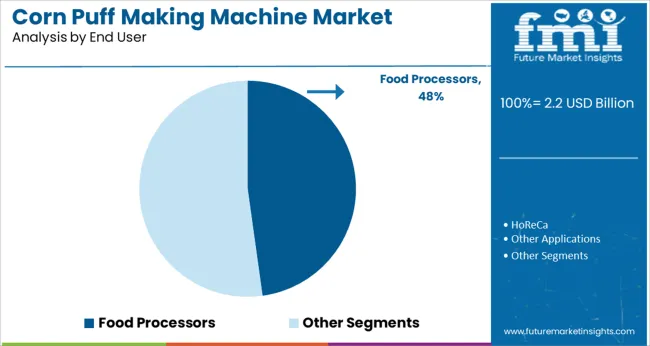
Segmented by end user, food processors are anticipated to hold 47.8% of the market revenue in 2025, making them the leading end user segment. This position has been supported by the pivotal role food processors play in bridging agricultural inputs with consumer-ready products.
Their ability to leverage economies of scale, invest in advanced machinery, and innovate in product development has driven higher adoption rates of corn puff making machines. Food processors have prioritized machinery that ensures product consistency, safety, and adaptability to evolving consumer trends, which has been instrumental in securing their leading share.
The combination of strong distribution networks and a focus on operational excellence has further consolidated the dominance of food processors within the market landscape.
Based on the research conducted by FMI, North America is expected to be the largest corn puff making machine market.
North America is also the largest potato chip market. As of 2024, the North American potato chips market was valued at USD 15.4 billion, which was nearly 50% of the market share.
The manufacturers in the North American potato chips market are bringing in different flavors to expand the product portfolio. In this bid to expand, the key manufacturers in the potato chips market are also making use of puffed corn, which is obtained from corn puff making machines.
The best thing is that the puffed corn potato chips are loved by consumers, as a result of which the sales of this flavor are anticipated to increase over the forecast period.
The popcorn market in Europe is valued at close to USD 2 billion.
The puffed corn in the region is molded in the same shape as that of popcorn, and even the taste is said to resemble that of popcorn to an extent. Apart from that, being a rich source of Vitamin B, Zinc, Magnesium, and Iron, the consumers in the region have started adopting puff corns, which are derived from corn puff making machines. This is expected to increase the demand for corn puff machines over the forecast period.
The Asia Pacific maze market is expected to grow at a CAGR of around 7%, which is much higher than the anticipated global CAGR of around 3.9%.
This makes the Asia Pacific one of the most sought-after corn puff making machine markets. The manufacturers pertaining to the corn business are making use of corn puff making machines to target the right sectors. Some of them are getting involved in strategic partnerships with a few of the big players in the food sector, like Lay’s India.
Thus, strategic partnerships are expected to be the game changer for the key players in the Asia Pacific corn puff making machine market.
On comparing the historical CAGR with the anticipated CAGR, we get a sense of the rising importance of the corn puff making machine in the coming years.
With a burgeoning global food market and an increase in disposable income, it is expected that the corn puff making machine market would continue displaying an upward trend. While the historical CAGR for the market stood at 6.3%, the anticipated CAGR for the forecast period is expected to be 7.6%. Furthermore, the market's future appears to be promising right now because people all over the world desire to explore new cuisines.
| Attributes | Value |
|---|---|
| Corn Puff Making Machine Market Value (2025) | USD 1.8 billion |
| Corn Puff Making Machine Market Value (2025) | USD 1.9 billion |
| Corn Puff Making Machine Market Forecast Value (2035) | USD 4 billion |
| Corn Puff Making Machine Market Expected CAGR (2025 to 2035) | 7.6% |
Increased production rate:
The corn puffs can be made by hand. But the usage of corn puff making machine ensures that more corn puffs can be generated in a limited time, thereby making them one of the most sought-after industrial equipment.
Ability to deliver the desired shape:
The corn puff making machines come with an amazing ability to deliver the required shape and size. This helps the business to save time and focus more on the core functionalities related to industrial manufacturing.
Easy installation:
The installation of the corn puff making machine is quite simple, and the machine also offers the benefits of smooth working and easy maintenance as well.
Multi-functionality:
The corn puff making machines serve a variety of purposes, which include mixing, extruding, drying, flavoring, and packing.
Wide range:
The corn puff making machine market does not work on the basis of one size fits all. There are a variety of corn puff making machines, and these have been developed keeping in mind a wide consumer demand. This as well is expected to increase the adoption of corn puff making machines.
However, one of the restraints that stand in the way of the corn puff making machine market is the high cost. The corn puff making machine price is something that can’t be afforded by all the players, and only a few giants can buy them in bulk.
The price of corn puff production machines is something that not all of the participants can afford, and only a few significant market players can buy them in quantity.
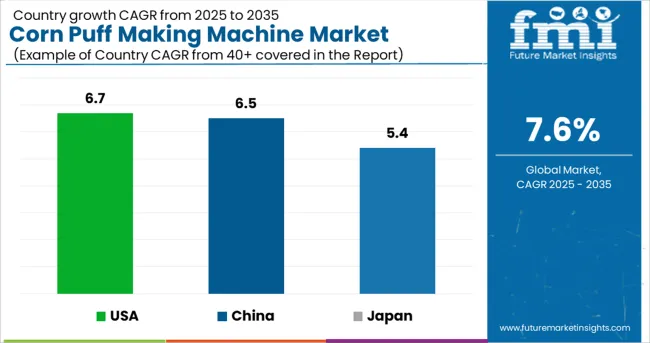
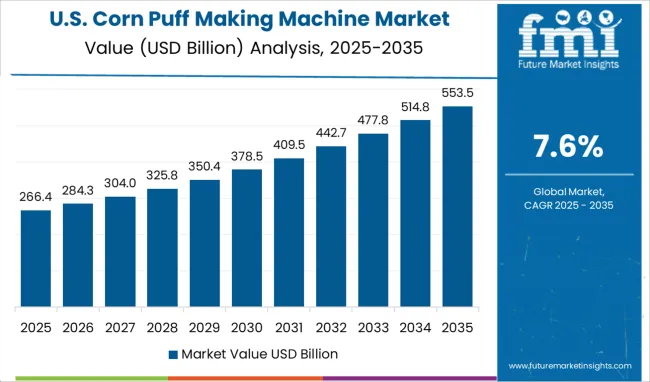
The USA corn puff making machine market is expected to register at a CAGR of 6.7% over the forecast period. The market is expected to hold a valuation of USD 4.6 bn by 2035, and as of 2025, the market is valued at USD 658 million.
The historic CAGR for the market was 6%.
The USA is currently the largest packaged food market and held a valuation of close to USD 2 bn in 2024. Puffed corn is increasingly used in the packaged food market in the form of chips. Apart from that, they are also increasingly employed in fast-food services to enhance the taste of certain dishes.
By 2035, the United Kingdom corn puff-making machine market is expected to reach a valuation of USD 2.2 million. The market is expected to register at a CAGR of 5.8% over the forecast period, and as of 2025, the market is valued at USD 88.6 million.
The historical CAGR for the market was 5%.
The bread market in the United Kingdom was valued at close to USD 20,000 million as of 2024. Since then, the market has been registering a CAGR of around 3% in the region.
The corn puffs that are obtained from the corn puff making machine market are used in the cheese or other toppings that are applied on the bread to enhance its taste. This is expected to surge the sales of corn puff making machines in the United Kingdom.
The China corn puff making machine market is expected to register at a CAGR of 6.5% over the forecast period. The market is expected to reach a valuation of USD 270.1 million by 2035, and as of 2025, the market is valued at USD 143.4 million.
The historical CAGR for the market was 5.5%. A jump from 5.5% to 6.5% indicates that the market has a lot to offer and China as a whole has a thriving food sector.
The bakery products mainly make use of puffed corn that is obtained from corn puff making machines to enhance the taste of these products. Of late, the key players who are into bakery products have started adopting more of these puffed corn because of their nutritional value.
The Japan corn puff making machine market is expected to register at a CAGR of 5.4% over the forecast period. The market is valued at USD 127.3 million as of 2025, and by 2035, the market is expected to reach a valuation of USD 2.26.1 million.
The historical CAGR for the market was 4.4%. Owing to the huge snacks market in Japan, the market is expected to grow over the forecast period.
The Japanese snacks market held a valuation of close to USD 2 bn in 202.2, and the market has been expanding at a CAGR of around 3.2%. Increased usage of puffed corn in snacks is expected to increase the sales of corn puff making machines in Japan.
The South Korean corn puff making machine market is expected to register at a CAGR of 4.5% over the forecast period. The market is expected to reach a valuation of USD 124.2 million by 2035, and as of 2025, the market holds a valuation of USD 80.3 million.
The historical CAGR of the market was 3.8%.
South Korea has been witnessing a growing mobile food services market, which holds a valuation of USD 2.2 billion as of 2025, and is expected to register at a CAGR of 6% over the forecast period. The mobile food service businesses have been increasingly making use of puffed corn because firstly not much time is spent in their preparation. Secondly, they present a perfect balance of taste as well as nutrition.
The manual segment currently has the highest market share and is expected to surge at a CAGR of 5.2% over the forecast period.
The historical CAGR for the market was 5.8%.
With the development of the technology and implementation of automation techniques, it is expected that the automatic segment would have the maximum market share by the end of the forecast period. Moreover, minimum human intervention in the automatic process is further expected to fuel the market growth over the forecast period.
The commercial segment has the highest market share and is expected to register at a CAGR of 7.9% over the forecast period.
The historical CAGR for the market was 6.5%.
The commercial segment generally involves bulk purchases of these corn puff making machines. Moreover, because of continuous usage, they are involved in the frequent purchase of these items, because of which the commercial segment is expected to have the highest market share during the forecast period as well.
The key players in the corn puff making machine market are focusing on making use of the latest technologies in order to increase the precision and efficiency of these machines.
Apart from that, the focus has also been on the process of developing strategic partnerships. The intention is to focus more on making use of equipment which is provided by the key players from another sector.
Some of the recent developments are
Guangzhou Shining Equipment, Shandong Loyal Industrial Co. Ltd., and Grace Food Processing and Packaging Machinery have been manufacturing the best quality corn puff making machines to stay at the top of the market
Guangzhou Shining Equipment started engaging in the grain processing industry in the 1980s. The company has witnessed the transformation from being operated by 2 people to a large modern factory. The company is spread over 100,000 square meters, making use of two machinery production workshops, three finished product warehouses, one exhibition hall, a large grain warehouse, and a corn oil processing demonstration base.
Guangzhou Shining Equipment currently employs more than 150 people. The company has proved to be a one-stop service for Research and Development, Design, Production, Domestic and Foreign Sales, Installation and maintenance, and related industry integration.
On 19th October’22, the company exhibited at the 132nd Online Canton Fair through live video and VR showroom technology.
Shandong Loyal Industrial Co. Ltd. is a leading manufacturer of Snacks Extruder Machine, Industrial Microwave Oven, and Corn Flakes Production Line. As a leading manufacturer of food processing equipment, the company is always in search of new solutions that benefit snack food customers.
The company believes in maintaining close collaboration with its customers. It has always laid heavy emphasis on developing custom-made food processing equipment to match customer needs.
On 31st August’22, Shandong Loyal Industrial Co. Ltd. introduced its wide range of Kurkure manufacturing machines and elaborated on how the implementation of the latest technology by the company assisted it in developing top-quality machines.
Grace Food Processing and Packaging Machinery is the leading manufacturer and explorer of packaging machines in India along with food processing machines and complete snacks processing machines.
The company is specifically known for its dedication towards its clients and has always worked towards developing the best machinery.
The global corn puff making machine market is estimated to be valued at USD 2.2 billion in 2025.
It is projected to reach USD 4.6 billion by 2035.
The market is expected to grow at a 7.6% CAGR between 2025 and 2035.
The key product types are automatic, semi-automatic and manual.
commercial segment is expected to dominate with a 62.5% industry share in 2025.


Our Research Products

The "Full Research Suite" delivers actionable market intel, deep dives on markets or technologies, so clients act faster, cut risk, and unlock growth.

The Leaderboard benchmarks and ranks top vendors, classifying them as Established Leaders, Leading Challengers, or Disruptors & Challengers.

Locates where complements amplify value and substitutes erode it, forecasting net impact by horizon

We deliver granular, decision-grade intel: market sizing, 5-year forecasts, pricing, adoption, usage, revenue, and operational KPIs—plus competitor tracking, regulation, and value chains—across 60 countries broadly.

Spot the shifts before they hit your P&L. We track inflection points, adoption curves, pricing moves, and ecosystem plays to show where demand is heading, why it is changing, and what to do next across high-growth markets and disruptive tech

Real-time reads of user behavior. We track shifting priorities, perceptions of today’s and next-gen services, and provider experience, then pace how fast tech moves from trial to adoption, blending buyer, consumer, and channel inputs with social signals (#WhySwitch, #UX).

Partner with our analyst team to build a custom report designed around your business priorities. From analysing market trends to assessing competitors or crafting bespoke datasets, we tailor insights to your needs.
Supplier Intelligence
Discovery & Profiling
Capacity & Footprint
Performance & Risk
Compliance & Governance
Commercial Readiness
Who Supplies Whom
Scorecards & Shortlists
Playbooks & Docs
Category Intelligence
Definition & Scope
Demand & Use Cases
Cost Drivers
Market Structure
Supply Chain Map
Trade & Policy
Operating Norms
Deliverables
Buyer Intelligence
Account Basics
Spend & Scope
Procurement Model
Vendor Requirements
Terms & Policies
Entry Strategy
Pain Points & Triggers
Outputs
Pricing Analysis
Benchmarks
Trends
Should-Cost
Indexation
Landed Cost
Commercial Terms
Deliverables
Brand Analysis
Positioning & Value Prop
Share & Presence
Customer Evidence
Go-to-Market
Digital & Reputation
Compliance & Trust
KPIs & Gaps
Outputs
Full Research Suite comprises of:
Market outlook & trends analysis
Interviews & case studies
Strategic recommendations
Vendor profiles & capabilities analysis
5-year forecasts
8 regions and 60+ country-level data splits
Market segment data splits
12 months of continuous data updates
DELIVERED AS:
PDF EXCEL ONLINE
Popcorn Making Cart Market Growth - Demand & Forecast 2025 to 2035
Corn Milling Machine Market Size and Share Forecast Outlook 2025 to 2035
Bag Making Machine Market Size and Share Forecast Outlook 2025 to 2035
Brick Making Machines Market Size and Share Forecast Outlook 2025 to 2035
Sauce Making Machine Market Size and Share Forecast Outlook 2025 to 2035
Paper Making Machines Market
Flakes Making Machine Market Size and Share Forecast Outlook 2025 to 2035
Paper Napkin Making Machine Market Analysis, Size, Share & Forecast 2025 to 2035
Concrete Block Making Machines Market Size and Share Forecast Outlook 2025 to 2035
Corrugated Box Making Machine Market Size and Share Forecast Outlook 2025 to 2035
Commercial Ice Making Machine market
Fish Feed Pellet Making Machine Market Size and Share Forecast Outlook 2025 to 2035
Center Seal Pouch Making Machine Market
Automatic Clay Brick Making Machine Market
Fully Automatic High Speed Nail Making Machine Market Size and Share Forecast Outlook 2025 to 2035
Machine Glazed Paper Market Size and Share Forecast Outlook 2025 to 2035
Machine Glazed Kraft Paper Market Forecast and Outlook 2025 to 2035
Machine Condition Monitoring Market Size and Share Forecast Outlook 2025 to 2035
Machine Glazed Paper Industry Analysis in Asia Pacific Forecast Outlook 2025 to 2035
Machine Vision Camera Market Size and Share Forecast Outlook 2025 to 2035

Thank you!
You will receive an email from our Business Development Manager. Please be sure to check your SPAM/JUNK folder too.
Chat With
MaRIA