Reports

- Global Locations -

Headquarters

Future Market Insights, Inc.

Christiana Corporate, 200
Continental Drive, Suite 401,
Newark, Delaware - 19713,
United States

T: +1-845-579-5705

Americas

Future Market Insights, Inc.

616 Corporate Way, Suite 2-9018,
Valley Cottage, NY 10989, United States

T: +1-347-918-3531

MEA

Future Market Insights

1602-6 Jumeirah Bay X2 Tower, Plot No: JLT-PH2-X2A,
Jumeirah Lakes Towers, Dubai,
United Arab Emirates

Europe

Future Market Insights

3rd Floor, 207 Regent Street,
W1B 3HH London
United Kingdom

T: + 44 (0) 20 8123 9659
D: +44 (0) 20 3287 4268

Asia Pacific

Future Market Insights

IndiaLand Global Tech Park, Unit UG-1, Behind Grand HighStreet, Phase 1, Hinjawadi, MH, Pune – 411057, India

Corn Milling Machine Market Outlook (2023 to 2033)

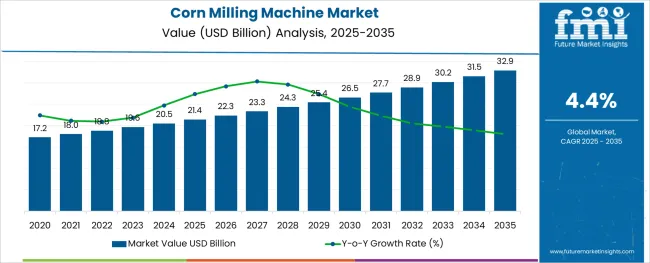
The global corn milling machine market is expected to hold a valuation of US$ 30177.17 million by 2033. The market is expected to grow at a moderate CAGR of 4.4% during the forecast period. As of 2023, the market is valued at US$ 19618.85 million.

Some of the factors that are expected to surge the industrial corn milling machine market growth are:

  • Technological innovations have increased the efficiency of the corn milling process.
  • Increased consumption of corn owing to its high nutritional value.
  • Ever expanding global food market was valued at a mammoth US$ 8.27 trillion, as per the survey conducted by Statista.

Don't pay for what you don't need

Customize your report by selecting specific countries or regions and save 30%!

Surging leather industry shows immense growth opportunities for the corn milling machine market in China

The China corn milling machine market is valued at US$ 1589.13 million as of 2023. By 2033, the China market is expected to reach a valuation of 3659.77 million, thereby growing at an above-average anticipated CAGR of 8.7%.

If we compare the historical CAGR (2018 to 2023) of the China corn milling machine market with the anticipated CAGR, not much growth is observed. But the point to watch out for is that the scope of usage has surely increased, which is visible in the numbers. The historical CAGR was 8.1%, while the anticipated CAGR is 8.7%

Based on a research study, the leather industry was valued at US$ 1.28 billion from January 2021 to July 2021. These figures suggest potential gains for the corn milling machine market. The purest form of corn that is obtained after the corn is processed inside an electric corn grinder machine is utilized by the leather industry. The corn-based leathers are being increasingly employed because of the high durability associated with them. Apart from that, Chinese manufacturers have also opined that corn-based leathers are gaining traction because of the smoothness and elasticity associated with them.

High consumption of corn-based drinks presents huge opportunities for the corn milling machine market in the United Kingdom

The United Kingdom corn milling machine market is valued at US$ 1039.80 as of 2023. The United Kingdom market is expected to grow at a CAGR of 4.6% during the forecast period and is anticipated to hold a valuation of US$ 1630.30 million by 2033.

While the historic CAGR (2018 to 2023) was valued at 3.9%, the anticipated CAGR for the forecast period stands at US$ 4.6%. This certainly showcases huge growth opportunities in the United Kingdom market. The finest form of corn that is obtained from the corn processing equipment is used for preparing corn-based spirits, which are mainly used as part of cocktails. The owners of casinos, restaurants, and pubs are of the view that the consumers are generally awestruck by the grassy and vegetal nature of these corn-based cocktails.

Nandini Roy Choudhury

Principal Consultant

Talk to Analyst

Find your sweet spots for generating winning opportunities in this market.

Huge consumption of chewing gum in Asia-Pacific presents a huge potential in front of the corn milling machine market in the region

Based on the survey conducted by FMI, it was found that Asia Pacific is the fastest-growing chewing gum market, and the market is expected to grow at a CAGR of 7% during the forecast period.

Corn syrup that is being used for manufacturing the chewing gums is obtained after thorough processing of corn in the corn milling machine. This is well expected to increase the demand for corn milling equipment during the forecast period.

Attributes Value
Corn Milling Machine Market Value (2022) US$ 18792 million
Corn Milling Machine Market Value (2023) US$ 19618.85 million
Corn Milling Machine Market Forecast Value (2033) US$ 30177.17 million
Corn Milling Machine Market Expected CAGR (2023 to 2033) 4.4%

Historical CAGR (2018 to 2023) vs Anticipated CAGR for the Corn Milling Machine Market

On comparing the historical CAGR with the anticipated CAGR, we see that the market is expected to grow at a considerable rate during the forecast period. The historic CAGR was 3.2%, and the anticipated CAGR was 4.4%.

An increase in the production of corn syrup, along with the increased usage of corn in food starch and ethanol, is expected to increase the corn milling machine market share.

Get the data you need at a Fraction of the cost

Personalize your report by choosing insights you need
and save 40%!

Drivers for Corn Milling Machine Market

Simple operation

One of the biggest drivers of the adoption of corn machines is that they are simple to operate and do not require any technical specialization.

Low energy consumption

The investors are particularly interested in making use of corn milling machines because of the fact that the energy consumption is much lower than expected. This helps manufacturers achieve considerable cost-cutting.

Low maintenance cost

The maintenance cost associated with the corn milling machine is quite low. Apart from that, the installation of these machines is quite easy as well, which motivates businessmen to invest the required amount for the corn milling machines.

Restraints for Corn Milling Machine Market

Low production efficiency

The quantity of end products obtained from the use of the corn milling machine is quite less. Because of this, these machines need to be put into operation on a continuous basis to produce the required output at a given point in time. This might challenge the demand for corn milling machines during the forecast period.

The short life of spare parts

The spare parts have a short lifespan. Thus, they have to be replaced on a consistent basis, as a result of which the companies need to undergo unnecessary expenditures. This as well might hamper the growth of the corn milling machine market.

Growing Awareness regarding the Benefits of consuming Corn present huge opportunities in front of the Corn Milling Machine Market

Being a rich source of protein, fiber, and Vitamin C, nutritionists and doctors always recommend the optimum consumption of corn.

Apart from that, certain multivitamin capsules contain some amount of corn that has been processed from a corn milling machine. Thus, the increased usage of corn in the healthcare sector presents huge opportunities for the corn milling machine market.
Comparative View for Corn Milling Machine Market

Corn Milling Machine Market:

Attributes Corn Milling Machine Market
Anticipated CAGR (2023 to 2033) 4.4%
Market Value (2023) US$ 19618.85 million
Growth Factor Simple operation, coupled with low maintenance is surging the growth of the corn milling machine market.
Future Opportunities Growing awareness regarding the benefits of consuming corn to surge the growth of the corn milling machine market in the future.
Market Trends Increased consumption of corn-based drinks in certain parts of the world currently boosting market growth.

Corn Wet Milling Services Market:

Attributes Corn Wet Milling Services Market
Anticipated CAGR (2023 to 2033) 5%
Market Value (2023) US$ 80 billion
Growth Factor Increased consumption of corn starch, corn edible oil, and corn syrup, currently driving the corn wet milling services market.
Future Opportunities Increased technological advancements present huge opportunities to the corn-wet milling services market.
Market Trends Currently, the corn wet milling services market is experiencing capacity expansion and increased corn supply, which is apparently great news for the market.

Corn Co-products Market:

Attributes Corn Co-products Market
Anticipated CAGR (2023 to 2033) 3.1%
Market Value (2023) US$ 6 billion
Growth Factor Increased consumption of corn gluten meal in the hog feed industry is currently driving the demand for corn co-products.
Future Opportunities Increasing awareness regarding the side effects of consuming chemically derived herbicides is expected to drive the corn co-products market during the forecast period.
Market Trends The corn co-products are being fed to cattle, because of the presence of crude protein. This is expected to surge the sales of corn co-products.

Country-wise Insights

Humongous Healthcare Sector in USA to present enormous openings for Corn Milling Machine Market

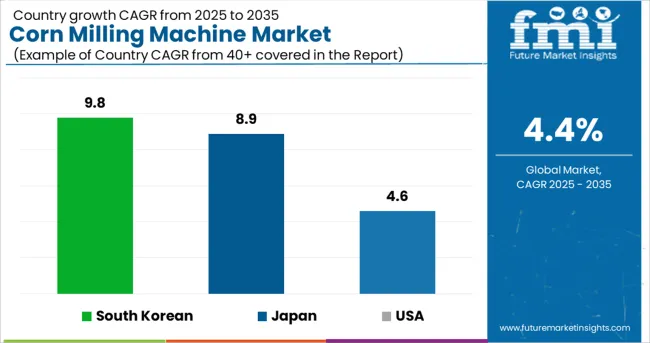
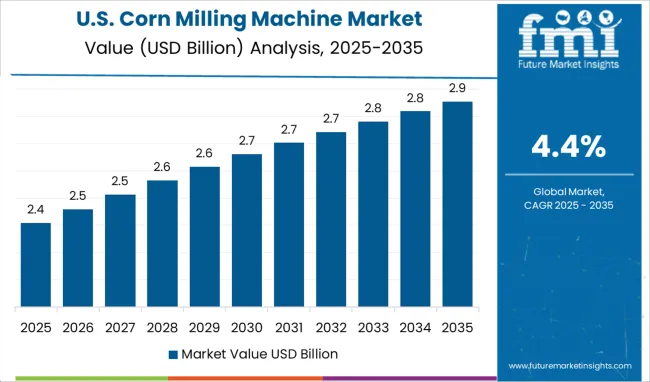
The USA corn milling machine market is expected to grow at a CAGR of 4.6% during the period 2023 to 2033. As of 2023, the market is valued at US$ 5885.65 million, and by 2032, the market is expected to reach a valuation of US$ 9228.09 million.

While the historic CAGR (2018 to 2023) stood at 3.5%, the expected CAGR for the forecast period is 4.6%. The statistics depict a decent jump, and all this is attributed to the key players from other sectors realizing the importance of corn.

The healthcare sector in the USA is expected to reach a valuation of US$ 6.2 trillion by 2028. The healthcare sector in the USA has been making use of the fine forms of corn that is obtained from corn milling machine.

Being an excellent source of manganese, Zinc, Phosphorous, and many other nutrients makes corn an integral part of a lot of multi-vitamin tablets and syrups.

The huge Bakery Products Market in Europe boasts massive opportunities for the Corn Milling Machine Market

In 2020, the bakery products market in Europe was valued at close to US$ 140 billion.

The manufacturers in Europe are of the view that the usage of processed corn for livestock feed for industrial purposes has yielded positive results.

Apart from that, flint corn, after being processed by corn milling machines, is being used for the preparation of hominy and grits. Flint corn is known to possess high nutritional value because of which the manufacturers make use of them after getting them processed through milling machines.

Moreover, bakery product manufacturers are increasingly making use of masa harina for making tortillas, as these are easy to digest.

Thus, the different ways of making use of fine corn obtained from corn milling machines for bakery products present huge prospects for the market going ahead.

Emerging Sealant and Adhesives Market in Japan likely to surge Corn Milling Machine Market

The Japan corn milling machine market is expected to grow at a robust CAGR of 10.1% during the forecast period. The corn milling machine market in Japan has a valuation of US$ 1373.32 million as of 2023, and by 2033, the market is expected to reach a valuation of US$ 3594.55 million.

The historical CAGR (2018 to 2023) for the Japanese market was 8.9%. An increase from 8.9% to the proposed 10.1% speaks volumes about the market.

In 2021, the Japan sealant and adhesives market was valued at US$ 3 billion, and it is expected that the market would continue to progress.

In a bid to offer innovative solutions, the adhesives market is making use of unique methods to provide seamless adhesiveness.

The corn germs that are the leftovers from the corn milling machine market are used to increase adhesiveness. Moreover, cornstarch is used to activate the stickiness of the industrial glues. Apart from glue sticks, the fine corn particles that are obtained from the corn milling machines are also used in glue sticks and plywood glues.

Emerging Chemical Sector in South Korea to present beam of hope to the Corn Milling Machine Market

The South Korean corn milling machine market is expected to hold a valuation of US$ 1504.47 million by 2033. The corn milling machine market in South Korea is valued at US$ 549.33 million as of 2023, and the market is expected to grow at a CAGR of sturdy 10.6% during the forecast period.

The historical CAGR (2018 to 2023) for the market was 9.8%. An increase in the value is definitely a good sign for the market.

The chemical market in South Korea is valued at close to US$ 10 billion. The South Korean chemical industry has been into producing ethanol from corn.

The versatile and biodegradable nature of these fine corn particles has literally caught the eyeballs of manufacturers from the chemical sector. Moreover, the biodegradable polymers that are obtained from corn are gradually replacing synthetic chemicals in certain areas of the South Korean chemical market.

Owing to its renewable and environment-friendly properties, the corn particles that are obtained from corn milling machines are being utilized for manufacturing chemicals for biomedicine and drug delivery systems.

Segmentation Insights

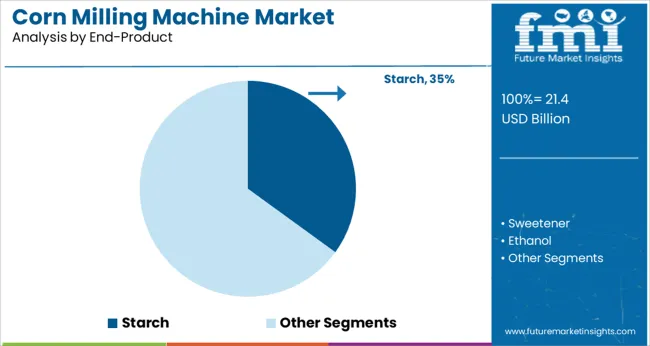
Based on the End-product, the Starch segment expected to have the Highest Market Share during the Forecast Period

According to FMI analysis, the starch segment is expected to have the highest market share. The CAGR of the segment during the forecast period is expected to be 4.5%, and the historical CAGR (2018 to 2023) for the segment was 3.7%.

Starch is being increasingly used for consumption purposes in gravies, sauces, casseroles, etc. Being a source of potassium, nutritionists prescribe certain people to consume them in moderation.

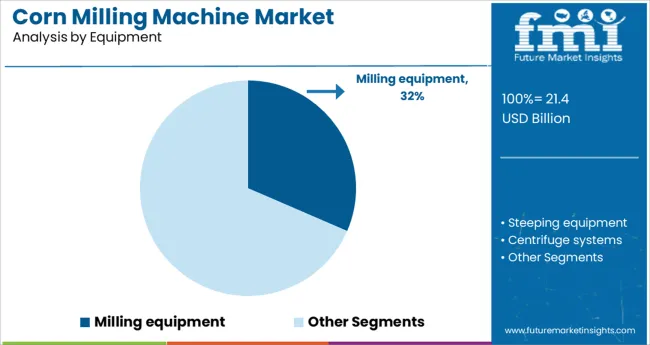
Based on the Equipment, the Centrifuge Systems are expected to have the Highest Market Share during the Forecast Period

The centrifuge systems segment is expected to have the highest market share during the forecast period. The segment is expected to surge with a CAGR of 5.7% during the forecast period, while the historical CAGR (2018 to 2023) was 4.9%.

The centrifuge systems are known to perform the most crucial task of separating the corn from the germs. Moreover, the system has to be replaced on a regular basis, as its operational life is quite less.

Start-up Ecosystem

The corn milling machine market is currently dominated by key players who have been serving the niche for decades altogether. They have been contributing to the market growth by developing innovative solutions and by implementing the latest technologies.

The start-up ecosystem is relatively quiet, and there is not much happening in this space. But, with diverse sectors understanding the importance of utilizing the processed corn that is obtained from corn milling machines, the market seems to have a bright future ahead.

If aspiring entrepreneurs are falling short of funds, they can take the help of venture capitalists and angel investors, and all they require is a brilliant idea to receive funding from them. So, this virtually untapped market has a lot to offer.
Competitive Landscape

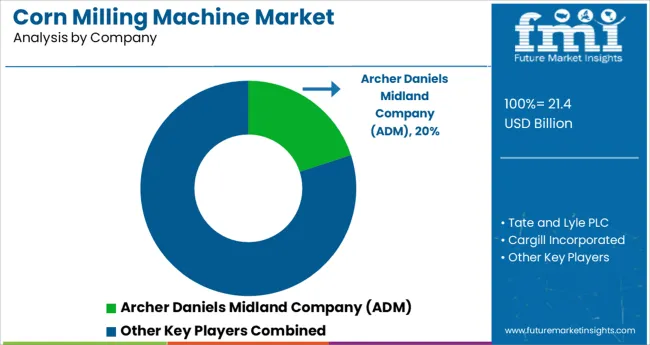
The key players in the corn milling machine market are investing heavily in the Research and Development to develop technologically advanced corn milling machines. Apart from that, they are also investing in developing strategic partnerships with key players from other niches to invest in knowledge sharing and technology sharing.

Some of the recent developments are

  • In September 2022, Tata and Lyle announced that it would feature comprehensive solutions for the future of the bakery at IBIE 2022.
  • In September 2022, Pepsico and Archer Daniel Midland Company announced a groundbreaking agreement that aims at reducing Carbon Intensity by supporting regenerative agricultural practices on up to 2 million acres of farmland.

Cargill Incorporate, Agrana Beteiligungs-AG, The Roquette Feres, and Bunge Limited are taking every possible measure to serve the end customers with the best possible products and services Bunge Limited has a diverse and talented team who makes Bunge the most innovative and dynamic company in the industry. They have always strived for excellence by being agile, innovative, and efficient.

The team is consistently looking for ways to bring an innovative portfolio of products to those who need it the most. Moreover, Bunge has always been into improving its integrated operations to provide the highest level of quality and safety to food, thereby bringing together consumer demands and science to meet customer needs.

On 13th October’22, Olleco and Bunge agreed to a joint venture to create a full life cycle oil collection business in Europe.

Roquette is a global leader in plant-based ingredients and a pioneer of plant proteins. In collaboration with its customers and partners, the company has been addressing current and future societal challenges by providing the best quality ingredients for food, nutrition, and health markets. These enable healthier lifestyles and are critical components of life-saving medicines.

Roquette is committed to reducing greenhouse gas emissions by 25% between 2021 and 2030. The company has been putting sustainable development at the heart of every concern.

On 13th October’22, Roquette launched a new line of organic pea ingredients to address consumer demand. These ingredients are produced at its plant in Portage la Prairie and are supported by a network of organic pea growers from Canada.

Cargill Incorporate and Agrana Beteiligungs-AG has been providing food, agriculture, financial, and industrial products, and services to the world. Along with farmers and customers, they put into application the wide experience that they have accumulated over the past 155 years.

The company has nearly 155,000 employees across 70 countries who are committed to feeding the world in a responsible way.

On 10th January’22, Cargill opened its first Food Innovation Center in India to address the growing consumer demand for healthy, nutritious food solutions.

Key Companies Profiled

  • Tate and Lyle PLC (United Kingdom)
  • Archer Daniel Midland Company
  • Cargil Incorporate
  • Agrana Beteiligungs-AG
  • The Roquette Feres
  • Bunge Limited
  • China Agri-industries Holding Limited
  • Global Bio-Chem Technology group company
  • Grain Processing Corporation

Corn Milling Machine Market Segmentation

By End-product:

  • Starch
  • Sweetener
  • Ethanol
  • Corn Gluten Meal and Gluten Food
  • Others (corn oil, proteins, corn germ meal, and steep oil)

By Application:

  • Feed
  • Food
  • Industrial

By Source:

  • Dent Corn
  • Waxy Corn

By Equipment:

  • Milling Equipment
  • Steeping Equipment
  • Centrifuge Systems
  • Washing & Filtration Systems
  • Other (heating and cooling systems, dryers, and other utility equipment)

By Region:

  • North America
  • Latin America
  • Europe
  • Oceania
  • Middle East and Africa
  • East Asia
  • South Asia

Frequently Asked Questions

What is the Corn Milling Machine Market Size as on 2023?

The corn milling machine market is valued at US$ 19618.85 million as of 2023.

At what rate is the Global Corn Milling Machine Market expected to grow?

The corn milling machine market is expected to grow at a CAGR of around 4.4% over the forecast period.

What is the Expected Valuation of Corn Milling Machine Market by 2033?

By 2033, the corn milling machine market is expected to be valued at US$ 30177.17 million.

What are the Challenges experienced by the Corn Milling Machine Market?

Some of the challenges are: low production efficiency, and short life of spare parts.

What are the Main Drivers for Corn Milling Machine Market?

The main drivers are: simple operation and low maintenance cost.

Table of Content

1. Executive Summary | Corn Milling Machine Market

    1.1. Global Market Outlook

    1.2. Demand-side Trends

    1.3. Supply-side Trends

    1.4. Technology Roadmap Analysis

    1.5. Analysis and Recommendations

2. Market Overview

    2.1. Market Coverage / Taxonomy

    2.2. Market Definition / Scope / Limitations

3. Market Background

    3.1. Market Dynamics

        3.1.1. Drivers

        3.1.2. Restraints

        3.1.3. Opportunity

        3.1.4. Trends

    3.2. Scenario Forecast

        3.2.1. Demand in Optimistic Scenario

        3.2.2. Demand in Likely Scenario

        3.2.3. Demand in Conservative Scenario

    3.3. Product launches & Recent Developments

    3.4. Product Life Cycle Analysis

    3.5. Value Chain Analysis

        3.5.1. Supply Side Participants and their Roles

            3.5.1.1. Producers

            3.5.1.2. Mid-Level Participants (Traders/ Agents/ Brokers)

            3.5.1.3. Wholesalers and Distributors

        3.5.2. % of Operating Margin Analysis

        3.5.3. List of Raw Material Suppliers

        3.5.4. List of Existing and Potential Buyer’s

    3.6. Global Market - Pricing Analysis

        3.6.1. Price Point Assessment by Region

        3.6.2. Price Point Assessment by Product Type

        3.6.3. Price Forecast till 2033

        3.6.4. Factors affecting pricing

    3.7. Forecast Factors - Relevance & Impact

    3.8. Regulatory Landscape

        3.8.1. Certifications and Certifying Agency Overview

    3.9. Regional Parent Market Outlook

    3.10. Macro-Economic Factors

    3.11. Product Claims & Nutritional Information Scan by Buyers

4. Global Market Analysis 2018 to 2022 and Forecast, 2023 to 2033

    4.1. Historical Market Size Value (US$ million) & Volume (MT) Analysis, 2018 to 2022

    4.2. Current and Future Market Size Value (US$ million) & Volume (MT) Projections, 2023 to 2033

        4.2.1. Y-o-Y Growth Trend Analysis

        4.2.2. Absolute $ Opportunity Analysis

5. Global Market Analysis 2018 to 2022 and Forecast 2023 to 2033, By Equipment

    5.1. Introduction / Key Findings

    5.2. Historical Market Size Value (US$ million) & Volume (MT) Analysis By Equipment, 2018 to 2022

    5.3. Current and Future Market Size Value (US$ million) & Volume (MT) Analysis and Forecast By Equipment, 2023 to 2033

        5.3.1. Milling equipment

        5.3.2. Steeping equipment

        5.3.3. Centrifuge systems

        5.3.4. Washing & filtration systems

        5.3.5. Other (heating and cooling systems,dryers and other utility equipment)

    5.4. Y-o-Y Growth Trend Analysis By Equipment, 2018 to 2022

    5.5. Absolute $ Opportunity Analysis By Equipment, 2023 to 2033

6. Global Market Analysis 2018 to 2022 and Forecast 2023 to 2033, By End-Product 

    6.1. Introduction / Key Findings

    6.2. Historical Market Size Value (US$ million) & Volume (MT) Analysis By End-Product , 2018 to 2022

    6.3. Current and Future Market Size Value (US$ million) & Volume (MT) Analysis and Forecast By End-Product , 2023 to 2033

        6.3.1. Starch

        6.3.2. Sweetener

        6.3.3. Ethanol

        6.3.4. Corn gluten meal and gluten feed

        6.3.5. others ( corn oil, proteins, corn germ meal, and steep oil)

    6.4. Y-o-Y Growth Trend Analysis By End-Product , 2018 to 2022

    6.5. Absolute $ Opportunity Analysis By End-Product , 2023 to 2033

7. Global Market Analysis 2018 to 2022 and Forecast 2023 to 2033, By Application 

    7.1. Introduction / Key Findings

    7.2. Historical Market Size Value (US$ million) & Volume (MT) Analysis By Application , 2018 to 2022

    7.3. Current and Future Market Size Value (US$ million) & Volume (MT) Analysis and Forecast By Application , 2023 to 2033

        7.3.1. Feed

        7.3.2. Food

        7.3.3. Industrial

    7.4. Y-o-Y Growth Trend Analysis By Application , 2018 to 2022

    7.5. Absolute $ Opportunity Analysis By Application , 2023 to 2033

8. Global Market Analysis 2018 to 2022 and Forecast 2023 to 2033, By Source

    8.1. Introduction / Key Findings

    8.2. Historical Market Size Value (US$ million) & Volume (MT) Analysis By Source, 2018 to 2022

    8.3. Current and Future Market Size Value (US$ million) & Volume (MT) Analysis and Forecast By Source, 2023 to 2033

        8.3.1. Dent Corn

        8.3.2. Waxy Corn

    8.4. Y-o-Y Growth Trend Analysis By Source, 2018 to 2022

    8.5. Absolute $ Opportunity Analysis By Source, 2023 to 2033

9. Global Market Analysis 2018 to 2022 and Forecast 2023 to 2033, By Region

    9.1. Introduction

    9.2. Historical Market Size Value (US$ million) & Volume (MT) Analysis By Region, 2018 to 2022

    9.3. Current Market Size Value (US$ million) & Volume (MT) Analysis and Forecast By Region, 2023 to 2033

        9.3.1. North America

        9.3.2. Latin America

        9.3.3. Europe

        9.3.4. East Asia

        9.3.5. South Asia

        9.3.6. Oceania

        9.3.7. Middle East and Africa (MEA)

    9.4. Market Attractiveness Analysis By Region

10. North America Market Analysis 2018 to 2022 and Forecast 2023 to 2033, By Country

    10.1. Historical Market Size Value (US$ million) & Volume (MT) Trend Analysis By Market Taxonomy, 2018 to 2022

    10.2. Market Size Value (US$ million) & Volume (MT) Forecast By Market Taxonomy, 2023 to 2033

        10.2.1. By Country

            10.2.1.1. The 

            10.2.1.2. Canada

        10.2.2. By Equipment

        10.2.3. By End-Product

        10.2.4. By Application

        10.2.5. By Source

    10.3. Market Attractiveness Analysis

        10.3.1. By Country

        10.3.2. By Equipment

        10.3.3. By End-Product

        10.3.4. By Application

        10.3.5. By Source

    10.4. Key Takeaways

11. Latin America Market Analysis 2018 to 2022 and Forecast 2023 to 2033, By Country

    11.1. Historical Market Size Value (US$ million) & Volume (MT) Trend Analysis By Market Taxonomy, 2018 to 2022

    11.2. Market Size Value (US$ million) & Volume (MT) Forecast By Market Taxonomy, 2023 to 2033

        11.2.1. By Country

            11.2.1.1. Brazil

            11.2.1.2. Mexico

            11.2.1.3. Argentina

            11.2.1.4. Chile

            11.2.1.5. Peru

            11.2.1.6. Rest of Latin America

        11.2.2. By Equipment

        11.2.3. By End-Product

        11.2.4. By Application

        11.2.5. By Source

    11.3. Market Attractiveness Analysis

        11.3.1. By Country

        11.3.2. By Equipment

        11.3.3. By End-Product

        11.3.4. By Application

        11.3.5. By Source

    11.4. Key Takeaways

12. Europe Market Analysis 2018 to 2022 and Forecast 2023 to 2033, By Country

    12.1. Historical Market Size Value (US$ million) & Volume (MT) Trend Analysis By Market Taxonomy, 2018 to 2022

    12.2. Market Size Value (US$ million) & Volume (MT) Forecast By Market Taxonomy, 2023 to 2033

        12.2.1. By Country

            12.2.1.1. Germany

            12.2.1.2. Italy

            12.2.1.3. France

            12.2.1.4. The United Kingdom

            12.2.1.5. Spain

            12.2.1.6. Russia

            12.2.1.7. BENELUX

            12.2.1.8. Poland

            12.2.1.9. Nordic Countries

            12.2.1.10. Rest of Europe

        12.2.2. By Equipment

        12.2.3. By End-Product

        12.2.4. By Application

        12.2.5. By Source

    12.3. Market Attractiveness Analysis

        12.3.1. By Country

        12.3.2. By Equipment

        12.3.3. By End-Product

        12.3.4. By Application

        12.3.5. By Source

    12.4. Key Takeaways

13. East Asia Market Analysis 2018 to 2022 and Forecast 2023 to 2033, By Country

    13.1. Historical Market Size Value (US$ million) & Volume (MT) Trend Analysis By Market Taxonomy, 2018 to 2022

    13.2. Market Size Value (US$ million) & Volume (MT) Forecast By Market Taxonomy, 2023 to 2033

        13.2.1. By Country

            13.2.1.1. China

            13.2.1.2. Japan

            13.2.1.3. South Korea

        13.2.2. By Equipment

        13.2.3. By End-Product

        13.2.4. By Application

        13.2.5. By Source

    13.3. Market Attractiveness Analysis

        13.3.1. By Country

        13.3.2. By Equipment

        13.3.3. By End-Product

        13.3.4. By Application

        13.3.5. By Source

    13.4. Key Takeaways

14. South Asia Market Analysis 2018 to 2022 and Forecast 2023 to 2033, By Country

    14.1. Historical Market Size Value (US$ million) & Volume (MT) Trend Analysis By Market Taxonomy, 2018 to 2022

    14.2. Market Size Value (US$ million) & Volume (MT) Forecast By Market Taxonomy, 2023 to 2033

        14.2.1. By Country

            14.2.1.1. India

            14.2.1.2. Thailand

            14.2.1.3. Malaysia

            14.2.1.4. Indonesia

            14.2.1.5. Singapore

            14.2.1.6. Rest of South Asia

        14.2.2. By Equipment

        14.2.3. By End-Product

        14.2.4. By Application

        14.2.5. By Source

    14.3. Market Attractiveness Analysis

        14.3.1. By Country

        14.3.2. By Equipment

        14.3.3. By End-Product

        14.3.4. By Application

        14.3.5. By Source

    14.4. Key Takeaways

15. Oceania Market Analysis 2018 to 2022 and Forecast 2023 to 2033, By Country

    15.1. Historical Market Size Value (US$ million) & Volume (MT) Trend Analysis By Market Taxonomy, 2018 to 2022

    15.2. Market Size Value (US$ million) & Volume (MT) Forecast By Market Taxonomy, 2023 to 2033

        15.2.1. By Country

            15.2.1.1. Australia

            15.2.1.2. New Zealand

        15.2.2. By Equipment

        15.2.3. By End-Product

        15.2.4. By Application

        15.2.5. By Source

    15.3. Market Attractiveness Analysis

        15.3.1. By Country

        15.3.2. By Equipment

        15.3.3. By End-Product

        15.3.4. By Application

        15.3.5. By Source

    15.4. Key Takeaways

16. MEA Market Analysis 2018 to 2022 and Forecast 2023 to 2033, By Country

    16.1. Historical Market Size Value (US$ million) & Volume (MT) Trend Analysis By Market Taxonomy, 2018 to 2022

    16.2. Market Size Value (US$ million) & Volume (MT) Forecast By Market Taxonomy, 2023 to 2033

        16.2.1. By Country

            16.2.1.1. GCC Countries

            16.2.1.2. South Africa

            16.2.1.3. Central Africa

            16.2.1.4. North Africa

        16.2.2. By Equipment

        16.2.3. By End-Product

        16.2.4. By Application

        16.2.5. By Source

    16.3. Market Attractiveness Analysis

        16.3.1. By Country

        16.3.2. By Equipment

        16.3.3. By End-Product

        16.3.4. By Application

        16.3.5. By Source

    16.4. Key Takeaways

17. Key Countries Market Analysis

    17.1. The USA

        17.1.1. Pricing Analysis

        17.1.2. Market Share Analysis, 2022

            17.1.2.1. By Equipment

            17.1.2.2. By End-Product

            17.1.2.3. By Application

            17.1.2.4. By Source

    17.2. Canada

        17.2.1. Pricing Analysis

        17.2.2. Market Share Analysis, 2022

            17.2.2.1. By Equipment

            17.2.2.2. By End-Product

            17.2.2.3. By Application

            17.2.2.4. By Source

    17.3. Brazil

        17.3.1. Pricing Analysis

        17.3.2. Market Share Analysis, 2022

            17.3.2.1. By Equipment

            17.3.2.2. By End-Product

            17.3.2.3. By Application

            17.3.2.4. By Source

    17.4. Mexico

        17.4.1. Pricing Analysis

        17.4.2. Market Share Analysis, 2022

            17.4.2.1. By Equipment

            17.4.2.2. By End-Product

            17.4.2.3. By Application

            17.4.2.4. By Source

    17.5. Argentina

        17.5.1. Pricing Analysis

        17.5.2. Market Share Analysis, 2022

            17.5.2.1. By Equipment

            17.5.2.2. By End-Product

            17.5.2.3. By Application

            17.5.2.4. By Source

    17.6. Chile

        17.6.1. Pricing Analysis

        17.6.2. Market Share Analysis, 2022

            17.6.2.1. By Equipment

            17.6.2.2. By End-Product

            17.6.2.3. By Application

            17.6.2.4. By Source

    17.7. Peru

        17.7.1. Pricing Analysis

        17.7.2. Market Share Analysis, 2022

            17.7.2.1. By Equipment

            17.7.2.2. By End-Product

            17.7.2.3. By Application

            17.7.2.4. By Source

    17.8. Germany

        17.8.1. Pricing Analysis

        17.8.2. Market Share Analysis, 2022

            17.8.2.1. By Equipment

            17.8.2.2. By End-Product

            17.8.2.3. By Application

            17.8.2.4. By Source

    17.9. Italy

        17.9.1. Pricing Analysis

        17.9.2. Market Share Analysis, 2022

            17.9.2.1. By Equipment

            17.9.2.2. By End-Product

            17.9.2.3. By Application

            17.9.2.4. By Source

    17.10. France

        17.10.1. Pricing Analysis

        17.10.2. Market Share Analysis, 2022

            17.10.2.1. By Equipment

            17.10.2.2. By End-Product

            17.10.2.3. By Application

            17.10.2.4. By Source

    17.11. Spain

        17.11.1. Pricing Analysis

        17.11.2. Market Share Analysis, 2022

            17.11.2.1. By Equipment

            17.11.2.2. By End-Product

            17.11.2.3. By Application

            17.11.2.4. By Source

    17.12. The United Kingdom

        17.12.1. Pricing Analysis

        17.12.2. Market Share Analysis, 2022

            17.12.2.1. By Equipment

            17.12.2.2. By End-Product

            17.12.2.3. By Application

            17.12.2.4. By Source

    17.13. Russia

        17.13.1. Pricing Analysis

        17.13.2. Market Share Analysis, 2022

            17.13.2.1. By Equipment

            17.13.2.2. By End-Product

            17.13.2.3. By Application

            17.13.2.4. By Source

    17.14. Poland

        17.14.1. Pricing Analysis

        17.14.2. Market Share Analysis, 2022

            17.14.2.1. By Equipment

            17.14.2.2. By End-Product

            17.14.2.3. By Application

            17.14.2.4. By Source

    17.15. BENELUX

        17.15.1. Pricing Analysis

        17.15.2. Market Share Analysis, 2022

            17.15.2.1. By Equipment

            17.15.2.2. By End-Product

            17.15.2.3. By Application

            17.15.2.4. By Source

    17.16. Nordic Countries

        17.16.1. Pricing Analysis

        17.16.2. Market Share Analysis, 2022

            17.16.2.1. By Equipment

            17.16.2.2. By End-Product

            17.16.2.3. By Application

            17.16.2.4. By Source

    17.17. China

        17.17.1. Pricing Analysis

        17.17.2. Market Share Analysis, 2022

            17.17.2.1. By Equipment

            17.17.2.2. By End-Product

            17.17.2.3. By Application

            17.17.2.4. By Source

    17.18. Japan

        17.18.1. Pricing Analysis

        17.18.2. Market Share Analysis, 2022

            17.18.2.1. By Equipment

            17.18.2.2. By End-Product

            17.18.2.3. By Application

            17.18.2.4. By Source

    17.19. South Korea

        17.19.1. Pricing Analysis

        17.19.2. Market Share Analysis, 2022

            17.19.2.1. By Equipment

            17.19.2.2. By End-Product

            17.19.2.3. By Application

            17.19.2.4. By Source

    17.20. India

        17.20.1. Pricing Analysis

        17.20.2. Market Share Analysis, 2022

            17.20.2.1. By Equipment

            17.20.2.2. By End-Product

            17.20.2.3. By Application

            17.20.2.4. By Source

    17.21. Thailand

        17.21.1. Pricing Analysis

        17.21.2. Market Share Analysis, 2022

            17.21.2.1. By Equipment

            17.21.2.2. By End-Product

            17.21.2.3. By Application

            17.21.2.4. By Source

    17.22. Indonesia

        17.22.1. Pricing Analysis

        17.22.2. Market Share Analysis, 2022

            17.22.2.1. By Equipment

            17.22.2.2. By End-Product

            17.22.2.3. By Application

            17.22.2.4. By Source

    17.23. Malaysia

        17.23.1. Pricing Analysis

        17.23.2. Market Share Analysis, 2022

            17.23.2.1. By Equipment

            17.23.2.2. By End-Product

            17.23.2.3. By Application

            17.23.2.4. By Source

    17.24. Singapore

        17.24.1. Pricing Analysis

        17.24.2. Market Share Analysis, 2022

            17.24.2.1. By Equipment

            17.24.2.2. By End-Product

            17.24.2.3. By Application

            17.24.2.4. By Source

    17.25. Australia

        17.25.1. Pricing Analysis

        17.25.2. Market Share Analysis, 2022

            17.25.2.1. By Equipment

            17.25.2.2. By End-Product

            17.25.2.3. By Application

            17.25.2.4. By Source

    17.26. New Zealand

        17.26.1. Pricing Analysis

        17.26.2. Market Share Analysis, 2022

            17.26.2.1. By Equipment

            17.26.2.2. By End-Product

            17.26.2.3. By Application

            17.26.2.4. By Source

    17.27. GCC Countries

        17.27.1. Pricing Analysis

        17.27.2. Market Share Analysis, 2022

            17.27.2.1. By Equipment

            17.27.2.2. By End-Product

            17.27.2.3. By Application

            17.27.2.4. By Source

    17.28. South Africa

        17.28.1. Pricing Analysis

        17.28.2. Market Share Analysis, 2022

            17.28.2.1. By Equipment

            17.28.2.2. By End-Product ;

            17.28.2.3. By Application

            17.28.2.4. By Source

    17.29. North Africa

        17.29.1. Pricing Analysis

        17.29.2. Market Share Analysis, 2022

            17.29.2.1. By Equipment

            17.29.2.2. By End-Product

            17.29.2.3. By Application

            17.29.2.4. By Source

    17.30. Central Africa

        17.30.1. Pricing Analysis

        17.30.2. Market Share Analysis, 2022

            17.30.2.1. By Equipment

            17.30.2.2. By End-Product

            17.30.2.3. By Application

            17.30.2.4. By Source

18. Market Structure Analysis

    18.1. Competition Dashboard

    18.2. Competition Benchmarking

    18.3. Market Share Analysis of Top Players

        18.3.1. By Regional

        18.3.2. By Equipment

        18.3.3. By End-Product

        18.3.4. By Application

        18.3.5. By Source

19. Competition Analysis

    19.1. Competition Deep Dive

        19.1.1. Tate and Lyle PLC (UK)

            19.1.1.1. Overview

            19.1.1.2. Product Portfolio

            19.1.1.3. Profitability by Market Segments (Product/Age /Sales Channel/Region)

            19.1.1.4. Sales Footprint

            19.1.1.5. Strategy Overview

                19.1.1.5.1. Marketing Strategy

                19.1.1.5.2. Product Strategy

                19.1.1.5.3. Channel Strategy

        19.1.2. Archer Daniel Midland Company

            19.1.2.1. Overview

            19.1.2.2. Product Portfolio

            19.1.2.3. Profitability by Market Segments (Product/Age /Sales Channel/Region)

            19.1.2.4. Sales Footprint

            19.1.2.5. Strategy Overview

                19.1.2.5.1. Marketing Strategy

                19.1.2.5.2. Product Strategy

                19.1.2.5.3. Channel Strategy

        19.1.3. Cargil Incorporate

            19.1.3.1. Overview

            19.1.3.2. Product Portfolio

            19.1.3.3. Profitability by Market Segments (Product/Age /Sales Channel/Region)

            19.1.3.4. Sales Footprint

            19.1.3.5. Strategy Overview

                19.1.3.5.1. Marketing Strategy

                19.1.3.5.2. Product Strategy

                19.1.3.5.3. Channel Strategy

        19.1.4. Agrana Beteiligungs-AG

            19.1.4.1. Overview

            19.1.4.2. Product Portfolio

            19.1.4.3. Profitability by Market Segments (Product/Age /Sales Channel/Region)

            19.1.4.4. Sales Footprint

            19.1.4.5. Strategy Overview

                19.1.4.5.1. Marketing Strategy

                19.1.4.5.2. Product Strategy

                19.1.4.5.3. Channel Strategy

        19.1.5. The Roquette Feres

            19.1.5.1. Overview

            19.1.5.2. Product Portfolio

            19.1.5.3. Profitability by Market Segments (Product/Age /Sales Channel/Region)

            19.1.5.4. Sales Footprint

            19.1.5.5. Strategy Overview

                19.1.5.5.1. Marketing Strategy

                19.1.5.5.2. Product Strategy

                19.1.5.5.3. Channel Strategy

        19.1.6. Bunge Limited

            19.1.6.1. Overview

            19.1.6.2. Product Portfolio

            19.1.6.3. Profitability by Market Segments (Product/Age /Sales Channel/Region)

            19.1.6.4. Sales Footprint

            19.1.6.5. Strategy Overview

                19.1.6.5.1. Marketing Strategy

                19.1.6.5.2. Product Strategy

                19.1.6.5.3. Channel Strategy

        19.1.7. China Agri-industries Holding Limited

            19.1.7.1. Overview

            19.1.7.2. Product Portfolio

            19.1.7.3. Profitability by Market Segments (Product/Age /Sales Channel/Region)

            19.1.7.4. Sales Footprint

            19.1.7.5. Strategy Overview

                19.1.7.5.1. Marketing Strategy

                19.1.7.5.2. Product Strategy

                19.1.7.5.3. Channel Strategy

        19.1.8. Global Bio-Chem Technology group company

            19.1.8.1. Overview

            19.1.8.2. Product Portfolio

            19.1.8.3. Profitability by Market Segments (Product/Age /Sales Channel/Region)

            19.1.8.4. Sales Footprint

            19.1.8.5. Strategy Overview

                19.1.8.5.1. Marketing Strategy

                19.1.8.5.2. Product Strategy

                19.1.8.5.3. Channel Strategy

        19.1.9. Grain Processing Corporation

            19.1.9.1. Overview

            19.1.9.2. Product Portfolio

            19.1.9.3. Profitability by Market Segments (Product/Age /Sales Channel/Region)

            19.1.9.4. Sales Footprint

            19.1.9.5. Strategy Overview

                19.1.9.5.1. Marketing Strategy

                19.1.9.5.2. Product Strategy

                19.1.9.5.3. Channel Strategy

        19.1.10. Other (as per requirement)

            19.1.10.1. Overview

            19.1.10.2. Product Portfolio

            19.1.10.3. Profitability by Market Segments (Product/Age /Sales Channel/Region)

            19.1.10.4. Sales Footprint

            19.1.10.5. Strategy Overview

                19.1.10.5.1. Marketing Strategy

                19.1.10.5.2. Product Strategy

                19.1.10.5.3. Channel Strategy

20. Assumptions & Acronyms Used

21. Research Methodology

Don't pay for what you don't need

Customize your report by selecting specific countries or regions and save 30%!

List of Tables

Table 1: Global Market Value (US$ million) Forecast by Region, 2018 to 2033

Table 2: Global Market Volume (Units) Forecast by Region, 2018 to 2033

Table 3: Global Market Value (US$ million) Forecast by End-Product , 2018 to 2033

Table 4: Global Market Volume (Units) Forecast by End-Product , 2018 to 2033

Table 5: Global Market Value (US$ million) Forecast by Application, 2018 to 2033

Table 6: Global Market Volume (Units) Forecast by Application, 2018 to 2033

Table 7: Global Market Value (US$ million) Forecast by Source, 2018 to 2033

Table 8: Global Market Volume (Units) Forecast by Source, 2018 to 2033

Table 9: Global Market Value (US$ million) Forecast by Equipment, 2018 to 2033

Table 10: Global Market Volume (Units) Forecast by Equipment, 2018 to 2033

Table 11: North America Market Value (US$ million) Forecast by Country, 2018 to 2033

Table 12: North America Market Volume (Units) Forecast by Country, 2018 to 2033

Table 13: North America Market Value (US$ million) Forecast by End-Product , 2018 to 2033

Table 14: North America Market Volume (Units) Forecast by End-Product , 2018 to 2033

Table 15: North America Market Value (US$ million) Forecast by Application, 2018 to 2033

Table 16: North America Market Volume (Units) Forecast by Application, 2018 to 2033

Table 17: North America Market Value (US$ million) Forecast by Source, 2018 to 2033

Table 18: North America Market Volume (Units) Forecast by Source, 2018 to 2033

Table 19: North America Market Value (US$ million) Forecast by Equipment, 2018 to 2033

Table 20: North America Market Volume (Units) Forecast by Equipment, 2018 to 2033

Table 21: Latin America Market Value (US$ million) Forecast by Country, 2018 to 2033

Table 22: Latin America Market Volume (Units) Forecast by Country, 2018 to 2033

Table 23: Latin America Market Value (US$ million) Forecast by End-Product , 2018 to 2033

Table 24: Latin America Market Volume (Units) Forecast by End-Product , 2018 to 2033

Table 25: Latin America Market Value (US$ million) Forecast by Application, 2018 to 2033

Table 26: Latin America Market Volume (Units) Forecast by Application, 2018 to 2033

Table 27: Latin America Market Value (US$ million) Forecast by Source, 2018 to 2033

Table 28: Latin America Market Volume (Units) Forecast by Source, 2018 to 2033

Table 29: Latin America Market Value (US$ million) Forecast by Equipment, 2018 to 2033

Table 30: Latin America Market Volume (Units) Forecast by Equipment, 2018 to 2033

Table 31: Europe Market Value (US$ million) Forecast by Country, 2018 to 2033

Table 32: Europe Market Volume (Units) Forecast by Country, 2018 to 2033

Table 33: Europe Market Value (US$ million) Forecast by End-Product , 2018 to 2033

Table 34: Europe Market Volume (Units) Forecast by End-Product , 2018 to 2033

Table 35: Europe Market Value (US$ million) Forecast by Application, 2018 to 2033

Table 36: Europe Market Volume (Units) Forecast by Application, 2018 to 2033

Table 37: Europe Market Value (US$ million) Forecast by Source, 2018 to 2033

Table 38: Europe Market Volume (Units) Forecast by Source, 2018 to 2033

Table 39: Europe Market Value (US$ million) Forecast by Equipment, 2018 to 2033

Table 40: Europe Market Volume (Units) Forecast by Equipment, 2018 to 2033

Table 41: East Asia Market Value (US$ million) Forecast by Country, 2018 to 2033

Table 42: East Asia Market Volume (Units) Forecast by Country, 2018 to 2033

Table 43: East Asia Market Value (US$ million) Forecast by End-Product , 2018 to 2033

Table 44: East Asia Market Volume (Units) Forecast by End-Product , 2018 to 2033

Table 45: East Asia Market Value (US$ million) Forecast by Application, 2018 to 2033

Table 46: East Asia Market Volume (Units) Forecast by Application, 2018 to 2033

Table 47: East Asia Market Value (US$ million) Forecast by Source, 2018 to 2033

Table 48: East Asia Market Volume (Units) Forecast by Source, 2018 to 2033

Table 49: East Asia Market Value (US$ million) Forecast by Equipment, 2018 to 2033

Table 50: East Asia Market Volume (Units) Forecast by Equipment, 2018 to 2033

Table 51: South Asia Market Value (US$ million) Forecast by Country, 2018 to 2033

Table 52: South Asia Market Volume (Units) Forecast by Country, 2018 to 2033

Table 53: South Asia Market Value (US$ million) Forecast by End-Product , 2018 to 2033

Table 54: South Asia Market Volume (Units) Forecast by End-Product , 2018 to 2033

Table 55: South Asia Market Value (US$ million) Forecast by Application, 2018 to 2033

Table 56: South Asia Market Volume (Units) Forecast by Application, 2018 to 2033

Table 57: South Asia Market Value (US$ million) Forecast by Source, 2018 to 2033

Table 58: South Asia Market Volume (Units) Forecast by Source, 2018 to 2033

Table 59: South Asia Market Value (US$ million) Forecast by Equipment, 2018 to 2033

Table 60: South Asia Market Volume (Units) Forecast by Equipment, 2018 to 2033

Table 61: Oceania Market Value (US$ million) Forecast by Country, 2018 to 2033

Table 62: Oceania Market Volume (Units) Forecast by Country, 2018 to 2033

Table 63: Oceania Market Value (US$ million) Forecast by End-Product , 2018 to 2033

Table 64: Oceania Market Volume (Units) Forecast by End-Product , 2018 to 2033

Table 65: Oceania Market Value (US$ million) Forecast by Application, 2018 to 2033

Table 66: Oceania Market Volume (Units) Forecast by Application, 2018 to 2033

Table 67: Oceania Market Value (US$ million) Forecast by Source, 2018 to 2033

Table 68: Oceania Market Volume (Units) Forecast by Source, 2018 to 2033

Table 69: Oceania Market Value (US$ million) Forecast by Equipment, 2018 to 2033

Table 70: Oceania Market Volume (Units) Forecast by Equipment, 2018 to 2033

Table 71: MEA Market Value (US$ million) Forecast by Country, 2018 to 2033

Table 72: MEA Market Volume (Units) Forecast by Country, 2018 to 2033

Table 73: MEA Market Value (US$ million) Forecast by End-Product , 2018 to 2033

Table 74: MEA Market Volume (Units) Forecast by End-Product , 2018 to 2033

Table 75: MEA Market Value (US$ million) Forecast by Application, 2018 to 2033

Table 76: MEA Market Volume (Units) Forecast by Application, 2018 to 2033

Table 77: MEA Market Value (US$ million) Forecast by Source, 2018 to 2033

Table 78: MEA Market Volume (Units) Forecast by Source, 2018 to 2033

Table 79: MEA Market Value (US$ million) Forecast by Equipment, 2018 to 2033

Table 80: MEA Market Volume (Units) Forecast by Equipment, 2018 to 2033
Nandini Roy Choudhury

Principal Consultant

Talk to Analyst

Find your sweet spots for generating winning opportunities in this market.

List of Charts

Figure 1: Global Market Value (US$ million) by End-Product , 2023 to 2033

Figure 2: Global Market Value (US$ million) by Application, 2023 to 2033

Figure 3: Global Market Value (US$ million) by Source, 2023 to 2033

Figure 4: Global Market Value (US$ million) by Equipment, 2023 to 2033

Figure 5: Global Market Value (US$ million) by Region, 2023 to 2033

Figure 6: Global Market Value (US$ million) Analysis by Region, 2018 to 2033

Figure 7: Global Market Volume (Units) Analysis by Region, 2018 to 2033

Figure 8: Global Market Value Share (%) and BPS Analysis by Region, 2023 to 2033

Figure 9: Global Market Y-o-Y Growth (%) Projections by Region, 2023 to 2033

Figure 10: Global Market Value (US$ million) Analysis by End-Product , 2018 to 2033

Figure 11: Global Market Volume (Units) Analysis by End-Product , 2018 to 2033

Figure 12: Global Market Value Share (%) and BPS Analysis by End-Product , 2023 to 2033

Figure 13: Global Market Y-o-Y Growth (%) Projections by End-Product , 2023 to 2033

Figure 14: Global Market Value (US$ million) Analysis by Application, 2018 to 2033

Figure 15: Global Market Volume (Units) Analysis by Application, 2018 to 2033

Figure 16: Global Market Value Share (%) and BPS Analysis by Application, 2023 to 2033

Figure 17: Global Market Y-o-Y Growth (%) Projections by Application, 2023 to 2033

Figure 18: Global Market Value (US$ million) Analysis by Source, 2018 to 2033

Figure 19: Global Market Volume (Units) Analysis by Source, 2018 to 2033

Figure 20: Global Market Value Share (%) and BPS Analysis by Source, 2023 to 2033

Figure 21: Global Market Y-o-Y Growth (%) Projections by Source, 2023 to 2033

Figure 22: Global Market Value (US$ million) Analysis by Equipment, 2018 to 2033

Figure 23: Global Market Volume (Units) Analysis by Equipment, 2018 to 2033

Figure 24: Global Market Value Share (%) and BPS Analysis by Equipment, 2023 to 2033

Figure 25: Global Market Y-o-Y Growth (%) Projections by Equipment, 2023 to 2033

Figure 26: Global Market Attractiveness by End-Product , 2023 to 2033

Figure 27: Global Market Attractiveness by Application, 2023 to 2033

Figure 28: Global Market Attractiveness by Source, 2023 to 2033

Figure 29: Global Market Attractiveness by Equipment, 2023 to 2033

Figure 30: Global Market Attractiveness by Region, 2023 to 2033

Figure 31: North America Market Value (US$ million) by End-Product , 2023 to 2033

Figure 32: North America Market Value (US$ million) by Application, 2023 to 2033

Figure 33: North America Market Value (US$ million) by Source, 2023 to 2033

Figure 34: North America Market Value (US$ million) by Equipment, 2023 to 2033

Figure 35: North America Market Value (US$ million) by Country, 2023 to 2033

Figure 36: North America Market Value (US$ million) Analysis by Country, 2018 to 2033

Figure 37: North America Market Volume (Units) Analysis by Country, 2018 to 2033

Figure 38: North America Market Value Share (%) and BPS Analysis by Country, 2023 to 2033

Figure 39: North America Market Y-o-Y Growth (%) Projections by Country, 2023 to 2033

Figure 40: North America Market Value (US$ million) Analysis by End-Product , 2018 to 2033

Figure 41: North America Market Volume (Units) Analysis by End-Product , 2018 to 2033

Figure 42: North America Market Value Share (%) and BPS Analysis by End-Product , 2023 to 2033

Figure 43: North America Market Y-o-Y Growth (%) Projections by End-Product , 2023 to 2033

Figure 44: North America Market Value (US$ million) Analysis by Application, 2018 to 2033

Figure 45: North America Market Volume (Units) Analysis by Application, 2018 to 2033

Figure 46: North America Market Value Share (%) and BPS Analysis by Application, 2023 to 2033

Figure 47: North America Market Y-o-Y Growth (%) Projections by Application, 2023 to 2033

Figure 48: North America Market Value (US$ million) Analysis by Source, 2018 to 2033

Figure 49: North America Market Volume (Units) Analysis by Source, 2018 to 2033

Figure 50: North America Market Value Share (%) and BPS Analysis by Source, 2023 to 2033

Figure 51: North America Market Y-o-Y Growth (%) Projections by Source, 2023 to 2033

Figure 52: North America Market Value (US$ million) Analysis by Equipment, 2018 to 2033

Figure 53: North America Market Volume (Units) Analysis by Equipment, 2018 to 2033

Figure 54: North America Market Value Share (%) and BPS Analysis by Equipment, 2023 to 2033

Figure 55: North America Market Y-o-Y Growth (%) Projections by Equipment, 2023 to 2033

Figure 56: North America Market Attractiveness by End-Product , 2023 to 2033

Figure 57: North America Market Attractiveness by Application, 2023 to 2033

Figure 58: North America Market Attractiveness by Source, 2023 to 2033

Figure 59: North America Market Attractiveness by Equipment, 2023 to 2033

Figure 60: North America Market Attractiveness by Country, 2023 to 2033

Figure 61: Latin America Market Value (US$ million) by End-Product , 2023 to 2033

Figure 62: Latin America Market Value (US$ million) by Application, 2023 to 2033

Figure 63: Latin America Market Value (US$ million) by Source, 2023 to 2033

Figure 64: Latin America Market Value (US$ million) by Equipment, 2023 to 2033

Figure 65: Latin America Market Value (US$ million) by Country, 2023 to 2033

Figure 66: Latin America Market Value (US$ million) Analysis by Country, 2018 to 2033

Figure 67: Latin America Market Volume (Units) Analysis by Country, 2018 to 2033

Figure 68: Latin America Market Value Share (%) and BPS Analysis by Country, 2023 to 2033

Figure 69: Latin America Market Y-o-Y Growth (%) Projections by Country, 2023 to 2033

Figure 70: Latin America Market Value (US$ million) Analysis by End-Product , 2018 to 2033

Figure 71: Latin America Market Volume (Units) Analysis by End-Product , 2018 to 2033

Figure 72: Latin America Market Value Share (%) and BPS Analysis by End-Product , 2023 to 2033

Figure 73: Latin America Market Y-o-Y Growth (%) Projections by End-Product , 2023 to 2033

Figure 74: Latin America Market Value (US$ million) Analysis by Application, 2018 to 2033

Figure 75: Latin America Market Volume (Units) Analysis by Application, 2018 to 2033

Figure 76: Latin America Market Value Share (%) and BPS Analysis by Application, 2023 to 2033

Figure 77: Latin America Market Y-o-Y Growth (%) Projections by Application, 2023 to 2033

Figure 78: Latin America Market Value (US$ million) Analysis by Source, 2018 to 2033

Figure 79: Latin America Market Volume (Units) Analysis by Source, 2018 to 2033

Figure 80: Latin America Market Value Share (%) and BPS Analysis by Source, 2023 to 2033

Figure 81: Latin America Market Y-o-Y Growth (%) Projections by Source, 2023 to 2033

Figure 82: Latin America Market Value (US$ million) Analysis by Equipment, 2018 to 2033

Figure 83: Latin America Market Volume (Units) Analysis by Equipment, 2018 to 2033

Figure 84: Latin America Market Value Share (%) and BPS Analysis by Equipment, 2023 to 2033

Figure 85: Latin America Market Y-o-Y Growth (%) Projections by Equipment, 2023 to 2033

Figure 86: Latin America Market Attractiveness by End-Product , 2023 to 2033

Figure 87: Latin America Market Attractiveness by Application, 2023 to 2033

Figure 88: Latin America Market Attractiveness by Source, 2023 to 2033

Figure 89: Latin America Market Attractiveness by Equipment, 2023 to 2033

Figure 90: Latin America Market Attractiveness by Country, 2023 to 2033

Figure 91: Europe Market Value (US$ million) by End-Product , 2023 to 2033

Figure 92: Europe Market Value (US$ million) by Application, 2023 to 2033

Figure 93: Europe Market Value (US$ million) by Source, 2023 to 2033

Figure 94: Europe Market Value (US$ million) by Equipment, 2023 to 2033

Figure 95: Europe Market Value (US$ million) by Country, 2023 to 2033

Figure 96: Europe Market Value (US$ million) Analysis by Country, 2018 to 2033

Figure 97: Europe Market Volume (Units) Analysis by Country, 2018 to 2033

Figure 98: Europe Market Value Share (%) and BPS Analysis by Country, 2023 to 2033

Figure 99: Europe Market Y-o-Y Growth (%) Projections by Country, 2023 to 2033

Figure 100: Europe Market Value (US$ million) Analysis by End-Product , 2018 to 2033

Figure 101: Europe Market Volume (Units) Analysis by End-Product , 2018 to 2033

Figure 102: Europe Market Value Share (%) and BPS Analysis by End-Product , 2023 to 2033

Figure 103: Europe Market Y-o-Y Growth (%) Projections by End-Product , 2023 to 2033

Figure 104: Europe Market Value (US$ million) Analysis by Application, 2018 to 2033

Figure 105: Europe Market Volume (Units) Analysis by Application, 2018 to 2033

Figure 106: Europe Market Value Share (%) and BPS Analysis by Application, 2023 to 2033

Figure 107: Europe Market Y-o-Y Growth (%) Projections by Application, 2023 to 2033

Figure 108: Europe Market Value (US$ million) Analysis by Source, 2018 to 2033

Figure 109: Europe Market Volume (Units) Analysis by Source, 2018 to 2033

Figure 110: Europe Market Value Share (%) and BPS Analysis by Source, 2023 to 2033

Figure 111: Europe Market Y-o-Y Growth (%) Projections by Source, 2023 to 2033

Figure 112: Europe Market Value (US$ million) Analysis by Equipment, 2018 to 2033

Figure 113: Europe Market Volume (Units) Analysis by Equipment, 2018 to 2033

Figure 114: Europe Market Value Share (%) and BPS Analysis by Equipment, 2023 to 2033

Figure 115: Europe Market Y-o-Y Growth (%) Projections by Equipment, 2023 to 2033

Figure 116: Europe Market Attractiveness by End-Product , 2023 to 2033

Figure 117: Europe Market Attractiveness by Application, 2023 to 2033

Figure 118: Europe Market Attractiveness by Source, 2023 to 2033

Figure 119: Europe Market Attractiveness by Equipment, 2023 to 2033

Figure 120: Europe Market Attractiveness by Country, 2023 to 2033

Figure 121: East Asia Market Value (US$ million) by End-Product , 2023 to 2033

Figure 122: East Asia Market Value (US$ million) by Application, 2023 to 2033

Figure 123: East Asia Market Value (US$ million) by Source, 2023 to 2033

Figure 124: East Asia Market Value (US$ million) by Equipment, 2023 to 2033

Figure 125: East Asia Market Value (US$ million) by Country, 2023 to 2033

Figure 126: East Asia Market Value (US$ million) Analysis by Country, 2018 to 2033

Figure 127: East Asia Market Volume (Units) Analysis by Country, 2018 to 2033

Figure 128: East Asia Market Value Share (%) and BPS Analysis by Country, 2023 to 2033

Figure 129: East Asia Market Y-o-Y Growth (%) Projections by Country, 2023 to 2033

Figure 130: East Asia Market Value (US$ million) Analysis by End-Product , 2018 to 2033

Figure 131: East Asia Market Volume (Units) Analysis by End-Product , 2018 to 2033

Figure 132: East Asia Market Value Share (%) and BPS Analysis by End-Product , 2023 to 2033

Figure 133: East Asia Market Y-o-Y Growth (%) Projections by End-Product , 2023 to 2033

Figure 134: East Asia Market Value (US$ million) Analysis by Application, 2018 to 2033

Figure 135: East Asia Market Volume (Units) Analysis by Application, 2018 to 2033

Figure 136: East Asia Market Value Share (%) and BPS Analysis by Application, 2023 to 2033

Figure 137: East Asia Market Y-o-Y Growth (%) Projections by Application, 2023 to 2033

Figure 138: East Asia Market Value (US$ million) Analysis by Source, 2018 to 2033

Figure 139: East Asia Market Volume (Units) Analysis by Source, 2018 to 2033

Figure 140: East Asia Market Value Share (%) and BPS Analysis by Source, 2023 to 2033

Figure 141: East Asia Market Y-o-Y Growth (%) Projections by Source, 2023 to 2033

Figure 142: East Asia Market Value (US$ million) Analysis by Equipment, 2018 to 2033

Figure 143: East Asia Market Volume (Units) Analysis by Equipment, 2018 to 2033

Figure 144: East Asia Market Value Share (%) and BPS Analysis by Equipment, 2023 to 2033

Figure 145: East Asia Market Y-o-Y Growth (%) Projections by Equipment, 2023 to 2033

Figure 146: East Asia Market Attractiveness by End-Product , 2023 to 2033

Figure 147: East Asia Market Attractiveness by Application, 2023 to 2033

Figure 148: East Asia Market Attractiveness by Source, 2023 to 2033

Figure 149: East Asia Market Attractiveness by Equipment, 2023 to 2033

Figure 150: East Asia Market Attractiveness by Country, 2023 to 2033

Figure 151: South Asia Market Value (US$ million) by End-Product , 2023 to 2033

Figure 152: South Asia Market Value (US$ million) by Application, 2023 to 2033

Figure 153: South Asia Market Value (US$ million) by Source, 2023 to 2033

Figure 154: South Asia Market Value (US$ million) by Equipment, 2023 to 2033

Figure 155: South Asia Market Value (US$ million) by Country, 2023 to 2033

Figure 156: South Asia Market Value (US$ million) Analysis by Country, 2018 to 2033

Figure 157: South Asia Market Volume (Units) Analysis by Country, 2018 to 2033

Figure 158: South Asia Market Value Share (%) and BPS Analysis by Country, 2023 to 2033

Figure 159: South Asia Market Y-o-Y Growth (%) Projections by Country, 2023 to 2033

Figure 160: South Asia Market Value (US$ million) Analysis by End-Product , 2018 to 2033

Figure 161: South Asia Market Volume (Units) Analysis by End-Product , 2018 to 2033

Figure 162: South Asia Market Value Share (%) and BPS Analysis by End-Product , 2023 to 2033

Figure 163: South Asia Market Y-o-Y Growth (%) Projections by End-Product , 2023 to 2033

Figure 164: South Asia Market Value (US$ million) Analysis by Application, 2018 to 2033

Figure 165: South Asia Market Volume (Units) Analysis by Application, 2018 to 2033

Figure 166: South Asia Market Value Share (%) and BPS Analysis by Application, 2023 to 2033

Figure 167: South Asia Market Y-o-Y Growth (%) Projections by Application, 2023 to 2033

Figure 168: South Asia Market Value (US$ million) Analysis by Source, 2018 to 2033

Figure 169: South Asia Market Volume (Units) Analysis by Source, 2018 to 2033

Figure 170: South Asia Market Value Share (%) and BPS Analysis by Source, 2023 to 2033

Figure 171: South Asia Market Y-o-Y Growth (%) Projections by Source, 2023 to 2033

Figure 172: South Asia Market Value (US$ million) Analysis by Equipment, 2018 to 2033

Figure 173: South Asia Market Volume (Units) Analysis by Equipment, 2018 to 2033

Figure 174: South Asia Market Value Share (%) and BPS Analysis by Equipment, 2023 to 2033

Figure 175: South Asia Market Y-o-Y Growth (%) Projections by Equipment, 2023 to 2033

Figure 176: South Asia Market Attractiveness by End-Product , 2023 to 2033

Figure 177: South Asia Market Attractiveness by Application, 2023 to 2033

Figure 178: South Asia Market Attractiveness by Source, 2023 to 2033

Figure 179: South Asia Market Attractiveness by Equipment, 2023 to 2033

Figure 180: South Asia Market Attractiveness by Country, 2023 to 2033

Figure 181: Oceania Market Value (US$ million) by End-Product , 2023 to 2033

Figure 182: Oceania Market Value (US$ million) by Application, 2023 to 2033

Figure 183: Oceania Market Value (US$ million) by Source, 2023 to 2033

Figure 184: Oceania Market Value (US$ million) by Equipment, 2023 to 2033

Figure 185: Oceania Market Value (US$ million) by Country, 2023 to 2033

Figure 186: Oceania Market Value (US$ million) Analysis by Country, 2018 to 2033

Figure 187: Oceania Market Volume (Units) Analysis by Country, 2018 to 2033

Figure 188: Oceania Market Value Share (%) and BPS Analysis by Country, 2023 to 2033

Figure 189: Oceania Market Y-o-Y Growth (%) Projections by Country, 2023 to 2033

Figure 190: Oceania Market Value (US$ million) Analysis by End-Product , 2018 to 2033

Figure 191: Oceania Market Volume (Units) Analysis by End-Product , 2018 to 2033

Figure 192: Oceania Market Value Share (%) and BPS Analysis by End-Product , 2023 to 2033

Figure 193: Oceania Market Y-o-Y Growth (%) Projections by End-Product , 2023 to 2033

Figure 194: Oceania Market Value (US$ million) Analysis by Application, 2018 to 2033

Figure 195: Oceania Market Volume (Units) Analysis by Application, 2018 to 2033

Figure 196: Oceania Market Value Share (%) and BPS Analysis by Application, 2023 to 2033

Figure 197: Oceania Market Y-o-Y Growth (%) Projections by Application, 2023 to 2033

Figure 198: Oceania Market Value (US$ million) Analysis by Source, 2018 to 2033

Figure 199: Oceania Market Volume (Units) Analysis by Source, 2018 to 2033

Figure 200: Oceania Market Value Share (%) and BPS Analysis by Source, 2023 to 2033

Figure 201: Oceania Market Y-o-Y Growth (%) Projections by Source, 2023 to 2033

Figure 202: Oceania Market Value (US$ million) Analysis by Equipment, 2018 to 2033

Figure 203: Oceania Market Volume (Units) Analysis by Equipment, 2018 to 2033

Figure 204: Oceania Market Value Share (%) and BPS Analysis by Equipment, 2023 to 2033

Figure 205: Oceania Market Y-o-Y Growth (%) Projections by Equipment, 2023 to 2033

Figure 206: Oceania Market Attractiveness by End-Product , 2023 to 2033

Figure 207: Oceania Market Attractiveness by Application, 2023 to 2033

Figure 208: Oceania Market Attractiveness by Source, 2023 to 2033

Figure 209: Oceania Market Attractiveness by Equipment, 2023 to 2033

Figure 210: Oceania Market Attractiveness by Country, 2023 to 2033

Figure 211: MEA Market Value (US$ million) by End-Product , 2023 to 2033

Figure 212: MEA Market Value (US$ million) by Application, 2023 to 2033

Figure 213: MEA Market Value (US$ million) by Source, 2023 to 2033

Figure 214: MEA Market Value (US$ million) by Equipment, 2023 to 2033

Figure 215: MEA Market Value (US$ million) by Country, 2023 to 2033

Figure 216: MEA Market Value (US$ million) Analysis by Country, 2018 to 2033

Figure 217: MEA Market Volume (Units) Analysis by Country, 2018 to 2033

Figure 218: MEA Market Value Share (%) and BPS Analysis by Country, 2023 to 2033

Figure 219: MEA Market Y-o-Y Growth (%) Projections by Country, 2023 to 2033

Figure 220: MEA Market Value (US$ million) Analysis by End-Product , 2018 to 2033

Figure 221: MEA Market Volume (Units) Analysis by End-Product , 2018 to 2033

Figure 222: MEA Market Value Share (%) and BPS Analysis by End-Product , 2023 to 2033

Figure 223: MEA Market Y-o-Y Growth (%) Projections by End-Product , 2023 to 2033

Figure 224: MEA Market Value (US$ million) Analysis by Application, 2018 to 2033

Figure 225: MEA Market Volume (Units) Analysis by Application, 2018 to 2033

Figure 226: MEA Market Value Share (%) and BPS Analysis by Application, 2023 to 2033

Figure 227: MEA Market Y-o-Y Growth (%) Projections by Application, 2023 to 2033

Figure 228: MEA Market Value (US$ million) Analysis by Source, 2018 to 2033

Figure 229: MEA Market Volume (Units) Analysis by Source, 2018 to 2033

Figure 230: MEA Market Value Share (%) and BPS Analysis by Source, 2023 to 2033

Figure 231: MEA Market Y-o-Y Growth (%) Projections by Source, 2023 to 2033

Figure 232: MEA Market Value (US$ million) Analysis by Equipment, 2018 to 2033

Figure 233: MEA Market Volume (Units) Analysis by Equipment, 2018 to 2033

Figure 234: MEA Market Value Share (%) and BPS Analysis by Equipment, 2023 to 2033

Figure 235: MEA Market Y-o-Y Growth (%) Projections by Equipment, 2023 to 2033

Figure 236: MEA Market Attractiveness by End-Product , 2023 to 2033

Figure 237: MEA Market Attractiveness by Application, 2023 to 2033

Figure 238: MEA Market Attractiveness by Source, 2023 to 2033

Figure 239: MEA Market Attractiveness by Equipment, 2023 to 2033

Figure 240: MEA Market Attractiveness by Country, 2023 to 2033

Explore Process Automation Insights

View Reports

Corn Milling Machine Market