Corner Pads Market Size and Share Forecast Outlook 2025 to 2035

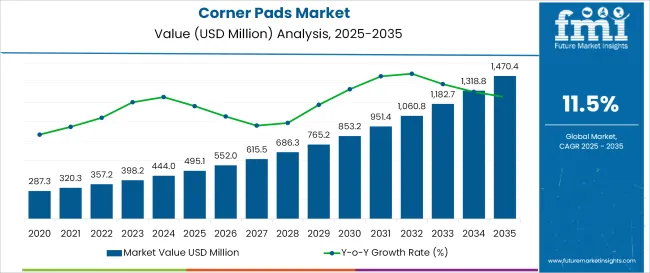
The global corner pads market is valued at USD 495.1 million in 2025 and is projected to reach USD 1,470.4 million by 2035, expanding at a CAGR of 11.5%. A balanced split between paper and alternative materials is observed, indicating strong demand for material diversification and innovation in the corner pads market.
Quick Stats - Dispensing Trays Market

  • Value of Market (2025): USD 495.1 million
  • Projected Value Market (2035): USD 1,470.4 million
  • Forecast CAGR Market (2025 to 2035): 11.5%
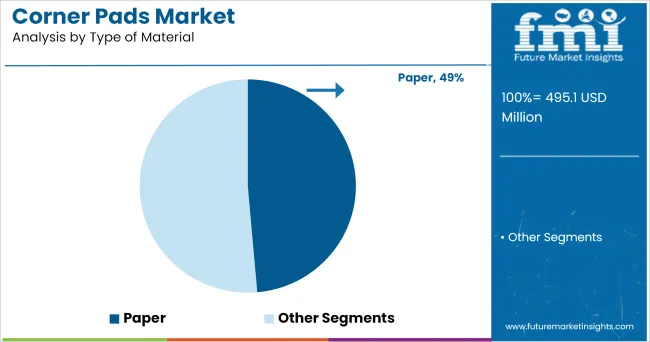
  • Largest material segment: Paper, 49%
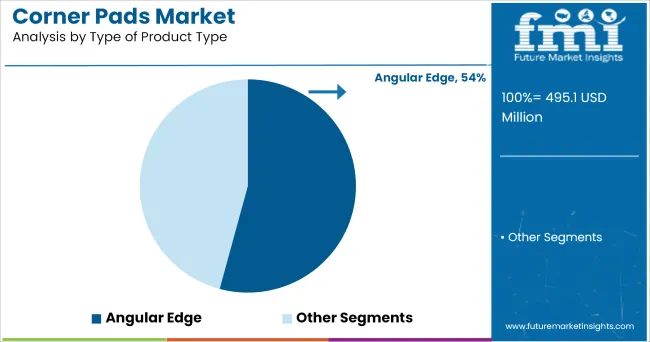
  • Largest product segment: Angular Edge, 54%
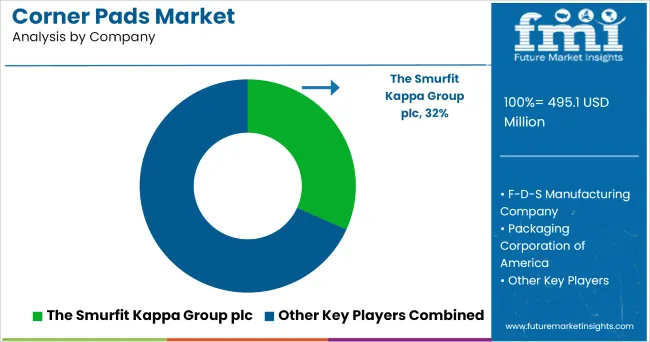
  • Leading player’s share: The Smurfit Kappa Group plc, 32%
  • Growth-variance among top regions: 0.2 percentage points (USA vs. UK)

Corner Pads Market

Metric Value
Market Size in 2025 USD 495.1 Million
Projected Market Size in 2035 USD 1,470.4 million
CAGR (2025 to 2035) 11.5%

Market expansion is being driven by increasing demand for protective packaging in e-commerce and logistics, where corner pads are required to secure palletized goods and prevent transit damage. Growth is further supported by the adoption of lightweight materials that reduce shipping costs while maintaining structural integrity. Regional uptake has been bolstered by investments in manufacturing and warehousing infrastructure across North America and Europe.

Market development is being restrained by raw material price volatility, which can compress margins for producers. Occasional supply-chain disruptions have led to shortages and delayed fulfilments. Additionally, evolving packaging-waste regulations are imposing compliance costs without mandating material substitution.

Opportunities are being created by the emergence of novel composite materials offering improved impact resistance at lower weight. Customisation trends are being driven by end users seeking designs tailored to specific load profiles and transit conditions. Production automation is being adopted to enhance consistency and scale output in high-growth regions such as the USA and EU.

Analyzing Corner Pads Market by Top Investment Segments

The corner pads market is segmented by type of material into paper; plastic; and foam; by product type into angular edge; straight edge; and custom edge; by end use into automotive; food & beverages; building and construction; electronics and electricals; and other industrial; and by region into North America; Latin America; Western Europe; Eastern Europe; East Asia; South Asia Pacific; and Middle East and Africa.
By Type of Material - Paper Corner Pads Hold 49% Share

Corner Pads Market Analysis By Type Of Material

In 2025, paper corner pads hold a 49% share, valued at USD 242.6 million, offering a lightweight and recyclable solution for pallet edge protection. Plastic and foam materials together account for the remaining 51%, driven by demand for higher durability and moisture resistance in industrial and export packaging. While paper maintains its relevance in cost-sensitive and eco-aligned markets, growth in plastic and foam segments reflects shifting preferences in high-impact applications, particularly in electronics and construction logistics.
  • Cost-efficiency advantage for paper-based corner pads in bulk shipments
  • Compliance complexity for plastic-based variants in regulated markets
  • Foam corner pads gaining traction for sensitive, high-value product protection

Angular Edge Corner Pads Lead with 54% Share in 2025

Corner Pads Market Analysis By Type Of Product Type

Angular edge corner pads lead with a 54% share in 2025, valued at USD 267.4 million, owing to their standardized fit and wide applicability across sectors like building materials and electronics. Straight edge and custom edge variants collectively represent 46%, used in non-standard load profiles and bespoke packaging solutions. While angular edge designs dominate due to ease of stacking and lower production costs, custom edge formats are gaining traction in niche sectors that demand tailored structural protection.

  • Broad applicability of angular edge pads across palletized shipments
  • Rising demand for custom edge pads in shaped and fragile product packaging
  • Straight edge variants preferred for minimal packaging design requirements

By End-use, Building and Construction Sector to Emerge as Leading Segment

In 2025, the building and construction sector emerges as the leading end user of corner pads, driven by high-volume transport of panels, tiles, and other fragile materials requiring edge protection. The automotive and electronics sectors follow, leveraging corner pads to prevent damage during assembly-line transfers and global shipping. Meanwhile, food & beverage and other industrial segments adopt corner pads selectively for secondary packaging, particularly for bulk shipments. Regulatory attention to transport safety and damage mitigation continues to expand usage across all verticals.
  • High adoption in construction packaging due to breakage risk in heavy materials
  • Automotive logistics rely on corner pads for part protection in multi-node supply chains
  • Electronics sector favors high-density foam variants for shock absorption

Corner Pads Market Analysis by Country

Corner Pads Market Country Growth CAGR 2025-2035

The corner pads market is witnessing steady uptake across the top 10 global economies, each reflecting a distinct pattern in protective packaging demand, regulatory influence, and material preference.

In the United States, growth is led by e-commerce and industrial shipments, with strong traction for paper-based and custom-edge solutions. China’s scale drives high-volume demand in electronics and construction, favoring foam and plastic variants. Japan emphasizes precision-fit angular edge formats, aligning with its electronics and automotive exports. Germany and France show a shift toward recyclable options, especially in the building sector, while the UK balances between cost-efficiency and compliance-driven packaging solutions.

India’s infrastructure expansion accelerates demand for basic foam and plastic pads, whereas South Korea focuses on export-grade protective materials. In Italy, demand stems from automotive and ceramic tile logistics, prompting hybrid material use. Canada’s moderate-scale adoption emphasizes sustainability, aligning with paper-based variants in food and beverage logistics.

Across these markets, end-user diversity and logistical standards shape corner pad adoption patterns, with material innovation and regional regulation acting as key differentiators.

United States Corner Pads Demand Analysis

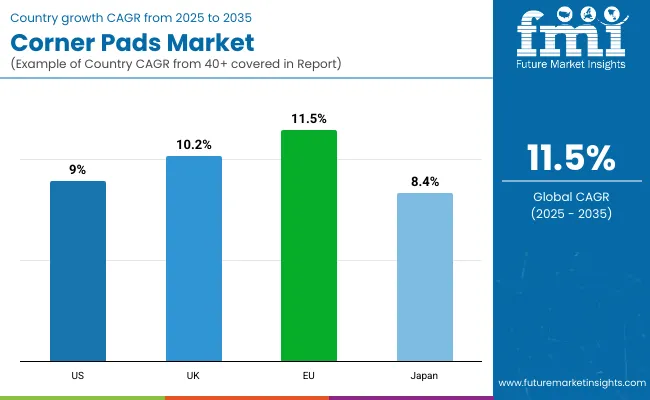
The United States corner pads market projected to expand at a CAGR of 9%. Growth is driven by the scale of domestic logistics, particularly in e-commerce, food service distribution, and retail warehousing, where demand for durable yet lightweight edge protection remains high.

No federal packaging mandates exist, but ASTM and industry-led standards influence design and testing benchmarks. Recyclable paper variants are increasingly favored by bulk shippers and B2B retailers seeking to align with internal sustainability KPIs. Custom-edge formats have also gained popularity, particularly in sectors such as furniture and industrial equipment, where packaging precision is linked to damage prevention.

  • High-volume demand in e-commerce fulfillment networks
  • Growing shift to paper-based corner pads for recyclability
  • Institutional buyers driving adoption of custom-fit variants

United Kingdom Corner Pads Industry Analysis

The United Kingdom corner pads market is likely to grow at a CAGR of 10.2%. Market expansion is supported by increased demand from the construction, electronics, and food sectors, alongside strict packaging waste compliance driven by UK Plastic Packaging Tax and Extended Producer Responsibility (EPR) frameworks.

While foam and plastic variants are still in use for fragile goods, the shift toward recyclable and compostable materials is accelerating. Paper-based corner pads are gaining preference among UK distributors and construction firms due to their cost-efficiency and ease of disposal. Additionally, demand for custom-edge solutions is rising among furniture exporters and industrial equipment manufacturers targeting EU and US markets.

  • Regulatory shift favoring recyclable packaging components
  • Construction and electronics sectors as primary demand hubs
  • Custom-edge corner pads gaining traction in export packaging

European Union Corner Pads Sales Forecast

The European Union corner pads market is projected to grow at a CAGR of 11.5%. Growth is anchored in strong regulatory pressure from the EU Packaging and Packaging Waste Directive, pushing industries toward recyclable and reusable protective materials, especially paper-based options.

Demand is highest in Germany, France, Italy, and Spain, where construction and industrial goods shipping dominate corner pad usage. Angular edge designs are standard due to their structural simplicity, while custom-edge variants are increasingly used in automotive components and electronics. The EU’s single-market logistics ecosystem further drives adoption by large distributors and packaging consolidators seeking standardized yet compliant corner protection solutions.

  • Strong compliance-led shift toward paper and compostable materials
  • High-volume usage in cross-border industrial goods transport
  • OEMs adopting edge-specific designs for intra-EU component shipping

Japan Corner Pads Market - Analysis

The Japan corner pads market is expected to grow at a CAGR of 8.4%. Demand is primarily driven by the country’s precision manufacturing sectors-electronics, automotive, and optics-where damage-free handling during domestic and export shipping is critical.

Regulatory emphasis lies in waste minimization and material optimization, with voluntary standards from the Japan Packaging Institute influencing material selection. Paper and hybrid paper-foam variants are preferred for their balance of strength and recyclability. Angular edge pads dominate due to their compatibility with automated packing systems widely used in Japanese manufacturing logistics.
  • High penetration in export-oriented precision goods sectors
  • Preference for paper-based variants aligned with local recycling systems
  • Strong reliance on standard angular formats for automation compatibility

Corner Pads Market Players and their Strategies

Corner Pads Market Analysis By Company

The players in the corner pads market are focusing on material innovation, regional expansion, and end-use customization to address growing demand across construction, industrial, and logistics sectors. Leading firms are strengthening their foothold through recyclable and lightweight material formats, particularly paper-based and hybrid corner pads, to align with regulatory and operational priorities of large-scale shippers. Strategic collaborations with packaging distributors and pallet manufacturers have also been observed to streamline product integration.

Tier 1 companies like The Smurfit Kappa Group plc, which holds a 32% share, continue to dominate through vertically integrated manufacturing, global distribution networks, and large-volume supply contracts. These players invest heavily in automated production and R&D for custom-fit edge solutions.

Tier 2 firms such as Packaging Corporation of America and F-D-S Manufacturing Company are expanding regionally, targeting mid-size B2B clients with cost-competitive offerings and adaptable SKUs. Meanwhile, smaller players and startups are entering the market by offering niche products, particularly in foam and bio-based formats tailored for fragile or premium goods.

The corner pads market presents viable entry points for startups, though Tier 1 players maintain scale advantages.

This is not a closed market. While large firms like Smurfit Kappa dominate institutional contracts and high-volume B2B supply chains, startups are carving niches through:

  • Custom-engineered designs for small-batch or fragile goods (e.g., luxury furniture, lab equipment)
  • Bio-based alternatives using agricultural byproducts or recycled pulp
  • Localized just-in-time production for regional logistics hubs avoiding large inventories

The capital barrier is moderate, tooling and basic die-cutting or molding are accessible with minimal investment compared to other packaging categories. However, to grow beyond niche segments, scaling operations and meeting cost efficiency benchmarks becomes critical.

Key Players

  • The Smurfit Kappa Group plc
  • Packaging Corporation of America
  • DS Smith Plc
  • Pratt Industries
  • Cascades Inc.
  • VPK Packaging Group
  • Kunert Gruppe
  • Signode Industrial Group
  • Litco International, Inc.

Key Segments of Corner Pads Market Covered in the Report

By Type of Material:

  • Paper
  • Plastic
  • Foam

By Type of Product Type:

  • Angular Edge
  • Straight Edge
  • Custom Edge

By End Use Industry:

  • Automotive
  • Food & Beverages
  • Building and Construction
  • Electronics and Electricals
  • Other Industrial

By Region:

  • North America
  • Latin America
  • Europe
  • South Asia
  • East Asia
  • Oceania
  • Middle East & Africa

Table of Content

  1. Executive Summary
    • Global Market Outlook
    • Demand-side Trends
    • Supply-side Trends
    • Technology Roadmap Analysis
    • Analysis and Recommendations
  2. Market Overview
    • Market Coverage / Taxonomy
    • Market Definition / Scope / Limitations
  3. Market Background
    • Market Dynamics
      • Drivers
      • Restraints
      • Opportunity
      • Trends
    • Scenario Forecast
      • Demand in Optimistic Scenario
      • Demand in Likely Scenario
      • Demand in Conservative Scenario
    • Opportunity Map Analysis
    • Product Life Cycle Analysis
    • Supply Chain Analysis
      • Supply Side Participants and their Roles
        • Producers
        • Mid-Level Participants (Traders/ Agents/ Brokers)
        • Wholesalers and Distributors
      • Value Added and Value Created at Node in the Supply Chain
      • List of Raw Material Suppliers
      • List of Existing and Potential Buyer’s
    • Investment Feasibility Matrix
    • Value Chain Analysis
      • Profit Margin Analysis
      • Wholesalers and Distributors
      • Retailers
    • PESTLE and Porter’s Analysis
    • Regulatory Landscape
      • By Key Regions
      • By Key Countries
    • Regional Parent Market Outlook
    • Production and Consumption Statistics
    • Import and Export Statistics
  4. Global Market Analysis 2020 to 2024 and Forecast, 2025 to 2035
    • Historical Market Size Value (USD Million) & Volume (Metric Tons) Analysis, 2020 to 2024
    • Current and Future Market Size Value (USD Million) & Volume (Metric Tons) Projections, 2025 to 2035
      • Y-o-Y Growth Trend Analysis
      • Absolute $ Opportunity Analysis
  5. Global Market Pricing Analysis 2020 to 2024 and Forecast 2025 to 2035
  6. Global Market Analysis 2020 to 2024 and Forecast 2025 to 2035, By Type of Material
    • Introduction / Key Findings
    • Historical Market Size Value (USD Million) & Volume (Metric Tons) Analysis By Type of Material, 2020 to 2024
    • Current and Future Market Size Value (USD Million) & Volume (Metric Tons) Analysis and Forecast By Type of Material, 2025 to 2035
      • Paper
      • Plastic
      • Foam
    • Y-o-Y Growth Trend Analysis By Type of Material, 2020 to 2024
    • Absolute $ Opportunity Analysis By Type of Material, 2025 to 2035
  7. Global Market Analysis 2020 to 2024 and Forecast 2025 to 2035, By Product Type
    • Introduction / Key Findings
    • Historical Market Size Value (USD Million) & Volume (Metric Tons) Analysis By Product Type, 2020 to 2024
    • Current and Future Market Size Value (USD Million) & Volume (Metric Tons) Analysis and Forecast By Product Type, 2025 to 2035
      • Angular Edge
      • Straight Edge
      • Custom Edge
    • Y-o-Y Growth Trend Analysis By Product Type, 2020 to 2024
    • Absolute $ Opportunity Analysis By Product Type, 2025 to 2035
  8. Global Market Analysis 2020 to 2024 and Forecast 2025 to 2035, By End Use
    • Introduction / Key Findings
    • Historical Market Size Value (USD Million) & Volume (Metric Tons) Analysis By End Use, 2020 to 2024
    • Current and Future Market Size Value (USD Million) & Volume (Metric Tons) Analysis and Forecast By End Use, 2025 to 2035
      • Automotive
      • Food & Beverages
      • Building and Construction
      • Electronics and Electricals
      • Other Industrial
    • Y-o-Y Growth Trend Analysis By End Use, 2020 to 2024
    • Absolute $ Opportunity Analysis By End Use, 2025 to 2035
  9. Global Market Analysis 2020 to 2024 and Forecast 2025 to 2035, By Region
    • Introduction
    • Historical Market Size Value (USD Million) & Volume (Metric Tons) Analysis By Region, 2020 to 2024
    • Current Market Size Value (USD Million) & Volume (Metric Tons) Analysis and Forecast By Region, 2025 to 2035
      • North America
      • Latin America
      • Western Europe
      • Eastern Europe
      • East Asia
      • South Asia & Pacific
      • Middle East and Africa
    • Market Attractiveness Analysis By Region
  10. North America Market Analysis 2020 to 2024 and Forecast 2025 to 2035, By Country
    • Historical Market Size Value (USD Million) & Volume (Metric Tons) Trend Analysis By Market Taxonomy, 2020 to 2024
    • Market Size Value (USD Million) & Volume (Metric Tons) Forecast By Market Taxonomy, 2025 to 2035
      • By Country
        • USA
        • Canada
        • Mexico
      • By Type of Material
      • By Product Type
      • By End Use
    • Market Attractiveness Analysis
      • By Country
      • By Type of Material
      • By Product Type
      • By End Use
    • Key Takeaways
  11. Latin America Market Analysis 2020 to 2024 and Forecast 2025 to 2035, By Country
    • Historical Market Size Value (USD Million) & Volume (Metric Tons) Trend Analysis By Market Taxonomy, 2020 to 2024
    • Market Size Value (USD Million) & Volume (Metric Tons) Forecast By Market Taxonomy, 2025 to 2035
      • By Country
        • Brazil
        • Argentina
        • Rest of LATAM
      • By Type of Material
      • By Product Type
      • By End Use
    • Market Attractiveness Analysis
      • By Country
      • By Type of Material
      • By Product Type
      • By End Use
    • Key Takeaways
  12. Western Europe Market Analysis 2020 to 2024 and Forecast 2025 to 2035, By Country
    • Historical Market Size Value (USD Million) & Volume (Metric Tons) Trend Analysis By Market Taxonomy, 2020 to 2024
    • Market Size Value (USD Million) & Volume (Metric Tons) Forecast By Market Taxonomy, 2025 to 2035
      • By Country
        • Germany
        • Italy
        • France
        • UK
        • Spain
        • BENELUX
        • Nordic
        • Rest of W.Europe
      • By Type of Material
      • By Product Type
      • By End Use
    • Market Attractiveness Analysis
      • By Country
      • By Type of Material
      • By Product Type
      • By End Use
    • Key Takeaways
  13. Eastern Europe Market Analysis 2020 to 2024 and Forecast 2025 to 2035, By Country
    • Historical Market Size Value (USD Million) & Volume (Metric Tons) Trend Analysis By Market Taxonomy, 2020 to 2024
    • Market Size Value (USD Million) & Volume (Metric Tons) Forecast By Market Taxonomy, 2025 to 2035
      • By Country
        • Russia
        • Hungary
        • Poland
        • Balkan & Baltics
        • Rest of E. Europe
      • By Type of Material
      • By Product Type
      • By End Use
    • Market Attractiveness Analysis
      • By Country
      • By Type of Material
      • By Product Type
      • By End Use
    • Key Takeaways
  14. East Asia Market Analysis 2020 to 2024 and Forecast 2025 to 2035, By Country
    • Historical Market Size Value (USD Million) & Volume (Metric Tons) Trend Analysis By Market Taxonomy, 2020 to 2024
    • Market Size Value (USD Million) & Volume (Metric Tons) Forecast By Market Taxonomy, 2025 to 2035
      • By Country
        • China
        • Japan
        • South Korea
      • By Type of Material
      • By Product Type
      • By End Use
    • Market Attractiveness Analysis
      • By Country
      • By Type of Material
      • By Product Type
      • By End Use
    • Key Takeaways
  15. South Asia & Pacific Market Analysis 2020 to 2024 and Forecast 2025 to 2035, By Country
    • Historical Market Size Value (USD Million) & Volume (Metric Tons) Trend Analysis By Market Taxonomy, 2020 to 2024
    • Market Size Value (USD Million) & Volume (Metric Tons) Forecast By Market Taxonomy, 2025 to 2035
      • By Country
        • India
        • Australia & New Zealand
        • ASEAN
        • Rest of SAP
      • By Type of Material
      • By Product Type
      • By End Use
    • Market Attractiveness Analysis
      • By Country
      • By Type of Material
      • By Product Type
      • By End Use
    • Key Takeaways
  16. Middle East and Africa Market Analysis 2020 to 2024 and Forecast 2025 to 2035, By Country
    • Historical Market Size Value (USD Million) & Volume (Metric Tons) Trend Analysis By Market Taxonomy, 2020 to 2024
    • Market Size Value (USD Million) & Volume (Metric Tons) Forecast By Market Taxonomy, 2025 to 2035
      • By Country
        • GCC Countries
        • Northern Africa
        • South Africa
        • Turkiye
        • Rest of MEA
      • By Type of Material
      • By Product Type
      • By End Use
    • Market Attractiveness Analysis
      • By Country
      • By Type of Material
      • By Product Type
      • By End Use
    • Key Takeaways
  17. Key Countries Market Analysis
    • USA
      • Pricing Analysis
      • Market Share Analysis, 2024
        • By Type of Material
        • By Product Type
        • By End Use
    • Canada
      • Pricing Analysis
      • Market Share Analysis, 2024
        • By Type of Material
        • By Product Type
        • By End Use
    • Brazil
      • Pricing Analysis
      • Market Share Analysis, 2024
        • By Type of Material
        • By Product Type
        • By End Use
    • Mexico
      • Pricing Analysis
      • Market Share Analysis, 2024
        • By Type of Material
        • By Product Type
        • By End Use
    • Argentina
      • Pricing Analysis
      • Market Share Analysis, 2024
        • By Type of Material
        • By Product Type
        • By End Use
  18. Market Structure Analysis
    • Competition Dashboard
    • Competition Benchmarking
    • Market Share Analysis of Top Players
      • By Regional
      • By Type of Material
      • By Product Type
      • By End Use
  19. Competition Analysis
    • Competition Deep Dive
      • The Smurfit Kappa Group plc
        • Overview
        • Product Portfolio
        • Profitability by Market Segments (Product/Age /Sales Channel/Region)
        • Sales Footprint
        • Strategy Overview
          • Marketing Strategy
          • Product Strategy
          • Channel Strategy
      • F-D-S Manufacturing Company
        • Overview
        • Product Portfolio
        • Profitability by Market Segments (Product/Age /Sales Channel/Region)
        • Sales Footprint
        • Strategy Overview
          • Marketing Strategy
          • Product Strategy
          • Channel Strategy
      • Packaging Corporation of America
        • Overview
        • Product Portfolio
        • Profitability by Market Segments (Product/Age /Sales Channel/Region)
        • Sales Footprint
        • Strategy Overview
          • Marketing Strategy
          • Product Strategy
          • Channel Strategy
      • Sonoco Products Company
        • Overview
        • Product Portfolio
        • Profitability by Market Segments (Product/Age /Sales Channel/Region)
        • Sales Footprint
        • Strategy Overview
          • Marketing Strategy
          • Product Strategy
          • Channel Strategy
      • VPK Packaging Group NV
        • Overview
        • Product Portfolio
        • Profitability by Market Segments (Product/Age /Sales Channel/Region)
        • Sales Footprint
        • Strategy Overview
          • Marketing Strategy
          • Product Strategy
          • Channel Strategy
      • Cascades Inc.
        • Overview
        • Product Portfolio
        • Profitability by Market Segments (Product/Age /Sales Channel/Region)
        • Sales Footprint
        • Strategy Overview
          • Marketing Strategy
          • Product Strategy
          • Channel Strategy
      • Napco National
        • Overview
        • Product Portfolio
        • Profitability by Market Segments (Product/Age /Sales Channel/Region)
        • Sales Footprint
        • Strategy Overview
          • Marketing Strategy
          • Product Strategy
          • Channel Strategy
      • Cordstrap B.V.
        • Overview
        • Product Portfolio
        • Profitability by Market Segments (Product/Age /Sales Channel/Region)
        • Sales Footprint
        • Strategy Overview
          • Marketing Strategy
          • Product Strategy
          • Channel Strategy
      • Signode Industrial Group
        • Overview
        • Product Portfolio
        • Profitability by Market Segments (Product/Age /Sales Channel/Region)
        • Sales Footprint
        • Strategy Overview
          • Marketing Strategy
          • Product Strategy
          • Channel Strategy
      • Kunert Group
        • Overview
        • Product Portfolio
        • Profitability by Market Segments (Product/Age /Sales Channel/Region)
        • Sales Footprint
        • Strategy Overview
          • Marketing Strategy
          • Product Strategy
          • Channel Strategy
  20. Assumptions & Acronyms Used
  21. Research Methodology

List of Tables

  • Table 1: Global Market Value (USD Million) Forecast by Region, 2020 to 2035
  • Table 2: Global Market Volume (Metric Tons) Forecast by Region, 2020 to 2035
  • Table 3: Global Market Value (USD Million) Forecast by Type of Material, 2020 to 2035
  • Table 4: Global Market Volume (Metric Tons) Forecast by Type of Material, 2020 to 2035
  • Table 5: Global Market Value (USD Million) Forecast by Product Type, 2020 to 2035
  • Table 6: Global Market Volume (Metric Tons) Forecast by Product Type, 2020 to 2035
  • Table 7: Global Market Value (USD Million) Forecast by End Use, 2020 to 2035
  • Table 8: Global Market Volume (Metric Tons) Forecast by End Use, 2020 to 2035
  • Table 9: North America Market Value (USD Million) Forecast by Country, 2020 to 2035
  • Table 10: North America Market Volume (Metric Tons) Forecast by Country, 2020 to 2035
  • Table 11: North America Market Value (USD Million) Forecast by Type of Material, 2020 to 2035
  • Table 12: North America Market Volume (Metric Tons) Forecast by Type of Material, 2020 to 2035
  • Table 13: North America Market Value (USD Million) Forecast by Product Type, 2020 to 2035
  • Table 14: North America Market Volume (Metric Tons) Forecast by Product Type, 2020 to 2035
  • Table 15: North America Market Value (USD Million) Forecast by End Use, 2020 to 2035
  • Table 16: North America Market Volume (Metric Tons) Forecast by End Use, 2020 to 2035
  • Table 17: Latin America Market Value (USD Million) Forecast by Country, 2020 to 2035
  • Table 18: Latin America Market Volume (Metric Tons) Forecast by Country, 2020 to 2035
  • Table 19: Latin America Market Value (USD Million) Forecast by Type of Material, 2020 to 2035
  • Table 20: Latin America Market Volume (Metric Tons) Forecast by Type of Material, 2020 to 2035
  • Table 21: Latin America Market Value (USD Million) Forecast by Product Type, 2020 to 2035
  • Table 22: Latin America Market Volume (Metric Tons) Forecast by Product Type, 2020 to 2035
  • Table 23: Latin America Market Value (USD Million) Forecast by End Use, 2020 to 2035
  • Table 24: Latin America Market Volume (Metric Tons) Forecast by End Use, 2020 to 2035
  • Table 25: Western Europe Market Value (USD Million) Forecast by Country, 2020 to 2035
  • Table 26: Western Europe Market Volume (Metric Tons) Forecast by Country, 2020 to 2035
  • Table 27: Western Europe Market Value (USD Million) Forecast by Type of Material, 2020 to 2035
  • Table 28: Western Europe Market Volume (Metric Tons) Forecast by Type of Material, 2020 to 2035
  • Table 29: Western Europe Market Value (USD Million) Forecast by Product Type, 2020 to 2035
  • Table 30: Western Europe Market Volume (Metric Tons) Forecast by Product Type, 2020 to 2035
  • Table 31: Western Europe Market Value (USD Million) Forecast by End Use, 2020 to 2035
  • Table 32: Western Europe Market Volume (Metric Tons) Forecast by End Use, 2020 to 2035
  • Table 33: Eastern Europe Market Value (USD Million) Forecast by Country, 2020 to 2035
  • Table 34: Eastern Europe Market Volume (Metric Tons) Forecast by Country, 2020 to 2035
  • Table 35: Eastern Europe Market Value (USD Million) Forecast by Type of Material, 2020 to 2035
  • Table 36: Eastern Europe Market Volume (Metric Tons) Forecast by Type of Material, 2020 to 2035
  • Table 37: Eastern Europe Market Value (USD Million) Forecast by Product Type, 2020 to 2035
  • Table 38: Eastern Europe Market Volume (Metric Tons) Forecast by Product Type, 2020 to 2035
  • Table 39: Eastern Europe Market Value (USD Million) Forecast by End Use, 2020 to 2035
  • Table 40: Eastern Europe Market Volume (Metric Tons) Forecast by End Use, 2020 to 2035
  • Table 41: East Asia Market Value (USD Million) Forecast by Country, 2020 to 2035
  • Table 42: East Asia Market Volume (Metric Tons) Forecast by Country, 2020 to 2035
  • Table 43: East Asia Market Value (USD Million) Forecast by Type of Material, 2020 to 2035
  • Table 44: East Asia Market Volume (Metric Tons) Forecast by Type of Material, 2020 to 2035
  • Table 45: East Asia Market Value (USD Million) Forecast by Product Type, 2020 to 2035
  • Table 46: East Asia Market Volume (Metric Tons) Forecast by Product Type, 2020 to 2035
  • Table 47: East Asia Market Value (USD Million) Forecast by End Use, 2020 to 2035
  • Table 48: East Asia Market Volume (Metric Tons) Forecast by End Use, 2020 to 2035
  • Table 49: South Asia & Pacific Market Value (USD Million) Forecast by Country, 2020 to 2035
  • Table 50: South Asia & Pacific Market Volume (Metric Tons) Forecast by Country, 2020 to 2035
  • Table 51: South Asia & Pacific Market Value (USD Million) Forecast by Type of Material, 2020 to 2035
  • Table 52: South Asia & Pacific Market Volume (Metric Tons) Forecast by Type of Material, 2020 to 2035
  • Table 53: South Asia & Pacific Market Value (USD Million) Forecast by Product Type, 2020 to 2035
  • Table 54: South Asia & Pacific Market Volume (Metric Tons) Forecast by Product Type, 2020 to 2035
  • Table 55: South Asia & Pacific Market Value (USD Million) Forecast by End Use, 2020 to 2035
  • Table 56: South Asia & Pacific Market Volume (Metric Tons) Forecast by End Use, 2020 to 2035
  • Table 57: Middle East and Africa Market Value (USD Million) Forecast by Country, 2020 to 2035
  • Table 58: Middle East and Africa Market Volume (Metric Tons) Forecast by Country, 2020 to 2035
  • Table 59: Middle East and Africa Market Value (USD Million) Forecast by Type of Material, 2020 to 2035
  • Table 60: Middle East and Africa Market Volume (Metric Tons) Forecast by Type of Material, 2020 to 2035
  • Table 61: Middle East and Africa Market Value (USD Million) Forecast by Product Type, 2020 to 2035
  • Table 62: Middle East and Africa Market Volume (Metric Tons) Forecast by Product Type, 2020 to 2035
  • Table 63: Middle East and Africa Market Value (USD Million) Forecast by End Use, 2020 to 2035
  • Table 64: Middle East and Africa Market Volume (Metric Tons) Forecast by End Use, 2020 to 2035

List of Figures

  • Figure 1: Global Market Volume (Metric Tons) Forecast 2020 to 2035
  • Figure 2: Global Market Pricing Analysis
  • Figure 3: Global Market Value (USD Million) Forecast 2020 to 2035
  • Figure 4: Global Market Value Share and BPS Analysis by Type of Material, 2025 and 2035
  • Figure 5: Global Market Y-o-Y Growth Comparison by Type of Material, 2025 to 2035
  • Figure 6: Global Market Attractiveness Analysis by Type of Material
  • Figure 7: Global Market Value Share and BPS Analysis by Product Type, 2025 and 2035
  • Figure 8: Global Market Y-o-Y Growth Comparison by Product Type, 2025 to 2035
  • Figure 9: Global Market Attractiveness Analysis by Product Type
  • Figure 10: Global Market Value Share and BPS Analysis by End Use, 2025 and 2035
  • Figure 11: Global Market Y-o-Y Growth Comparison by End Use, 2025 to 2035
  • Figure 12: Global Market Attractiveness Analysis by End Use
  • Figure 13: Global Market Value (USD Million) Share and BPS Analysis by Region, 2025 and 2035
  • Figure 14: Global Market Y-o-Y Growth Comparison by Region, 2025 to 2035
  • Figure 15: Global Market Attractiveness Analysis by Region
  • Figure 16: North America Market Incremental $ Opportunity, 2025 to 2035
  • Figure 17: Latin America Market Incremental $ Opportunity, 2025 to 2035
  • Figure 18: Western Europe Market Incremental $ Opportunity, 2025 to 2035
  • Figure 19: Eastern Europe Market Incremental $ Opportunity, 2025 to 2035
  • Figure 20: East Asia Market Incremental $ Opportunity, 2025 to 2035
  • Figure 21: South Asia & Pacific Market Incremental $ Opportunity, 2025 to 2035
  • Figure 22: Middle East and Africa Market Incremental $ Opportunity, 2025 to 2035
  • Figure 23: North America Market Value Share and BPS Analysis by Country, 2025 and 2035
  • Figure 24: North America Market Value Share and BPS Analysis by Type of Material, 2025 and 2035
  • Figure 25: North America Market Y-o-Y Growth Comparison by Type of Material, 2025 to 2035
  • Figure 26: North America Market Attractiveness Analysis by Type of Material
  • Figure 27: North America Market Value Share and BPS Analysis by Product Type, 2025 and 2035
  • Figure 28: North America Market Y-o-Y Growth Comparison by Product Type, 2025 to 2035
  • Figure 29: North America Market Attractiveness Analysis by Product Type
  • Figure 30: North America Market Value Share and BPS Analysis by End Use, 2025 and 2035
  • Figure 31: North America Market Y-o-Y Growth Comparison by End Use, 2025 to 2035
  • Figure 32: North America Market Attractiveness Analysis by End Use
  • Figure 33: Latin America Market Value Share and BPS Analysis by Country, 2025 and 2035
  • Figure 34: Latin America Market Value Share and BPS Analysis by Type of Material, 2025 and 2035
  • Figure 35: Latin America Market Y-o-Y Growth Comparison by Type of Material, 2025 to 2035
  • Figure 36: Latin America Market Attractiveness Analysis by Type of Material
  • Figure 37: Latin America Market Value Share and BPS Analysis by Product Type, 2025 and 2035
  • Figure 38: Latin America Market Y-o-Y Growth Comparison by Product Type, 2025 to 2035
  • Figure 39: Latin America Market Attractiveness Analysis by Product Type
  • Figure 40: Latin America Market Value Share and BPS Analysis by End Use, 2025 and 2035
  • Figure 41: Latin America Market Y-o-Y Growth Comparison by End Use, 2025 to 2035
  • Figure 42: Latin America Market Attractiveness Analysis by End Use
  • Figure 43: Western Europe Market Value Share and BPS Analysis by Country, 2025 and 2035
  • Figure 44: Western Europe Market Value Share and BPS Analysis by Type of Material, 2025 and 2035
  • Figure 45: Western Europe Market Y-o-Y Growth Comparison by Type of Material, 2025 to 2035
  • Figure 46: Western Europe Market Attractiveness Analysis by Type of Material
  • Figure 47: Western Europe Market Value Share and BPS Analysis by Product Type, 2025 and 2035
  • Figure 48: Western Europe Market Y-o-Y Growth Comparison by Product Type, 2025 to 2035
  • Figure 49: Western Europe Market Attractiveness Analysis by Product Type
  • Figure 50: Western Europe Market Value Share and BPS Analysis by End Use, 2025 and 2035
  • Figure 51: Western Europe Market Y-o-Y Growth Comparison by End Use, 2025 to 2035
  • Figure 52: Western Europe Market Attractiveness Analysis by End Use
  • Figure 53: Eastern Europe Market Value Share and BPS Analysis by Country, 2025 and 2035
  • Figure 54: Eastern Europe Market Value Share and BPS Analysis by Type of Material, 2025 and 2035
  • Figure 55: Eastern Europe Market Y-o-Y Growth Comparison by Type of Material, 2025 to 2035
  • Figure 56: Eastern Europe Market Attractiveness Analysis by Type of Material
  • Figure 57: Eastern Europe Market Value Share and BPS Analysis by Product Type, 2025 and 2035
  • Figure 58: Eastern Europe Market Y-o-Y Growth Comparison by Product Type, 2025 to 2035
  • Figure 59: Eastern Europe Market Attractiveness Analysis by Product Type
  • Figure 60: Eastern Europe Market Value Share and BPS Analysis by End Use, 2025 and 2035
  • Figure 61: Eastern Europe Market Y-o-Y Growth Comparison by End Use, 2025 to 2035
  • Figure 62: Eastern Europe Market Attractiveness Analysis by End Use
  • Figure 63: East Asia Market Value Share and BPS Analysis by Country, 2025 and 2035
  • Figure 64: East Asia Market Value Share and BPS Analysis by Type of Material, 2025 and 2035
  • Figure 65: East Asia Market Y-o-Y Growth Comparison by Type of Material, 2025 to 2035
  • Figure 66: East Asia Market Attractiveness Analysis by Type of Material
  • Figure 67: East Asia Market Value Share and BPS Analysis by Product Type, 2025 and 2035
  • Figure 68: East Asia Market Y-o-Y Growth Comparison by Product Type, 2025 to 2035
  • Figure 69: East Asia Market Attractiveness Analysis by Product Type
  • Figure 70: East Asia Market Value Share and BPS Analysis by End Use, 2025 and 2035
  • Figure 71: East Asia Market Y-o-Y Growth Comparison by End Use, 2025 to 2035
  • Figure 72: East Asia Market Attractiveness Analysis by End Use
  • Figure 73: South Asia & Pacific Market Value Share and BPS Analysis by Country, 2025 and 2035
  • Figure 74: South Asia & Pacific Market Value Share and BPS Analysis by Type of Material, 2025 and 2035
  • Figure 75: South Asia & Pacific Market Y-o-Y Growth Comparison by Type of Material, 2025 to 2035
  • Figure 76: South Asia & Pacific Market Attractiveness Analysis by Type of Material
  • Figure 77: South Asia & Pacific Market Value Share and BPS Analysis by Product Type, 2025 and 2035
  • Figure 78: South Asia & Pacific Market Y-o-Y Growth Comparison by Product Type, 2025 to 2035
  • Figure 79: South Asia & Pacific Market Attractiveness Analysis by Product Type
  • Figure 80: South Asia & Pacific Market Value Share and BPS Analysis by End Use, 2025 and 2035
  • Figure 81: South Asia & Pacific Market Y-o-Y Growth Comparison by End Use, 2025 to 2035
  • Figure 82: South Asia & Pacific Market Attractiveness Analysis by End Use
  • Figure 83: Middle East and Africa Market Value Share and BPS Analysis by Country, 2025 and 2035
  • Figure 84: Middle East and Africa Market Value Share and BPS Analysis by Type of Material, 2025 and 2035
  • Figure 85: Middle East and Africa Market Y-o-Y Growth Comparison by Type of Material, 2025 to 2035
  • Figure 86: Middle East and Africa Market Attractiveness Analysis by Type of Material
  • Figure 87: Middle East and Africa Market Value Share and BPS Analysis by Product Type, 2025 and 2035
  • Figure 88: Middle East and Africa Market Y-o-Y Growth Comparison by Product Type, 2025 to 2035
  • Figure 89: Middle East and Africa Market Attractiveness Analysis by Product Type
  • Figure 90: Middle East and Africa Market Value Share and BPS Analysis by End Use, 2025 and 2035
  • Figure 91: Middle East and Africa Market Y-o-Y Growth Comparison by End Use, 2025 to 2035
  • Figure 92: Middle East and Africa Market Attractiveness Analysis by End Use
  • Figure 93: Global Market - Tier Structure Analysis
  • Figure 94: Global Market - Company Share Analysis

Frequently Asked Questions

What is the corner pads market size in 2025?

The corner pads market is expected to reach USD 495.1 million in 2025.

What is the projected size of the corner pads market by 2035?

The corner pads market is projected to reach USD 1,470.4 million by 2035.

What is the CAGR for the corner pads market from 2025 to 2035?

The corner pads market is anticipated to grow at a CAGR of 11.5% between 2025 and 2035.

Which material type dominates the corner pads market?

Other materials lead the corner pads market with a 51% share in 2025, slightly ahead of paper at 49%.

Which product type holds the largest share in the corner pads market?

Angular edge corner pads hold the largest share at 54% in 2025.

Who is the leading player in the corner pads market?

The Smurfit Kappa Group plc leads the corner pads market with a 32% share in 2025.

Explore Similar Insights

Future Market Insights

Corner Pads Market