Upcycled Banana Flour Market Size and Share Forecast Outlook 2025 to 2035

The upcycled banana flour market is being valued at USD 210.1 million in 2025, with projections rising to USD 306.1 million by 2035, at a CAGR of 3.8%. Growth is being driven by demand for gluten-free, resistant starch ingredients in bakery, baby food, and supplements.
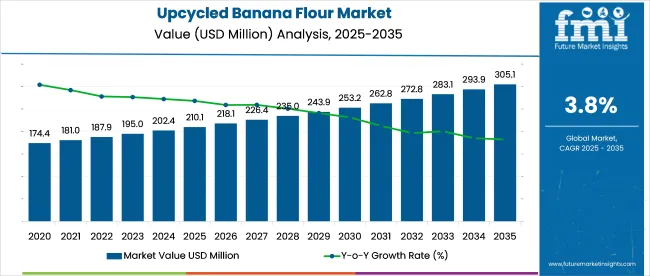
Quick Stats of the Upcycled Banana Flour Market

  • Industry Size (2025): USD 210.1 million
  • Industry Value (2035): USD 306.1 million
  • Forecast CAGR (2025 to 2035): 3.8%
  • Leading Segment: Overripe Bananas (43%)
  • Key Growth Region: South Asia (India)
  • Key Players: WEDO Gluten Free, BanFlour Co., KADAC Australia, Miski Organics, International Agriculture Group

Upcycled Banana Flour Market

Attribute Detail
Market Size (2025) USD 210.1 million
Market Size (2035) USD 306.1 million
CAGR (2025 to 2035) 3.8%

Powdered green banana flour is being favored for its blendability and prebiotic content, while organic and conventional variants are being positioned for clean label offerings. It is argued that brand differentiation will come from flavored blends and bulk-scale direct sourcing from smallholder growers. However, it is suggested that fragmented processing infrastructure and limited consumer awareness may restrain broader distribution unless educational endorsing and supply chain transparency are prioritized.

In April 2023, Diana’s Bananas CEO Neil Cox highlighted the growing potential of upcycled banana-based products, a category that includes banana flour made from cosmetically imperfect fruit. As food manufacturers and consumers increasingly seek sustainable ingredient solutions, upcycled banana flour has gained attention for its nutritional benefits, long shelf life, and utility in gluten-free baking.

Cox underscored the importance of diverting food waste from landfills by leveraging surplus bananas into value-added products. Addressing this shift, Neil Cox, CEO of Diana’s Bananas, stated, “The bananas are not bad; they simply don’t fit the aesthetic standards of the primary supply chain buyers.”

The industry holds a niche share within its parent markets. In the flour market, it accounts for approximately 1-2%, as it is a specialty product compared to more commonly used flours like wheat and corn. Within the organic food market, its share is around 3-5%, driven by the growing demand for organic, sustainable ingredients.

In the food ingredients market, the share is approximately 2-3%, as it is used in a variety of food products for its functional properties. In the health and wellness food market, the share is about 3-4%, as it is recognized for its nutritional benefits. In the sustainable food market, the share is around 4-6%, reflecting the increasing preference for upcycled and eco-friendly food ingredients.

Analyzing Upcycled Banana Flour Market by Top Investment Segments

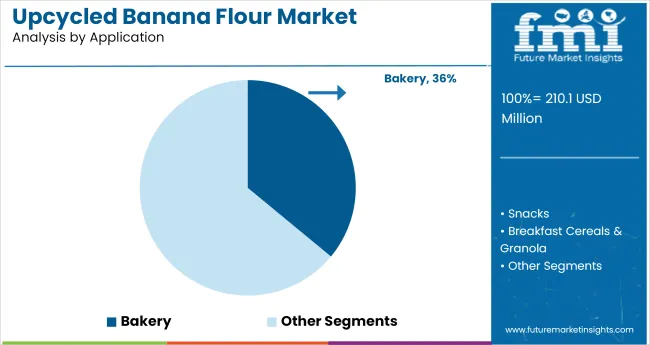
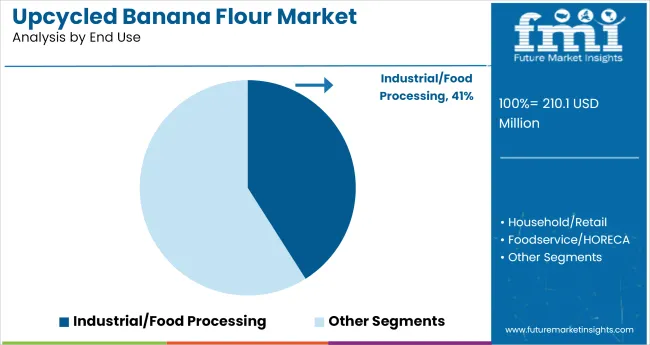
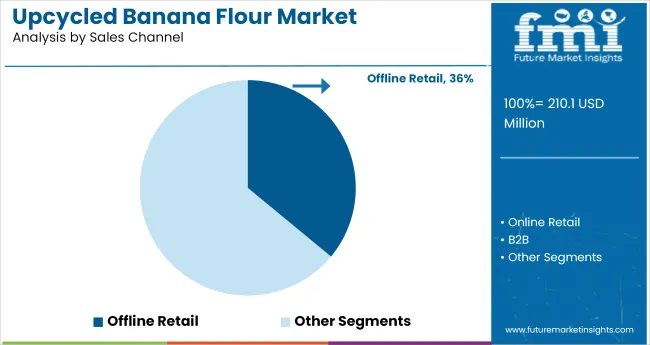
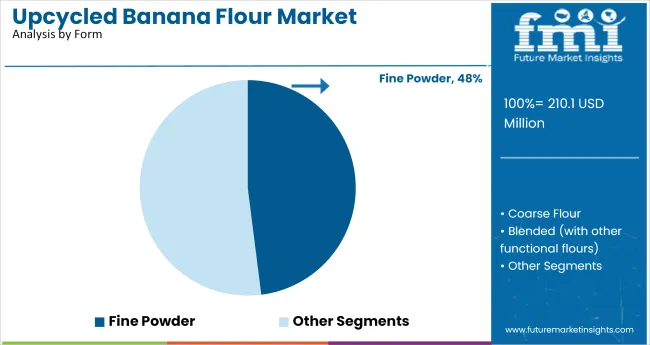
The industry in 2025 is expected to see overripe bananas leading the source segment with 43% industry share, bakery applications at 36%, gluten-free functionality at 32%, and industrial/food processing holding 41% of the end-use segment. Offline retail will account for 36% of the sales channel, and fine powder form will dominate with 48%. Mechanical dehydration and milling technology will lead the industry with a 38% share.
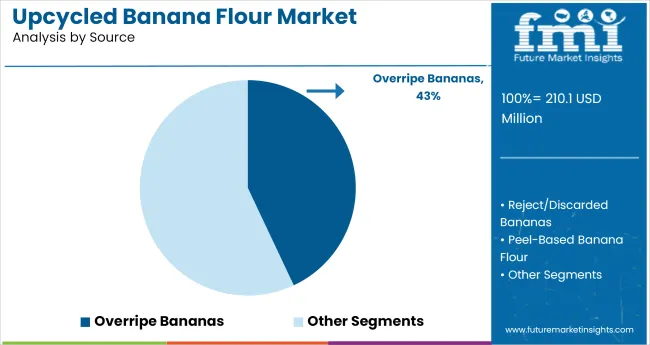
Overripe bananas lead source segment with 43% industry share

Upcycled Banana Flour Market Analysis By Source

Overripe bananas are expected to capture 43% of the source segment in the industry in 2025. These bananas, which are typically discarded due to their ripeness, are ideal for upcycling into flour, offering a sustainable and eco-friendly alternative.

The growing demand for plant-based, gluten-free, and natural products drives the use of overripe bananas in banana flour production. This segment's dominance reflects increasing efforts to minimize food waste, with overripe bananas providing a valuable resource for the growing industry of sustainable food ingredients.
  • Utilizes bananas that would otherwise go to waste, supporting sustainability efforts
  • Highly sought after for their nutritional benefits and minimal processing requirements
  • Ideal for eco-friendly flour production, contributing to reduced food waste

Bakery applications dominate with 36% industry share

Upcycled Banana Flour Market Analysis By Application

Bakery applications, including bread, cakes, muffins, and cookies, are projected to hold 36% of the industry share in 2025. Banana flour is gaining popularity in the bakery sector due to its gluten-free nature and natural sweetness, making it a great alternative to traditional wheat flour.

As the demand for gluten-free and allergen-free products rises, upcycled banana flour offers a functional and nutritious alternative for consumers. The versatility of banana flour in baked goods, paired with its health benefits, further boosts its demand in the bakery industry.

  • Growing demand for gluten-free and allergen-free baked goods boosts industry share
  • Natural sweetness and nutrition make banana flour a popular choice for cakes, bread, and cookies
  • Increasing consumer preference for plant-based, clean-label ingredients drives adoption in bakery products

Gluten-free functionality leads with 32% industry share

Gluten-free functionality is expected to account for 32% of the industry share in 2025. As consumers continue to shift toward gluten-free diets, driven by health-conscious choices and dietary restrictions, banana flour’s gluten-free properties make it a highly sought-after ingredient.

Banana flour is an ideal alternative to wheat flour for people with gluten sensitivity or celiac disease, making it a vital component in many gluten-free food products. The growing gluten-free trend, especially in baked goods and packaged foods, ensures that banana flour’s gluten-free functionality remains a key selling point in the industry.
  • Strong demand for gluten-free alternatives in the food industry drives industry growth
  • Ideal for people with gluten sensitivities or celiac disease, ensuring increased adoption
  • Integral in the growing trend of plant-based and allergen-free food products

Industrial/food processing leads end-use segment with 41% industry share

Upcycled Banana Flour Market Analysis By End Use

Industrial and food processing applications are projected to capture 41% of the industry share in 2025. Upcycled banana flour is increasingly used in large-scale food processing for its versatile applications in snacks, ready-to-eat meals, and nutritional products.

The increasing use of sustainable ingredients in the food processing industry, alongside growing consumer demand for natural, functional foods, makes banana flour a key ingredient in processed food formulations. Its ability to improve texture, add nutritional value, and offer cost-effective solutions contributes to its growing presence in the industrial food sector.
  • Used in large-scale food production for its versatility and functional properties
  • Drives demand for sustainable and clean-label food ingredients in the processing sector
  • Widely adopted in snacks, nutritional products, and ready-to-eat meals

Offline retail dominates sales channel with 36% industry share

Upcycled Banana Flour Market Analysis By Sales Channel

Offline retail is expected to hold 36% of the sales channel industry share in 2025. Supermarkets, health food stores, and specialty retail outlets are driving the demand for upcycled banana flour, providing consumers with easy access to gluten-free, plant-based, and sustainable ingredients.

The growing popularity of health-conscious and sustainable food products in retail industries supports the industry dominance of offline channels. As more consumers opt for clean-label products, banana flour’s appeal in mainstream grocery stores continues to expand, offering convenient access to nutritious alternatives.
  • Accessible in health food stores and supermarkets, increasing consumer reach
  • Retail demand driven by health-conscious consumers seeking sustainable ingredients
  • Expanding availability of upcycled banana flour in mainstream grocery outlets boosts sales

Fine powder leads form segment with 48% industry share

Upcycled Banana Flour Market Analysis By Form

Fine powder is projected to capture 48% of the industry share in the form segment in 2025. The fine powder form of upcycled banana flour is highly preferred due to its versatility in various food applications, ease of mixing, and suitability for baking and cooking.

Its fine texture makes it ideal for producing smooth batters, dough, and other food products, ensuring consistency in finished goods. The fine powder form also facilitates easier packaging and distribution, making it the leading choice for manufacturers and consumers alike.

  • Versatile and easy to incorporate into various food applications, including baking
  • Ensures smooth texture and consistency in food products, enhancing product quality
  • Preferred form for both industrial use and consumer convenience in food production

Mechanical dehydration & milling leads technology segment with 38% industry share

Mechanical dehydration and milling are projected to capture 38% of the technology industry share in 2025. This technology is essential for transforming fresh bananas into flour by effectively removing moisture and grinding the dried product into a fine powder.

The mechanical process ensures minimal nutritional loss while maintaining the natural properties of the banana. As the demand for upcycled, clean-label ingredients rises, mechanical dehydration and milling offer a cost-effective and efficient method of producing high-quality banana flour.

  • Efficiently removes moisture while maintaining the natural properties of the fruit
  • Minimizes nutritional loss, ensuring high-quality, nutrient-dense flour
  • Cost-effective and scalable for large-scale production, meeting rising industry demand

Top Upcycled Banana Flour Market Dynamics

The industry is expanding due to the growing demand for gluten-free and high-fiber food products. However, challenges such as limited awareness, logistical inefficiencies, and high production costs hinder broader industry adoption, particularly in less informed regions.

Increasing Demand for Nutritional, Gluten-Free Alternatives

The industry is gaining momentum, driven by the increasing consumer preference for gluten-free, high-fiber alternatives to traditional wheat flour. As more people seek healthier, plant-based diets and better digestive health options, banana flour, made from surplus bananas, is emerging as a key ingredient. With its ability to support gut health, regulate blood sugar, and provide essential nutrients, it is becoming a popular choice for gluten-free baking, snack production, and dietary supplements, expanding its industry footprint.

  • Consumer demand for gluten-free and high-fiber foods is rising.
  • Health-conscious eating habits drive adoption of banana flour.
  • Banana flour supports digestive health and blood sugar regulation.

Challenges in Industry Penetration and Supply Chain

Despite its growth potential, the industry faces significant barriers, particularly in consumer awareness and supply chain management. Many consumers remain unfamiliar with banana flour’s benefits and applications, which limits its adoption, especially in mainstream grocery stores. Additionally, producing upcycled banana flour requires a consistent supply of surplus bananas, which is susceptible to seasonal variability and logistical challenges. These issues contribute to price volatility and inconsistent availability, hindering wider industry penetration.
  • Consumer awareness of banana flour is still limited.
  • Seasonal supply issues affect availability and price stability.
  • Logistical challenges and inconsistent sourcing disrupt production efficiency.

Top Countries Scaling, Reformulating, and Utilizing Upcycled Banana Flour

Country Wise Analysis Of Upcycled Banana Flour Market

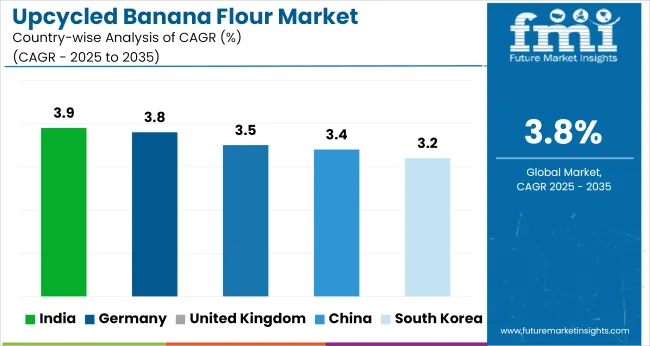
Countries CAGR (2025 to 2035)
United Kingdom 3.5%
China 3.4%
India 3.9%
South Korea 3.2%
Germany 3.8%

Global industry demand is projected to rise at a 3.8% CAGR from 2025 to 2035. Of the five profiled countries out of 40 covered, India leads at 3.9%, followed by Germany at 3.8%, and the United Kingdom at 3.5%, while China records 3.4% and South Korea posts 3.2%.

These rates translate to a growth premium of +3% for India, -1% for Germany, and -9% for the United Kingdom versus the baseline, while China and South Korea show slower growth. Divergence reflects local catalysts: increasing awareness of sustainable food production and nutrition in India, steady demand in Germany driven by eco-conscious food trends, and slower adoption in more mature industries like China and South Korea due to less focus on upcycled ingredients.

Growth Analysis of the Upcycled Banana Flour Market in the United Kingdom

The industry in the United Kingdom is projected to expand at a CAGR of 3.5% between 2025 and 2035. Food manufacturers are introducing banana flour in gluten-free bakery ranges, aligning with consumer demand for functional foods. Regulatory alignment under the Food Standards Agency permits clean-label advertising of banana-derived flours as natural dietary fibers.

Sales are rising in vegan and allergen-free product lines in both mainstream supermarkets and independent organic retailers. The country’s circular economy policies have accelerated food waste valorization, strengthening local sourcing of surplus bananas into value-added flours across premium food categories.

  • UK-based flour startups are adding banana flour to cake and pancake mixes.
  • Private-label bakery brands are launching banana flour biscuits for diabetic consumers.
  • Regional surplus banana processors have secured EU-backed funding for upcycling technologies.

Demand Forecast for Upcycled Banana Flour in China

China’s industry is forecast to grow at a CAGR of 3.4% from 2025 to 2035. Industrial food processors have begun utilizing banana flour in low-GI noodle production. Provincial governments encourage fruit waste valorization as part of zero-food-loss directives.

Health food brands are using banana flour to lower sugar content in meal replacements and functional beverages. Distribution remains concentrated in specialty nutrition outlets in first-tier cities. Imports of green bananas from Southeast Asia are being diverted into flour manufacturing lines as functional food categories expand.

  • Shanghai pilot plants use green banana flour in low-carb instant porridge lines.
  • Food chains now offer smoothies and protein bowls with banana flour enrichment.
  • China Customs revised import codes to classify banana flour under novel starch categories.

Future Outlook for the Upcycled Banana Flour Market in India

India’s industry is expected to expand at a CAGR of 3.9% through 2035. Agro-processing clusters in Tamil Nadu and Maharashtra are converting banana rejects into flour for bakery, infant food, and snack sectors. Food Safety and Standards Authority of India (FSSAI) has approved banana flour as a source of dietary fiber in functional food categories.

Ayurvedic nutrition brands are advertising banana flour as gut-friendly and diabetic-safe. Growth is driven by export demand and domestic interest in fiber-rich staples.

  • Online retailers list banana flour-based roti mixes in diabetic food bundles.
  • FSSAI-recognized startups receive incubation support for flour processing scalability.
  • Banana producer cooperatives have built solar-drying units for pre-flour dehydration steps.

Analysis of Upcycled Banana Flour Market Trends in South Korea

The industry in South Korea is projected to grow at a CAGR of 3.2% from 2025 to 2035. Major beverage manufacturers are testing banana flour in dairy-alternative smoothies. Local upcycling tech incubators are supporting banana waste valorization with enzyme-assisted processing lines.

Consumers seeking low-FODMAP and hypoallergenic foods are embracing banana flour in breakfast mixes and children’s snacks. Health claims are supported through collaborations between universities and packaged food manufacturers.

  • Convenience stores now stock banana flour protein bars under fitness sub-labels.
  • Banana flour is advertised as a skin-friendly prebiotic in cosmetic food formulations.
  • Retailers are bundling banana flour products with QR-code traceability of surplus origins.

Upcycled Banana Flour Market Growth Outlook in Germany

Germany’s industry is expected to grow at a CAGR of 3.8% from 2025 to 2035. Organic and bio-retailers have added banana flour products to gluten-free and clean-label sections. Federal grants are being disbursed to startups that convert food loss into marketable flours.

Importers of organic bananas from West Africa are processing unsold volumes into flour for use in sports nutrition and specialized infant formula. German consumer preferences for traceable, plant-based ingredients support consistent category expansion.
  • Banana flour cereals are featured in organic baby food campaigns across drugstore chains.
  • R&D facilities in Berlin have optimized cold-milling methods for enhanced fiber retention.
  • Local government food innovation grants support banana flour bakery pilots in Saxony.

Leading Upcycled Banana Flour Market Suppliers

Upcycled Banana Flour Market Analysis By Company

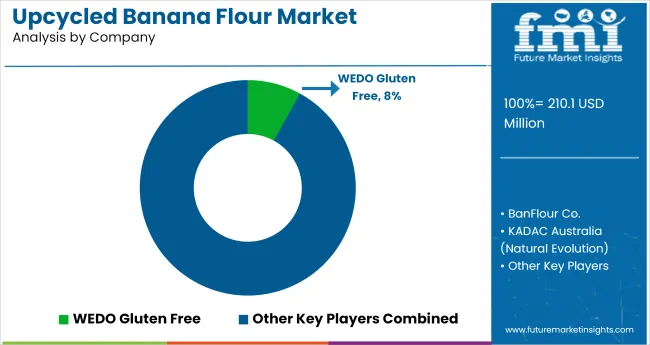
Leading Player - WEDO Gluten Free Industry Share - 8% share

In the industry, value is created through differentiation of product grade, upstream sourcing, and channel outreach. WEDO Gluten Free is positioned strongly in North America via grain-free baking lines and gluten-free certification, sourced from surplus bananas in USA partnerships.

Ban Flour Co. has captured Europe’s mass segment through co-manufacturing in banana-exporting countries and private-label deals with mainstream supermarkets. KADAC Australia (Natural Evolution) is being recognized in premium channels by focusing on organic and single-origin dried banana pulp sold online.

Miski Organics is serving health-conscious consumers in ASEAN using cold-press methods and DTC subscriptions. International Agriculture Group (NuBana™) is offering functional grade flour with higher resistant starch, navigating FDA and EU novel food approvals.

Recent Industry Developments

  • In 2025, a Turkish SME based in Alanya began producing gluten-free green banana flour and chips from surplus bananas. Fully managing its supply chain, the company is now seeking global distribution partners to expand its upcycled, traceable, plant-based product offerings.
  • In February 2025, Givaudan partnered with Dole Specialty Ingredients to distribute upcycled green banana powder across Europe and the Americas. This clean-label texturizer offers natural viscosity, replacing modified starches while reducing food waste and supporting healthier consumer choices in soups, sauces, snacks, and bakery applications.

Key Players

  • WEDO Gluten Free
  • BanFlour Co.
  • KADAC Australia (Natural Evolution)
  • Miski Organics
  • International Agriculture Group (NuBana™)
  • Others

Report Scope

Report Attributes Details
Industry Size (2025) USD 210.1 million
Industry Value (2035) USD 306.1 million
Forecast CAGR (2025 to 2035) 3.8%
Base Year for Estimation 2024
Historical Period 2020 to 2024
Projections Period 2025 to 2035
Quantitative Units USD million for value and tons for volume
Source Segmentation Overripe Bananas, Reject/Discarded Bananas, Peel-Based Banana Flour
Application Segmentation Bakery (Bread, Cakes, Muffins, Cookies), Snacks (Chips, Puffs, Bars), Breakfast Cereals & Granola, Baby Food, Dietary Supplements, Beverages (Smoothies, Shakes), Pet Food, Foodservice
Functionality/Claim Segmentation Gluten-Free, High Fiber, Resistant Starch, Prebiotic, Low Glycemic Index
End-Use Segmentation Household/Retail, Industrial/Food Processing, Foodservice/HORECA, Nutraceuticals
Sales Channel Segmentation Offline Retail (Supermarkets, Health Food Stores), Online Retail (Brand Websites, E-commerce Platforms), B2B (Bulk Ingredient Supply)
Form Segmentation Fine Powder, Coarse Flour, Blended (with other functional flours)
Technology Segmentation Mechanical Dehydration & Milling, Solar Drying + Milling, Spray Drying (for peel-based or extract blends), Vacuum Drying, Infrared or Microwave-Assisted Drying, Enzyme-Assisted Preprocessing (for improved nutrient release)
Regions Covered North America, Latin America, Europe, South Asia & Pacific, East Asia, Middle East & Africa
Countries Covered United States, Canada, Mexico, Brazil, Argentina, Germany, France, United Kingdom, Italy, Spain, Netherlands, China, India, Japan, South Korea, Australia, New Zealand, GCC Countries, South Africa
Key Players WEDO Gluten Free, BanFlour Co., KADAC Australia (Natural Evolution), Miski Organics, International Agriculture Group (NuBana ™)
Additional Attributes Dollar sales by source type, application, functionality, and form, growing demand for gluten-free and high-fiber alternatives, rising use of banana flour in plant-based diets, regional preferences in ingredient adoption and product innovation.

Key Segments

By Source:

Source segmentation includes Overripe Bananas, Reject/Discarded Bananas, and Peel-Based Banana Flour.

By Application:

Applications span Bakery (Bread, Cakes, Muffins, Cookies), Snacks (Chips, Puffs, Bars), Breakfast Cereals & Granola, Baby Food, Dietary Supplements, Beverages (Smoothies, Shakes), Pet Food, and Foodservice.

By Functionality/Claim:

Functionality-based segmentation includes Gluten-Free, High Fiber, Resistant Starch, Prebiotic, and Low Glycemic Index.

By End Use:

End-use categories include Household/Retail, Industrial/Food Processing, Foodservice/HORECA, and Nutraceuticals.

By Sales Channel:

Sales channels include Offline Retail (Supermarkets, Health Food Stores), Online Retail (Brand Websites, E-commerce Platforms), and B2B (Bulk Ingredient Supply).

By Form:

Form segmentation includes Fine Powder, Coarse Flour, and Blended (with other functional flours).

By Technology:

Technology categories include Mechanical Dehydration & Milling, Solar Drying + Milling, Spray Drying (for peel-based or extract blends), Vacuum Drying, Infrared or Microwave-Assisted Drying, and Enzyme-Assisted Preprocessing (for improved nutrient release).

By Region:

Regional analysis covers North America, Latin America, Europe, South Asia & Pacific, East Asia, and Middle East & Africa.

Table of Content

  1. Executive Summary
    • Global Market Outlook
    • Demand-side Trends
    • Supply-side Trends
    • Technology Roadmap Analysis
    • Analysis and Recommendations
  2. Market Overview
    • Market Coverage/Taxonomy
    • Market Definition/Scope/Limitations
  3. Market Background
    • Market Dynamics
      • Drivers
      • Restraints
      • Opportunity
      • Trends
    • Scenario Forecast
      • Demand in Optimistic Scenario
      • Demand in Likely Scenario
      • Demand in Conservative Scenario
    • Opportunity Map Analysis
    • Product Life Cycle Analysis
    • Supply Chain Analysis
      • Supply Side Participants and their Roles
        • Producers
        • Mid-Level Participants (Traders/ Agents/ Brokers)
        • Wholesalers and Distributors
      • Value Added and Value Created at Node in the Supply Chain
      • List of Raw Material Suppliers
      • List of Existing and Potential Buyer’s
    • Investment Feasibility Matrix
    • Value Chain Analysis
      • Profit Margin Analysis
      • Wholesalers and Distributors
      • Retailers
    • PESTLE and Porter’s Analysis
    • Regulatory Landscape
      • By Key Regions
      • By Key Countries
    • Regional Parent Market Outlook
    • Production and Consumption Statistics
    • Import and Export Statistics
  4. Global Market Analysis 2020 to 2024 and Forecast, 2025 to 2035
    • Historical Market Size Value (USD Million) & Volume (Tons) Analysis, 2020 to 2024
    • Current and Future Market Size Value (USD Million) & Volume (Tons) Projections, 2025 to 2035
      • Y-o-Y Growth Trend Analysis
      • Absolute $ Opportunity Analysis
  5. Global Market Pricing Analysis 2020 to 2024 and Forecast 2025 to 2035
  6. Global Market Analysis 2020 to 2024 and Forecast 2025 to 2035, By Source
    • Introduction/Key Findings
    • Historical Market Size Value (USD Million) & Volume (Tons) Analysis By Source, 2020 to 2024
    • Current and Future Market Size Value (USD Million) & Volume (Tons) Analysis and Forecast By Source, 2025 to 2035
      • Overripe Bananas
      • Reject/Discarded Bananas
      • Peel-Based Banana Flour
    • Y-o-Y Growth Trend Analysis By Source, 2020 to 2024
    • Absolute $ Opportunity Analysis By Source, 2025 to 2035
  7. Global Market Analysis 2020 to 2024 and Forecast 2025 to 2035, By Application
    • Introduction/Key Findings
    • Historical Market Size Value (USD Million) & Volume (Tons) Analysis By Application, 2020 to 2024
    • Current and Future Market Size Value (USD Million) & Volume (Tons) Analysis and Forecast By Application, 2025 to 2035
      • Bakery
        • Bread
        • Cakes
        • Muffins
        • Cookies
      • Snacks
        • Chips
        • Puffs
        • Bars
      • Breakfast Cereals & Granola
      • Baby Food
      • Dietary Supplements
      • Beverages
        • Smoothies
        • Shakes
      • Pet Food
      • Foodservice
    • Y-o-Y Growth Trend Analysis By Application, 2020 to 2024
    • Absolute $ Opportunity Analysis By Application, 2025 to 2035
  8. Global Market Analysis 2020 to 2024 and Forecast 2025 to 2035, By Functionality/Claim
    • Introduction/Key Findings
    • Historical Market Size Value (USD Million) & Volume (Tons) Analysis By Functionality/Claim, 2020 to 2024
    • Current and Future Market Size Value (USD Million) & Volume (Tons) Analysis and Forecast By Functionality/Claim, 2025 to 2035
      • Gluten-Free
      • High Fiber
      • Resistant Starch
      • Prebiotic
      • Low Glycemic Index
    • Y-o-Y Growth Trend Analysis By Functionality/Claim, 2020 to 2024
    • Absolute $ Opportunity Analysis By Functionality/Claim, 2025 to 2035
  9. Global Market Analysis 2020 to 2024 and Forecast 2025 to 2035, By End Use
    • Introduction/Key Findings
    • Historical Market Size Value (USD Million) & Volume (Tons) Analysis By End Use, 2020 to 2024
    • Current and Future Market Size Value (USD Million) & Volume (Tons) Analysis and Forecast By End Use, 2025 to 2035
      • Household/Retail
      • Industrial/Food Processing
      • Foodservice/HORECA
      • Nutraceuticals
    • Y-o-Y Growth Trend Analysis By End Use, 2020 to 2024
    • Absolute $ Opportunity Analysis By End Use, 2025 to 2035
  10. Global Market Analysis 2020 to 2024 and Forecast 2025 to 2035, By Sales Channel
    • Introduction/Key Findings
    • Historical Market Size Value (USD Million) & Volume (Tons) Analysis By Sales Channel, 2020 to 2024
    • Current and Future Market Size Value (USD Million) & Volume (Tons) Analysis and Forecast By Sales Channel, 2025 to 2035
      • Offline Retail
        • Supermarkets
        • Health Food Stores
      • Online Retail
        • Brand Websites
        • E-commerce Platforms
      • B2B
        • Bulk Ingredient Supply
    • Y-o-Y Growth Trend Analysis By Sales Channel, 2020 to 2024
    • Absolute $ Opportunity Analysis By Sales Channel, 2025 to 2035
  11. Global Market Analysis 2020 to 2024 and Forecast 2025 to 2035, By Form
    • Introduction/Key Findings
    • Historical Market Size Value (USD Million) & Volume (Tons) Analysis By Form, 2020 to 2024
    • Current and Future Market Size Value (USD Million) & Volume (Tons) Analysis and Forecast By Form, 2025 to 2035
      • Fine Powder
      • Coarse Flour
      • Blended
    • Y-o-Y Growth Trend Analysis By Form, 2020 to 2024
    • Absolute $ Opportunity Analysis By Form, 2025 to 2035
  12. Global Market Analysis 2020 to 2024 and Forecast 2025 to 2035, By Technology
    • Introduction/Key Findings
    • Historical Market Size Value (USD Million) & Volume (Tons) Analysis By Technology, 2020 to 2024
    • Current and Future Market Size Value (USD Million) & Volume (Tons) Analysis and Forecast By Technology, 2025 to 2035
      • Mechanical Dehydration & Milling
      • Solar Drying + Milling
      • Spray Drying
      • Vacuum Drying
      • Infrared or Microwave-Assisted Drying
      • Enzyme-Assisted Preprocessing
    • Y-o-Y Growth Trend Analysis By Technology, 2020 to 2024
    • Absolute $ Opportunity Analysis By Technology, 2025 to 2035
  13. Global Market Analysis 2020 to 2024 and Forecast 2025 to 2035, By Region
    • Introduction
    • Historical Market Size Value (USD Million) & Volume (Tons) Analysis By Region, 2020 to 2024
    • Current Market Size Value (USD Million) & Volume (Tons) Analysis and Forecast By Region, 2025 to 2035
      • North America
      • Latin America
      • Western Europe
      • Eastern Europe
      • East Asia
      • South Asia & Pacific
      • Middle East and Africa
    • Market Attractiveness Analysis By Region
  14. North America Market Analysis 2020 to 2024 and Forecast 2025 to 2035, By Country
    • Historical Market Size Value (USD Million) & Volume (Tons) Trend Analysis By Market Taxonomy, 2020 to 2024
    • Market Size Value (USD Million) & Volume (Tons) Forecast By Market Taxonomy, 2025 to 2035
      • By Country
        • USA
        • Canada
        • Mexico
      • By Source
      • By Application
      • By Functionality/Claim
      • By End Use
      • By Sales Channel
      • By Form
      • By Technology
    • Market Attractiveness Analysis
      • By Country
      • By Source
      • By Application
      • By Functionality/Claim
      • By End Use
      • By Sales Channel
      • By Form
      • By Technology
    • Key Takeaways
  15. Latin America Market Analysis 2020 to 2024 and Forecast 2025 to 2035, By Country
    • Historical Market Size Value (USD Million) & Volume (Tons) Trend Analysis By Market Taxonomy, 2020 to 2024
    • Market Size Value (USD Million) & Volume (Tons) Forecast By Market Taxonomy, 2025 to 2035
      • By Country
        • Brazil
        • Argentina
        • Rest of LATAM
      • By Source
      • By Application
      • By Functionality/Claim
      • By End Use
      • By Sales Channel
      • By Form
      • By Technology
    • Market Attractiveness Analysis
      • By Country
      • By Source
      • By Application
      • By Functionality/Claim
      • By End Use
      • By Sales Channel
      • By Form
      • By Technology
    • Key Takeaways
  16. Western Europe Market Analysis 2020 to 2024 and Forecast 2025 to 2035, By Country
    • Historical Market Size Value (USD Million) & Volume (Tons) Trend Analysis By Market Taxonomy, 2020 to 2024
    • Market Size Value (USD Million) & Volume (Tons) Forecast By Market Taxonomy, 2025 to 2035
      • By Country
        • Germany
        • Italy
        • France
        • UK
        • Spain
        • BENELUX
        • Nordic
        • Rest of W.Europe
      • By Source
      • By Application
      • By Functionality/Claim
      • By End Use
      • By Sales Channel
      • By Form
      • By Technology
    • Market Attractiveness Analysis
      • By Country
      • By Source
      • By Application
      • By Functionality/Claim
      • By End Use
      • By Sales Channel
      • By Form
      • By Technology
    • Key Takeaways
  17. Eastern Europe Market Analysis 2020 to 2024 and Forecast 2025 to 2035, By Country
    • Historical Market Size Value (USD Million) & Volume (Tons) Trend Analysis By Market Taxonomy, 2020 to 2024
    • Market Size Value (USD Million) & Volume (Tons) Forecast By Market Taxonomy, 2025 to 2035
      • By Country
        • Russia
        • Hungary
        • Poland
        • Balkan & Baltics
        • Rest of E. Europe
      • By Source
      • By Application
      • By Functionality/Claim
      • By End Use
      • By Sales Channel
      • By Form
      • By Technology
    • Market Attractiveness Analysis
      • By Country
      • By Source
      • By Application
      • By Functionality/Claim
      • By End Use
      • By Sales Channel
      • By Form
      • By Technology
    • Key Takeaways
  18. East Asia Market Analysis 2020 to 2024 and Forecast 2025 to 2035, By Country
    • Historical Market Size Value (USD Million) & Volume (Tons) Trend Analysis By Market Taxonomy, 2020 to 2024
    • Market Size Value (USD Million) & Volume (Tons) Forecast By Market Taxonomy, 2025 to 2035
      • By Country
        • China
        • Japan
        • South Korea
      • By Source
      • By Application
      • By Functionality/Claim
      • By End Use
      • By Sales Channel
      • By Form
      • By Technology
    • Market Attractiveness Analysis
      • By Country
      • By Source
      • By Application
      • By Functionality/Claim
      • By End Use
      • By Sales Channel
      • By Form
      • By Technology
    • Key Takeaways
  19. South Asia & Pacific Market Analysis 2020 to 2024 and Forecast 2025 to 2035, By Country
    • Historical Market Size Value (USD Million) & Volume (Tons) Trend Analysis By Market Taxonomy, 2020 to 2024
    • Market Size Value (USD Million) & Volume (Tons) Forecast By Market Taxonomy, 2025 to 2035
      • By Country
        • India
        • Australia & New Zealand
        • ASEAN
        • Rest of SAP
      • By Source
      • By Application
      • By Functionality/Claim
      • By End Use
      • By Sales Channel
      • By Form
      • By Technology
    • Market Attractiveness Analysis
      • By Country
      • By Source
      • By Application
      • By Functionality/Claim
      • By End Use
      • By Sales Channel
      • By Form
      • By Technology
    • Key Takeaways
  20. Middle East and Africa Market Analysis 2020 to 2024 and Forecast 2025 to 2035, By Country
    • Historical Market Size Value (USD Million) & Volume (Tons) Trend Analysis By Market Taxonomy, 2020 to 2024
    • Market Size Value (USD Million) & Volume (Tons) Forecast By Market Taxonomy, 2025 to 2035
      • By Country
        • GCC Countries
        • Northern Africa
        • South Africa
        • Turkiye
        • Rest of MEA
      • By Source
      • By Application
      • By Functionality/Claim
      • By End Use
      • By Sales Channel
      • By Form
      • By Technology
    • Market Attractiveness Analysis
      • By Country
      • By Source
      • By Application
      • By Functionality/Claim
      • By End Use
      • By Sales Channel
      • By Form
      • By Technology
    • Key Takeaways
  21. Key Countries Market Analysis
    • USA
      • Pricing Analysis
      • Market Share Analysis, 2024
        • By Source
        • By Application
        • By Functionality/Claim
        • By End Use
        • By Sales Channel
        • By Form
        • By Technology
    • Canada
      • Pricing Analysis
      • Market Share Analysis, 2024
        • By Source
        • By Application
        • By Functionality/Claim
        • By End Use
        • By Sales Channel
        • By Form
        • By Technology
    • Brazil
      • Pricing Analysis
      • Market Share Analysis, 2024
        • By Source
        • By Application
        • By Functionality/Claim
        • By End Use
        • By Sales Channel
        • By Form
        • By Technology
    • Mexico
      • Pricing Analysis
      • Market Share Analysis, 2024
        • By Source
        • By Application
        • By Functionality/Claim
        • By End Use
        • By Sales Channel
        • By Form
        • By Technology
    • Argentina
      • Pricing Analysis
      • Market Share Analysis, 2024
        • By Source
        • By Application
        • By Functionality/Claim
        • By End Use
        • By Sales Channel
        • By Form
        • By Technology
  22. Market Structure Analysis
    • Competition Dashboard
    • Competition Benchmarking
    • Market Share Analysis of Top Players
      • By Regional
      • By Source
      • By Application
      • By Functionality/Claim
      • By End Use
      • By Sales Channel
      • By Form
      • By Technology
  23. Competition Analysis
    • Competition Deep Dive
      • WEDO Gluten Free
        • Overview
        • Product Portfolio
        • Profitability by Market Segments (Product/Age /Sales Channel/Region)
        • Sales Footprint
        • Strategy Overview
          • Marketing Strategy
          • Product Strategy
          • Channel Strategy
      • BanFlour Co.
        • Overview
        • Product Portfolio
        • Profitability by Market Segments (Product/Age /Sales Channel/Region)
        • Sales Footprint
        • Strategy Overview
          • Marketing Strategy
          • Product Strategy
          • Channel Strategy
      • KADAC Australia (Natural Evolution)
        • Overview
        • Product Portfolio
        • Profitability by Market Segments (Product/Age /Sales Channel/Region)
        • Sales Footprint
        • Strategy Overview
          • Marketing Strategy
          • Product Strategy
          • Channel Strategy
      • Miski Organics
        • Overview
        • Product Portfolio
        • Profitability by Market Segments (Product/Age /Sales Channel/Region)
        • Sales Footprint
        • Strategy Overview
          • Marketing Strategy
          • Product Strategy
          • Channel Strategy
      • International Agriculture Group (NuBana™)
        • Overview
        • Product Portfolio
        • Profitability by Market Segments (Product/Age /Sales Channel/Region)
        • Sales Footprint
        • Strategy Overview
          • Marketing Strategy
          • Product Strategy
          • Channel Strategy
  24. Assumptions & Acronyms Used
  25. Research Methodology

List of Tables

  • Table 1: Global Market Value (USD Million) Forecast by Region, 2020-2035
  • Table 2: Global Market Volume (Tons) Forecast by Region, 2020-2035
  • Table 3: Global Market Value (USD Million) Forecast by Source, 2020-2035
  • Table 4: Global Market Volume (Tons) Forecast by Source, 2020-2035
  • Table 5: Global Market Value (USD Million) Forecast by Application, 2020-2035
  • Table 6: Global Market Volume (Tons) Forecast by Application, 2020-2035
  • Table 7: Global Market Value (USD Million) Forecast by Functionality/Claim, 2020-2035
  • Table 8: Global Market Volume (Tons) Forecast by Functionality/Claim, 2020-2035
  • Table 9: Global Market Value (USD Million) Forecast by End Use, 2020-2035
  • Table 10: Global Market Volume (Tons) Forecast by End Use, 2020-2035
  • Table 11: Global Market Value (USD Million) Forecast by Sales Channel, 2020-2035
  • Table 12: Global Market Volume (Tons) Forecast by Sales Channel, 2020-2035
  • Table 13: Global Market Value (USD Million) Forecast by Form, 2020-2035
  • Table 14: Global Market Volume (Tons) Forecast by Form, 2020-2035
  • Table 15: Global Market Value (USD Million) Forecast by Technology, 2020-2035
  • Table 16: Global Market Volume (Tons) Forecast by Technology, 2020-2035
  • Table 17: North America Market Value (USD Million) Forecast by Country, 2020-2035
  • Table 18: North America Market Volume (Tons) Forecast by Country, 2020-2035
  • Table 19: North America Market Value (USD Million) Forecast by Source, 2020-2035
  • Table 20: North America Market Volume (Tons) Forecast by Source, 2020-2035
  • Table 21: North America Market Value (USD Million) Forecast by Application, 2020-2035
  • Table 22: North America Market Volume (Tons) Forecast by Application, 2020-2035
  • Table 23: North America Market Value (USD Million) Forecast by Functionality/Claim, 2020-2035
  • Table 24: North America Market Volume (Tons) Forecast by Functionality/Claim, 2020-2035
  • Table 25: North America Market Value (USD Million) Forecast by End Use, 2020-2035
  • Table 26: North America Market Volume (Tons) Forecast by End Use, 2020-2035
  • Table 27: North America Market Value (USD Million) Forecast by Sales Channel, 2020-2035
  • Table 28: North America Market Volume (Tons) Forecast by Sales Channel, 2020-2035
  • Table 29: North America Market Value (USD Million) Forecast by Form, 2020-2035
  • Table 30: North America Market Volume (Tons) Forecast by Form, 2020-2035
  • Table 31: North America Market Value (USD Million) Forecast by Technology, 2020-2035
  • Table 32: North America Market Volume (Tons) Forecast by Technology, 2020-2035
  • Table 33: Latin America Market Value (USD Million) Forecast by Country, 2020-2035
  • Table 34: Latin America Market Volume (Tons) Forecast by Country, 2020-2035
  • Table 35: Latin America Market Value (USD Million) Forecast by Source, 2020-2035
  • Table 36: Latin America Market Volume (Tons) Forecast by Source, 2020-2035
  • Table 37: Latin America Market Value (USD Million) Forecast by Application, 2020-2035
  • Table 38: Latin America Market Volume (Tons) Forecast by Application, 2020-2035
  • Table 39: Latin America Market Value (USD Million) Forecast by Functionality/Claim, 2020-2035
  • Table 40: Latin America Market Volume (Tons) Forecast by Functionality/Claim, 2020-2035
  • Table 41: Latin America Market Value (USD Million) Forecast by End Use, 2020-2035
  • Table 42: Latin America Market Volume (Tons) Forecast by End Use, 2020-2035
  • Table 43: Latin America Market Value (USD Million) Forecast by Sales Channel, 2020-2035
  • Table 44: Latin America Market Volume (Tons) Forecast by Sales Channel, 2020-2035
  • Table 45: Latin America Market Value (USD Million) Forecast by Form, 2020-2035
  • Table 46: Latin America Market Volume (Tons) Forecast by Form, 2020-2035
  • Table 47: Latin America Market Value (USD Million) Forecast by Technology, 2020-2035
  • Table 48: Latin America Market Volume (Tons) Forecast by Technology, 2020-2035
  • Table 49: Western Europe Market Value (USD Million) Forecast by Country, 2020-2035
  • Table 50: Western Europe Market Volume (Tons) Forecast by Country, 2020-2035
  • Table 51: Western Europe Market Value (USD Million) Forecast by Source, 2020-2035
  • Table 52: Western Europe Market Volume (Tons) Forecast by Source, 2020-2035
  • Table 53: Western Europe Market Value (USD Million) Forecast by Application, 2020-2035
  • Table 54: Western Europe Market Volume (Tons) Forecast by Application, 2020-2035
  • Table 55: Western Europe Market Value (USD Million) Forecast by Functionality/Claim, 2020-2035
  • Table 56: Western Europe Market Volume (Tons) Forecast by Functionality/Claim, 2020-2035
  • Table 57: Western Europe Market Value (USD Million) Forecast by End Use, 2020-2035
  • Table 58: Western Europe Market Volume (Tons) Forecast by End Use, 2020-2035
  • Table 59: Western Europe Market Value (USD Million) Forecast by Sales Channel, 2020-2035
  • Table 60: Western Europe Market Volume (Tons) Forecast by Sales Channel, 2020-2035
  • Table 61: Western Europe Market Value (USD Million) Forecast by Form, 2020-2035
  • Table 62: Western Europe Market Volume (Tons) Forecast by Form, 2020-2035
  • Table 63: Western Europe Market Value (USD Million) Forecast by Technology, 2020-2035
  • Table 64: Western Europe Market Volume (Tons) Forecast by Technology, 2020-2035
  • Table 65: Eastern Europe Market Value (USD Million) Forecast by Country, 2020-2035
  • Table 66: Eastern Europe Market Volume (Tons) Forecast by Country, 2020-2035
  • Table 67: Eastern Europe Market Value (USD Million) Forecast by Source, 2020-2035
  • Table 68: Eastern Europe Market Volume (Tons) Forecast by Source, 2020-2035
  • Table 69: Eastern Europe Market Value (USD Million) Forecast by Application, 2020-2035
  • Table 70: Eastern Europe Market Volume (Tons) Forecast by Application, 2020-2035
  • Table 71: Eastern Europe Market Value (USD Million) Forecast by Functionality/Claim, 2020-2035
  • Table 72: Eastern Europe Market Volume (Tons) Forecast by Functionality/Claim, 2020-2035
  • Table 73: Eastern Europe Market Value (USD Million) Forecast by End Use, 2020-2035
  • Table 74: Eastern Europe Market Volume (Tons) Forecast by End Use, 2020-2035
  • Table 75: Eastern Europe Market Value (USD Million) Forecast by Sales Channel, 2020-2035
  • Table 76: Eastern Europe Market Volume (Tons) Forecast by Sales Channel, 2020-2035
  • Table 77: Eastern Europe Market Value (USD Million) Forecast by Form, 2020-2035
  • Table 78: Eastern Europe Market Volume (Tons) Forecast by Form, 2020-2035
  • Table 79: Eastern Europe Market Value (USD Million) Forecast by Technology, 2020-2035
  • Table 80: Eastern Europe Market Volume (Tons) Forecast by Technology, 2020-2035
  • Table 81: East Asia Market Value (USD Million) Forecast by Country, 2020-2035
  • Table 82: East Asia Market Volume (Tons) Forecast by Country, 2020-2035
  • Table 83: East Asia Market Value (USD Million) Forecast by Source, 2020-2035
  • Table 84: East Asia Market Volume (Tons) Forecast by Source, 2020-2035
  • Table 85: East Asia Market Value (USD Million) Forecast by Application, 2020-2035
  • Table 86: East Asia Market Volume (Tons) Forecast by Application, 2020-2035
  • Table 87: East Asia Market Value (USD Million) Forecast by Functionality/Claim, 2020-2035
  • Table 88: East Asia Market Volume (Tons) Forecast by Functionality/Claim, 2020-2035
  • Table 89: East Asia Market Value (USD Million) Forecast by End Use, 2020-2035
  • Table 90: East Asia Market Volume (Tons) Forecast by End Use, 2020-2035
  • Table 91: East Asia Market Value (USD Million) Forecast by Sales Channel, 2020-2035
  • Table 92: East Asia Market Volume (Tons) Forecast by Sales Channel, 2020-2035
  • Table 93: East Asia Market Value (USD Million) Forecast by Form, 2020-2035
  • Table 94: East Asia Market Volume (Tons) Forecast by Form, 2020-2035
  • Table 95: East Asia Market Value (USD Million) Forecast by Technology, 2020-2035
  • Table 96: East Asia Market Volume (Tons) Forecast by Technology, 2020-2035
  • Table 97: South Asia & Pacific Market Value (USD Million) Forecast by Country, 2020-2035
  • Table 98: South Asia & Pacific Market Volume (Tons) Forecast by Country, 2020-2035
  • Table 99: South Asia & Pacific Market Value (USD Million) Forecast by Source, 2020-2035
  • Table 100: South Asia & Pacific Market Volume (Tons) Forecast by Source, 2020-2035
  • Table 101: South Asia & Pacific Market Value (USD Million) Forecast by Application, 2020-2035
  • Table 102: South Asia & Pacific Market Volume (Tons) Forecast by Application, 2020-2035
  • Table 103: South Asia & Pacific Market Value (USD Million) Forecast by Functionality/Claim, 2020-2035
  • Table 104: South Asia & Pacific Market Volume (Tons) Forecast by Functionality/Claim, 2020-2035
  • Table 105: South Asia & Pacific Market Value (USD Million) Forecast by End Use, 2020-2035
  • Table 106: South Asia & Pacific Market Volume (Tons) Forecast by End Use, 2020-2035
  • Table 107: South Asia & Pacific Market Value (USD Million) Forecast by Sales Channel, 2020-2035
  • Table 108: South Asia & Pacific Market Volume (Tons) Forecast by Sales Channel, 2020-2035
  • Table 109: South Asia & Pacific Market Value (USD Million) Forecast by Form, 2020-2035
  • Table 110: South Asia & Pacific Market Volume (Tons) Forecast by Form, 2020-2035
  • Table 111: South Asia & Pacific Market Value (USD Million) Forecast by Technology, 2020-2035
  • Table 112: South Asia & Pacific Market Volume (Tons) Forecast by Technology, 2020-2035
  • Table 113: Middle East and Africa Market Value (USD Million) Forecast by Country, 2020-2035
  • Table 114: Middle East and Africa Market Volume (Tons) Forecast by Country, 2020-2035
  • Table 115: Middle East and Africa Market Value (USD Million) Forecast by Source, 2020-2035
  • Table 116: Middle East and Africa Market Volume (Tons) Forecast by Source, 2020-2035
  • Table 117: Middle East and Africa Market Value (USD Million) Forecast by Application, 2020-2035
  • Table 118: Middle East and Africa Market Volume (Tons) Forecast by Application, 2020-2035
  • Table 119: Middle East and Africa Market Value (USD Million) Forecast by Functionality/Claim, 2020-2035
  • Table 120: Middle East and Africa Market Volume (Tons) Forecast by Functionality/Claim, 2020-2035
  • Table 121: Middle East and Africa Market Value (USD Million) Forecast by End Use, 2020-2035
  • Table 122: Middle East and Africa Market Volume (Tons) Forecast by End Use, 2020-2035
  • Table 123: Middle East and Africa Market Value (USD Million) Forecast by Sales Channel, 2020-2035
  • Table 124: Middle East and Africa Market Volume (Tons) Forecast by Sales Channel, 2020-2035
  • Table 125: Middle East and Africa Market Value (USD Million) Forecast by Form, 2020-2035
  • Table 126: Middle East and Africa Market Volume (Tons) Forecast by Form, 2020-2035
  • Table 127: Middle East and Africa Market Value (USD Million) Forecast by Technology, 2020-2035
  • Table 128: Middle East and Africa Market Volume (Tons) Forecast by Technology, 2020-2035

List of Figures

  • Figure 1: Global Market Volume (Tons) Forecast 2020-2035
  • Figure 2: Global Market Pricing Analysis
  • Figure 3: Global Market Value (USD Million) Forecast 2020-2035
  • Figure 4: Global Market Value Share and BPS Analysis by Source, 2025 and 2035
  • Figure 5: Global Market Y-o-Y Growth Comparison by Source, 2025-2035
  • Figure 6: Global Market Attractiveness Analysis by Source
  • Figure 7: Global Market Value Share and BPS Analysis by Application, 2025 and 2035
  • Figure 8: Global Market Y-o-Y Growth Comparison by Application, 2025-2035
  • Figure 9: Global Market Attractiveness Analysis by Application
  • Figure 10: Global Market Value Share and BPS Analysis by Functionality/Claim, 2025 and 2035
  • Figure 11: Global Market Y-o-Y Growth Comparison by Functionality/Claim, 2025-2035
  • Figure 12: Global Market Attractiveness Analysis by Functionality/Claim
  • Figure 13: Global Market Value Share and BPS Analysis by End Use, 2025 and 2035
  • Figure 14: Global Market Y-o-Y Growth Comparison by End Use, 2025-2035
  • Figure 15: Global Market Attractiveness Analysis by End Use
  • Figure 16: Global Market Value Share and BPS Analysis by Sales Channel, 2025 and 2035
  • Figure 17: Global Market Y-o-Y Growth Comparison by Sales Channel, 2025-2035
  • Figure 18: Global Market Attractiveness Analysis by Sales Channel
  • Figure 19: Global Market Value Share and BPS Analysis by Form, 2025 and 2035
  • Figure 20: Global Market Y-o-Y Growth Comparison by Form, 2025-2035
  • Figure 21: Global Market Attractiveness Analysis by Form
  • Figure 22: Global Market Value Share and BPS Analysis by Technology, 2025 and 2035
  • Figure 23: Global Market Y-o-Y Growth Comparison by Technology, 2025-2035
  • Figure 24: Global Market Attractiveness Analysis by Technology
  • Figure 25: Global Market Value (USD Million) Share and BPS Analysis by Region, 2025 and 2035
  • Figure 26: Global Market Y-o-Y Growth Comparison by Region, 2025-2035
  • Figure 27: Global Market Attractiveness Analysis by Region
  • Figure 28: North America Market Incremental $ Opportunity, 2025-2035
  • Figure 29: Latin America Market Incremental $ Opportunity, 2025-2035
  • Figure 30: Western Europe Market Incremental $ Opportunity, 2025-2035
  • Figure 31: Eastern Europe Market Incremental $ Opportunity, 2025-2035
  • Figure 32: East Asia Market Incremental $ Opportunity, 2025-2035
  • Figure 33: South Asia & Pacific Market Incremental $ Opportunity, 2025-2035
  • Figure 34: Middle East and Africa Market Incremental $ Opportunity, 2025-2035
  • Figure 35: North America Market Value Share and BPS Analysis by Country, 2025 and 2035
  • Figure 36: North America Market Value Share and BPS Analysis by Source, 2025 and 2035
  • Figure 37: North America Market Y-o-Y Growth Comparison by Source, 2025-2035
  • Figure 38: North America Market Attractiveness Analysis by Source
  • Figure 39: North America Market Value Share and BPS Analysis by Application, 2025 and 2035
  • Figure 40: North America Market Y-o-Y Growth Comparison by Application, 2025-2035
  • Figure 41: North America Market Attractiveness Analysis by Application
  • Figure 42: North America Market Value Share and BPS Analysis by Functionality/Claim, 2025 and 2035
  • Figure 43: North America Market Y-o-Y Growth Comparison by Functionality/Claim, 2025-2035
  • Figure 44: North America Market Attractiveness Analysis by Functionality/Claim
  • Figure 45: North America Market Value Share and BPS Analysis by End Use, 2025 and 2035
  • Figure 46: North America Market Y-o-Y Growth Comparison by End Use, 2025-2035
  • Figure 47: North America Market Attractiveness Analysis by End Use
  • Figure 48: North America Market Value Share and BPS Analysis by Sales Channel, 2025 and 2035
  • Figure 49: North America Market Y-o-Y Growth Comparison by Sales Channel, 2025-2035
  • Figure 50: North America Market Attractiveness Analysis by Sales Channel
  • Figure 51: North America Market Value Share and BPS Analysis by Form, 2025 and 2035
  • Figure 52: North America Market Y-o-Y Growth Comparison by Form, 2025-2035
  • Figure 53: North America Market Attractiveness Analysis by Form
  • Figure 54: North America Market Value Share and BPS Analysis by Technology, 2025 and 2035
  • Figure 55: North America Market Y-o-Y Growth Comparison by Technology, 2025-2035
  • Figure 56: North America Market Attractiveness Analysis by Technology
  • Figure 57: Latin America Market Value Share and BPS Analysis by Country, 2025 and 2035
  • Figure 58: Latin America Market Value Share and BPS Analysis by Source, 2025 and 2035
  • Figure 59: Latin America Market Y-o-Y Growth Comparison by Source, 2025-2035
  • Figure 60: Latin America Market Attractiveness Analysis by Source
  • Figure 61: Latin America Market Value Share and BPS Analysis by Application, 2025 and 2035
  • Figure 62: Latin America Market Y-o-Y Growth Comparison by Application, 2025-2035
  • Figure 63: Latin America Market Attractiveness Analysis by Application
  • Figure 64: Latin America Market Value Share and BPS Analysis by Functionality/Claim, 2025 and 2035
  • Figure 65: Latin America Market Y-o-Y Growth Comparison by Functionality/Claim, 2025-2035
  • Figure 66: Latin America Market Attractiveness Analysis by Functionality/Claim
  • Figure 67: Latin America Market Value Share and BPS Analysis by End Use, 2025 and 2035
  • Figure 68: Latin America Market Y-o-Y Growth Comparison by End Use, 2025-2035
  • Figure 69: Latin America Market Attractiveness Analysis by End Use
  • Figure 70: Latin America Market Value Share and BPS Analysis by Sales Channel, 2025 and 2035
  • Figure 71: Latin America Market Y-o-Y Growth Comparison by Sales Channel, 2025-2035
  • Figure 72: Latin America Market Attractiveness Analysis by Sales Channel
  • Figure 73: Latin America Market Value Share and BPS Analysis by Form, 2025 and 2035
  • Figure 74: Latin America Market Y-o-Y Growth Comparison by Form, 2025-2035
  • Figure 75: Latin America Market Attractiveness Analysis by Form
  • Figure 76: Latin America Market Value Share and BPS Analysis by Technology, 2025 and 2035
  • Figure 77: Latin America Market Y-o-Y Growth Comparison by Technology, 2025-2035
  • Figure 78: Latin America Market Attractiveness Analysis by Technology
  • Figure 79: Western Europe Market Value Share and BPS Analysis by Country, 2025 and 2035
  • Figure 80: Western Europe Market Value Share and BPS Analysis by Source, 2025 and 2035
  • Figure 81: Western Europe Market Y-o-Y Growth Comparison by Source, 2025-2035
  • Figure 82: Western Europe Market Attractiveness Analysis by Source
  • Figure 83: Western Europe Market Value Share and BPS Analysis by Application, 2025 and 2035
  • Figure 84: Western Europe Market Y-o-Y Growth Comparison by Application, 2025-2035
  • Figure 85: Western Europe Market Attractiveness Analysis by Application
  • Figure 86: Western Europe Market Value Share and BPS Analysis by Functionality/Claim, 2025 and 2035
  • Figure 87: Western Europe Market Y-o-Y Growth Comparison by Functionality/Claim, 2025-2035
  • Figure 88: Western Europe Market Attractiveness Analysis by Functionality/Claim
  • Figure 89: Western Europe Market Value Share and BPS Analysis by End Use, 2025 and 2035
  • Figure 90: Western Europe Market Y-o-Y Growth Comparison by End Use, 2025-2035
  • Figure 91: Western Europe Market Attractiveness Analysis by End Use
  • Figure 92: Western Europe Market Value Share and BPS Analysis by Sales Channel, 2025 and 2035
  • Figure 93: Western Europe Market Y-o-Y Growth Comparison by Sales Channel, 2025-2035
  • Figure 94: Western Europe Market Attractiveness Analysis by Sales Channel
  • Figure 95: Western Europe Market Value Share and BPS Analysis by Form, 2025 and 2035
  • Figure 96: Western Europe Market Y-o-Y Growth Comparison by Form, 2025-2035
  • Figure 97: Western Europe Market Attractiveness Analysis by Form
  • Figure 98: Western Europe Market Value Share and BPS Analysis by Technology, 2025 and 2035
  • Figure 99: Western Europe Market Y-o-Y Growth Comparison by Technology, 2025-2035
  • Figure 100: Western Europe Market Attractiveness Analysis by Technology
  • Figure 101: Eastern Europe Market Value Share and BPS Analysis by Country, 2025 and 2035
  • Figure 102: Eastern Europe Market Value Share and BPS Analysis by Source, 2025 and 2035
  • Figure 103: Eastern Europe Market Y-o-Y Growth Comparison by Source, 2025-2035
  • Figure 104: Eastern Europe Market Attractiveness Analysis by Source
  • Figure 105: Eastern Europe Market Value Share and BPS Analysis by Application, 2025 and 2035
  • Figure 106: Eastern Europe Market Y-o-Y Growth Comparison by Application, 2025-2035
  • Figure 107: Eastern Europe Market Attractiveness Analysis by Application
  • Figure 108: Eastern Europe Market Value Share and BPS Analysis by Functionality/Claim, 2025 and 2035
  • Figure 109: Eastern Europe Market Y-o-Y Growth Comparison by Functionality/Claim, 2025-2035
  • Figure 110: Eastern Europe Market Attractiveness Analysis by Functionality/Claim
  • Figure 111: Eastern Europe Market Value Share and BPS Analysis by End Use, 2025 and 2035
  • Figure 112: Eastern Europe Market Y-o-Y Growth Comparison by End Use, 2025-2035
  • Figure 113: Eastern Europe Market Attractiveness Analysis by End Use
  • Figure 114: Eastern Europe Market Value Share and BPS Analysis by Sales Channel, 2025 and 2035
  • Figure 115: Eastern Europe Market Y-o-Y Growth Comparison by Sales Channel, 2025-2035
  • Figure 116: Eastern Europe Market Attractiveness Analysis by Sales Channel
  • Figure 117: Eastern Europe Market Value Share and BPS Analysis by Form, 2025 and 2035
  • Figure 118: Eastern Europe Market Y-o-Y Growth Comparison by Form, 2025-2035
  • Figure 119: Eastern Europe Market Attractiveness Analysis by Form
  • Figure 120: Eastern Europe Market Value Share and BPS Analysis by Technology, 2025 and 2035
  • Figure 121: Eastern Europe Market Y-o-Y Growth Comparison by Technology, 2025-2035
  • Figure 122: Eastern Europe Market Attractiveness Analysis by Technology
  • Figure 123: East Asia Market Value Share and BPS Analysis by Country, 2025 and 2035
  • Figure 124: East Asia Market Value Share and BPS Analysis by Source, 2025 and 2035
  • Figure 125: East Asia Market Y-o-Y Growth Comparison by Source, 2025-2035
  • Figure 126: East Asia Market Attractiveness Analysis by Source
  • Figure 127: East Asia Market Value Share and BPS Analysis by Application, 2025 and 2035
  • Figure 128: East Asia Market Y-o-Y Growth Comparison by Application, 2025-2035
  • Figure 129: East Asia Market Attractiveness Analysis by Application
  • Figure 130: East Asia Market Value Share and BPS Analysis by Functionality/Claim, 2025 and 2035
  • Figure 131: East Asia Market Y-o-Y Growth Comparison by Functionality/Claim, 2025-2035
  • Figure 132: East Asia Market Attractiveness Analysis by Functionality/Claim
  • Figure 133: East Asia Market Value Share and BPS Analysis by End Use, 2025 and 2035
  • Figure 134: East Asia Market Y-o-Y Growth Comparison by End Use, 2025-2035
  • Figure 135: East Asia Market Attractiveness Analysis by End Use
  • Figure 136: East Asia Market Value Share and BPS Analysis by Sales Channel, 2025 and 2035
  • Figure 137: East Asia Market Y-o-Y Growth Comparison by Sales Channel, 2025-2035
  • Figure 138: East Asia Market Attractiveness Analysis by Sales Channel
  • Figure 139: East Asia Market Value Share and BPS Analysis by Form, 2025 and 2035
  • Figure 140: East Asia Market Y-o-Y Growth Comparison by Form, 2025-2035
  • Figure 141: East Asia Market Attractiveness Analysis by Form
  • Figure 142: East Asia Market Value Share and BPS Analysis by Technology, 2025 and 2035
  • Figure 143: East Asia Market Y-o-Y Growth Comparison by Technology, 2025-2035
  • Figure 144: East Asia Market Attractiveness Analysis by Technology
  • Figure 145: South Asia & Pacific Market Value Share and BPS Analysis by Country, 2025 and 2035
  • Figure 146: South Asia & Pacific Market Value Share and BPS Analysis by Source, 2025 and 2035
  • Figure 147: South Asia & Pacific Market Y-o-Y Growth Comparison by Source, 2025-2035
  • Figure 148: South Asia & Pacific Market Attractiveness Analysis by Source
  • Figure 149: South Asia & Pacific Market Value Share and BPS Analysis by Application, 2025 and 2035
  • Figure 150: South Asia & Pacific Market Y-o-Y Growth Comparison by Application, 2025-2035
  • Figure 151: South Asia & Pacific Market Attractiveness Analysis by Application
  • Figure 152: South Asia & Pacific Market Value Share and BPS Analysis by Functionality/Claim, 2025 and 2035
  • Figure 153: South Asia & Pacific Market Y-o-Y Growth Comparison by Functionality/Claim, 2025-2035
  • Figure 154: South Asia & Pacific Market Attractiveness Analysis by Functionality/Claim
  • Figure 155: South Asia & Pacific Market Value Share and BPS Analysis by End Use, 2025 and 2035
  • Figure 156: South Asia & Pacific Market Y-o-Y Growth Comparison by End Use, 2025-2035
  • Figure 157: South Asia & Pacific Market Attractiveness Analysis by End Use
  • Figure 158: South Asia & Pacific Market Value Share and BPS Analysis by Sales Channel, 2025 and 2035
  • Figure 159: South Asia & Pacific Market Y-o-Y Growth Comparison by Sales Channel, 2025-2035
  • Figure 160: South Asia & Pacific Market Attractiveness Analysis by Sales Channel
  • Figure 161: South Asia & Pacific Market Value Share and BPS Analysis by Form, 2025 and 2035
  • Figure 162: South Asia & Pacific Market Y-o-Y Growth Comparison by Form, 2025-2035
  • Figure 163: South Asia & Pacific Market Attractiveness Analysis by Form
  • Figure 164: South Asia & Pacific Market Value Share and BPS Analysis by Technology, 2025 and 2035
  • Figure 165: South Asia & Pacific Market Y-o-Y Growth Comparison by Technology, 2025-2035
  • Figure 166: South Asia & Pacific Market Attractiveness Analysis by Technology
  • Figure 167: Middle East and Africa Market Value Share and BPS Analysis by Country, 2025 and 2035
  • Figure 168: Middle East and Africa Market Value Share and BPS Analysis by Source, 2025 and 2035
  • Figure 169: Middle East and Africa Market Y-o-Y Growth Comparison by Source, 2025-2035
  • Figure 170: Middle East and Africa Market Attractiveness Analysis by Source
  • Figure 171: Middle East and Africa Market Value Share and BPS Analysis by Application, 2025 and 2035
  • Figure 172: Middle East and Africa Market Y-o-Y Growth Comparison by Application, 2025-2035
  • Figure 173: Middle East and Africa Market Attractiveness Analysis by Application
  • Figure 174: Middle East and Africa Market Value Share and BPS Analysis by Functionality/Claim, 2025 and 2035
  • Figure 175: Middle East and Africa Market Y-o-Y Growth Comparison by Functionality/Claim, 2025-2035
  • Figure 176: Middle East and Africa Market Attractiveness Analysis by Functionality/Claim
  • Figure 177: Middle East and Africa Market Value Share and BPS Analysis by End Use, 2025 and 2035
  • Figure 178: Middle East and Africa Market Y-o-Y Growth Comparison by End Use, 2025-2035
  • Figure 179: Middle East and Africa Market Attractiveness Analysis by End Use
  • Figure 180: Middle East and Africa Market Value Share and BPS Analysis by Sales Channel, 2025 and 2035
  • Figure 181: Middle East and Africa Market Y-o-Y Growth Comparison by Sales Channel, 2025-2035
  • Figure 182: Middle East and Africa Market Attractiveness Analysis by Sales Channel
  • Figure 183: Middle East and Africa Market Value Share and BPS Analysis by Form, 2025 and 2035
  • Figure 184: Middle East and Africa Market Y-o-Y Growth Comparison by Form, 2025-2035
  • Figure 185: Middle East and Africa Market Attractiveness Analysis by Form
  • Figure 186: Middle East and Africa Market Value Share and BPS Analysis by Technology, 2025 and 2035
  • Figure 187: Middle East and Africa Market Y-o-Y Growth Comparison by Technology, 2025-2035
  • Figure 188: Middle East and Africa Market Attractiveness Analysis by Technology
  • Figure 189: Global Market - Tier Structure Analysis
  • Figure 190: Global Market - Company Share Analysis

Frequently Asked Questions

What is the projected size of the upcycled banana flour market in 2025?

The projected size of the industry in 2025 is USD 210.1 million.

What will be the value of the upcycled banana flour market in 2035 and its CAGR?

The value of the industry in 2035 is USD 306.1 million, with a CAGR of 3.8%.

Which form leads the upcycled banana flour market?

Fine powder leads the industry with a 48% industry share.

Which country is projected to have the highest CAGR in the upcycled banana flour market?

India is projected to have the highest CAGR in the industry with a growth rate of 3.9% from 2025 to 2035.

Who is the leading company in the upcycled banana flour market?

The leading company in the industry is WEDO Gluten Free, with an 8% industry share.

Explore Similar Insights

Future Market Insights

Upcycled Banana Flour Market