

- Market Size (2026)
- USD 268.7 Mn
- Forecast (2036)
- USD 513.9 Mn
- CAGR (2026 to 2036)
- 6.7%
Upcycled Cosmetic Ingredients Market Size, Market Forecast and Outlook By FMI
The upcycled cosmetic ingredients market was valued at USD 251.8 million in 2025. The market is set to reach USD 268.7 million by 2026-end and grow at a CAGR of 6.7% between 2026-2036 to reach USD 513.9 million by 2036. Active Ingredients will dominate with a 45.0% share, while Skin Care will lead with a 50.0% share.
Summary of the Upcycled Cosmetic Ingredients Market
- Demand and Growth Drivers
- Circular economy mandates and sustainability commitments by major beauty brands are creating structured procurement demand for ingredients derived from food and agricultural waste streams rather than virgin raw materials.
- Consumer demand for clean-label and sustainably sourced cosmetic products is accelerating brand adoption of upcycled ingredients, with eco-certification and traceability serving as purchase decision drivers.
- Biotechnological extraction advances including microbial and enzymatic fermentation are improving yield, purity, and functional performance of upcycled ingredients, narrowing the quality gap with conventional cosmetic raw materials.
- Product and Segment View
- Active Ingredients is likely to remain the leading product segment at 45% share, supported by established demand and procurement patterns.
- Skin Care is likely to account for 50% of the application segment, reflecting buyer preference and usage patterns.
- Cosmetic Manufacturers is likely to lead the end use segment at 65% share during the forecast period.
- Geography and Competitive Outlook
- China is likely to remain a key market at 9.05% CAGR, supported by strong demand fundamentals and expanding adoption.
- India is likely to sustain growth at 8.38% CAGR owing to rising spending and expanding infrastructure.
- Companies with broad product portfolios and multi-channel distribution are likely to gain traction during the forecast period.
- Analyst Opinion
- The upcycled cosmetic ingredients market is evolving into a more defined commercial category with clear segment leaders and established distribution patterns.
- Adoption is increasing due to rising awareness, expanding distribution infrastructure, and growing influence of specialized channels on procurement behavior.
- Demand is further supported by premiumization trends, where buyers trade up to higher-quality products with functional differentiation.
- Companies that can improve cost competitiveness while delivering consistent quality across key segments are likely to strengthen their position over the forecast period.
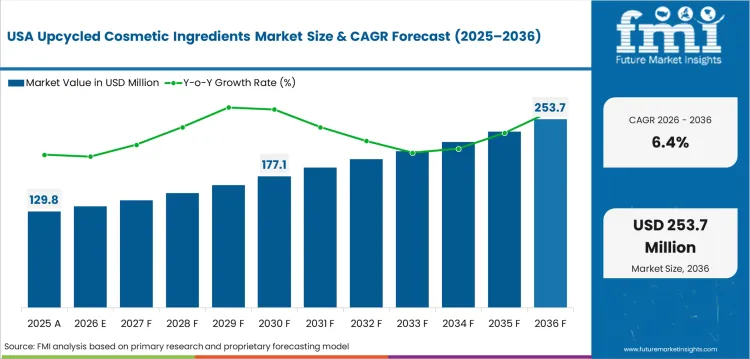
Key Takeaways, Market Size, and Forecast
- The upcycled cosmetic ingredients market was valued at USD 251.8 million in 2025.
- By 2036, the Upcycled Cosmetic Ingredients Market is expected to be worth USD 513.9 million.
- From 2026 to 2036, the market is projected to expand at a CAGR of 6.7%.
- The market is projected to create an incremental opportunity of USD 245.21 million between 2026 and 2036.
- In 2026, active ingredients is expected to account for 45% of the product segment, driven by demand for botanical extracts, antioxidants, and functional actives derived from food industry by-products for anti-aging and skincare formulations.
- China (9.05%) and India (8.38%) are two of the fastest growing markets in the world.
Upcycled Cosmetic Ingredients Market Definition
The upcycled cosmetic ingredients market encompasses commercially traded cosmetic raw materials derived from the repurposing of food, agricultural, and marine industry by-products. Product categories include active ingredients, emollients and oils, colorants, and surfactants sourced from plant-based waste, agricultural waste, animal-based waste, and marine waste processed through biotechnological, mechanical, and enzyme-assisted extraction technologies.
Upcycled Cosmetic Ingredients Market Inclusions
Market scope covers all commercially traded upcycled cosmetic ingredients categorized by product (active ingredients, emollients and oils, colorants, surfactants), application (skin care, hair care, color cosmetics, personal care), end use (cosmetic manufacturers, personal care brands), distribution channel (direct sales, distributors, online platforms), source (plant-based waste, agricultural waste, animal-based waste, marine waste), processing technology (biotechnological processing, enzyme-assisted extraction, mechanical processing), and pricing tier (premium, mid range, economy). The revenue range spans from 2026 to 2036.
Upcycled Cosmetic Ingredients Market Exclusions
The scope does not include virgin raw materials not derived from waste or by-product streams, synthetic cosmetic ingredients, or upcycled materials used exclusively in non-cosmetic industrial applications.
Upcycled Cosmetic Ingredients Market Research Methodology
- Primary Research: To gain insights into the market, FMI analysts interviewed cosmetic ingredient manufacturers, sustainability officers at beauty companies, raw material procurement managers, and certification bodies across key markets.
- Desk Research: Aggregated data from cosmetic ingredient associations, sustainability certification databases and manufacturer production reports.
- Market sizing and forecasting: bottom-up aggregation by ingredient categories and application segments, with regional adoption curves adjusted for sustainability regulation and clean beauty market penetration.
- data validation: quarterly checks against cosmetic ingredient trade data and manufacturer revenue disclosures.
Why is the Upcycled Cosmetic Ingredients Market Growing?
- Circular economy mandates and sustainability commitments from major beauty brands are driving demand for structured procurement of ingredients from food and agricultural waste streams instead of virgin raw materials.
- Brands are increasingly using upcycled ingredients, driven by consumer demand for clean-label and sustainably sourced cosmetic products, with eco-certification and traceability being purchase decision drivers.
- Advances in biotechnological extraction using microbial and enzymatic fermentation are increasing yield and purity.
The use of circular economy principles is changing the cosmetic supply chain and helping the upcycled cosmetic ingredients market grow. Botanical extracts, antioxidants and anti-aging actives derived from fruit, vegetable and seed processing by-products are leading at 45.0% of the product segment with active ingredients. The source segment is mainly composed of plant-based waste representing 70.0%. The main feedstocks are by-products of the food industry such as fruit peels, seed residues and plant biomass.
The demand for skin care applications is 50.0% and the major end-use categories are anti-aging products, moisturizers and cleansers. End-user demand is dominated by cosmetic manufacturers (65.0%) with large-scale brands, contract manufacturers and indie brands sourcing upcycled ingredients via direct supply agreements. Cosmetic ingredients are mainly sourced from B2B sources. Direct sales channels constitute 60.0% of distribution.
Market Segmentation Analysis
- The product segment consists of 45% Active Ingredients, consistent with established demand patterns.
- Cosmetic manufacturers to lead the end use segment with 65% share.
Upcycled Cosmetic Ingredients Market Segmentation: By Product By Application By End Use By Distribution Channel By Source By Processing Technology By Pricing Tier
Insights into the Active Ingredients Product Segment
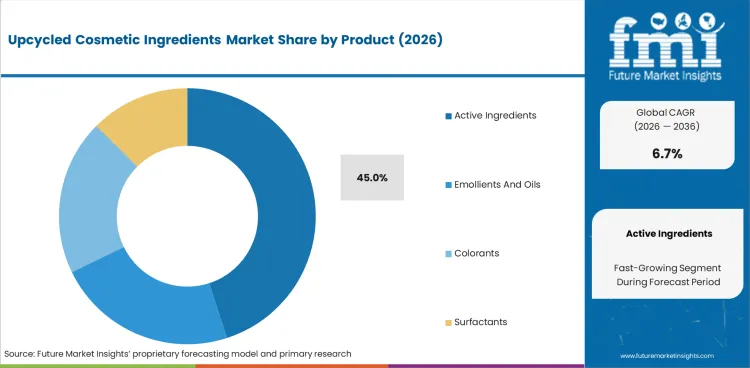
The active ingredients segment is expected to represent 45.0% of the product segment in 2026. Botanical extracts (fruit-derived and vegetable-derived actives) are used in anti-aging, and hydration applications. Functional actives such as antioxidants and anti-aging ingredients are priced at a premium due to clinical validation requirements. Biotechnological processing accounts for 55.0% of the extraction technology. Enzymatic fermentation increases the bioactive yield and purity.
Insights into the Skin Care Application Segment
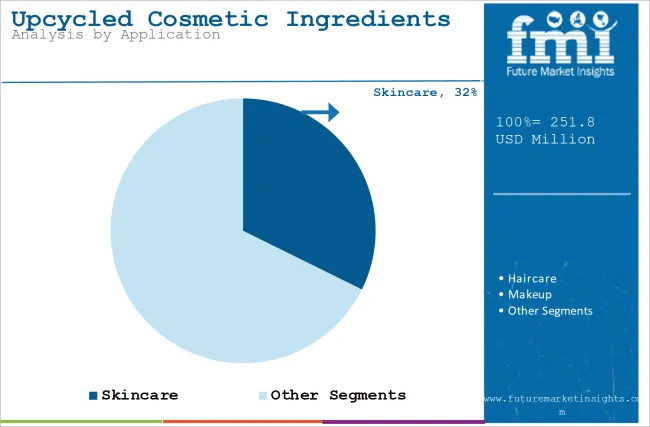
By application segment, the market is divided into Skin care. Anti-aging products, such as wrinkle care and firming formulations, make the most use of upcycled active ingredients. Brands reformulating with sustainable inputs find growing application areas in moisturizers and cleansers. Hair care and color cosmetics are emerging application categories as ingredient manufacturers create upcycled alternatives for shampoos, conditioners and pigment sources.
Upcycled Cosmetic Ingredients Market Drivers, Restraints, and Opportunities
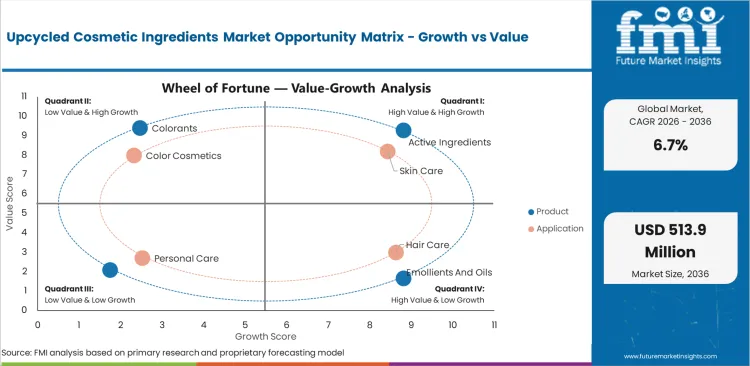
- Circular Economy Mandates are creating structured demand across key segments.
- Ingredient cost and scale are limiting the adoption velocity in price sensitive segments.
Demand-side drivers and supply-side constraints affecting upcycled cosmetic ingredients vary across regions and price tiers.
Circular Economy Mandates and Brand Sustainability
Key beauty brands are driving demand as they push for upcycled and circular ingredient sourcing by 2030, meeting corporate sustainability commitments. Extended Producer Responsibility frameworks and EUs circular economy regulations are shaping compliance-driven procurement requirements.
Clean Beauty Consumer Demand and Eco-Certification
Consumer demand for sustainable cosmetic products with transparent supply chains is fueling growth. Products are differentiated and premium pricing supported in retail channels by eco-certifications like COSMOS, Ecocert and Upcycled Certified.
Ingredient Cost and Scale Limitations
Higher extraction and processing costs than conventional cosmetic raw materials limit adoption. Manufacturers who want standard ingredient inputs have difficulty getting consistent supplies because of the small scale of processing and the variation in feedstock.
Biotechnology Extraction Innovation
Advances in enzymatic and microbial fermentation increase the yield, purity and functional performance of upcycled ingredients, driving growth. These technologies are closing the gap in quality with virgin raw materials and broadening the spectrum of cosmetic applications.
Analysis of Upcycled Cosmetic Ingredients Market By Key Countries
.webp "Top Country Growth Comparison Upcycled Cosmetic Ingredients Market Cagr (2026 2036)")
| Country | CAGR |
|---|---|
| China | 9.05% |
| India | 8.38% |
| Germany | 7.71% |
| Brazil | 7.04% |
| USA | 6.37% |
| UK | 5.7% |
| Japan | 5.03% |
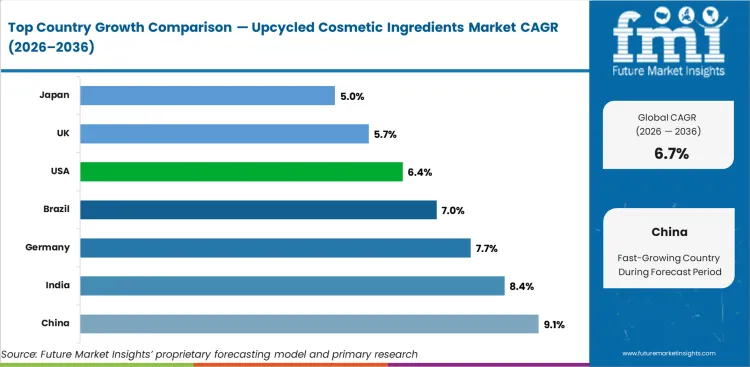
- China tops with 9.05% CAGR, driven by the largest demand base and increasing adoption.
- India at 8.38% has strong demand backed by increased spending and distribution rollout.
- Market development is increasing, with Germany (7.71%) and Brazil (7.04%) still growing.
The global upcycled cosmetic ingredients market is projected to expand at 6.7% per year from 2026 to 2036. The study covers more than 30 countries.
Sales Analysis of Upcycled Cosmetic Ingredients Market in China
China is the leader at 9.05% through 2036. China’s food processing industry is large, and it provides a large by-product feedstock for the production of upcycled ingredients. Sustainable inputs from domestic beauty brands and government support for circular economy policy are creating procurement pipelines.
- Scale of food processing industry provides abundant by-product feedstock for ingredient extraction.
- Domestic beauty brand growth generates structured demand for sustainably sourced cosmetic ingredients.
- Government circular economy policies are supportive of investment in waste-to-value processing technology.
Demand Outlook for Upcycled Cosmetic Ingredients Market in India
India to grow at 8.38% through 2036. India has a large farming sector and this means there is an availability of agricultural by-products that can be used as feedstock for upcycled ingredient production. The heritage of Ayurvedic ingredients and the growth of domestic cosmetics manufacturing support the adoption of organic and naturally derived ingredients.
- The large farming sector provides for diverse feedstock sources with availability of agricultural by-products.
- Increased capacity for domestic cosmetics manufacturing increases demand for sustainably sourced ingredients.
- Ayurvedic ingredient legacy meets acceptance of plant derived cosmetic inputs by consumers.
In-depth Analysis of Upcycled Cosmetic Ingredients Market in Germany
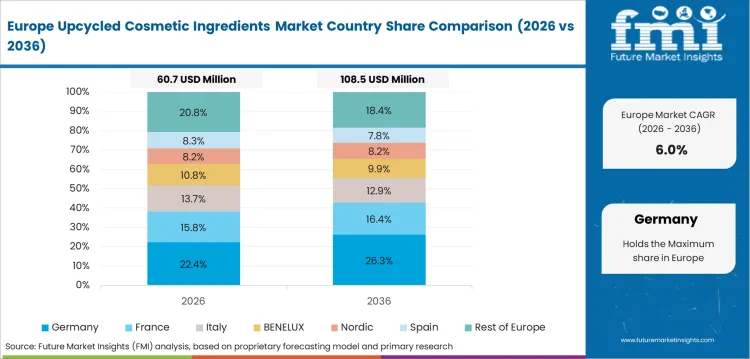
Germany will grow by 7.71% through 2036. Structured market driven by EU regulations on the circular economy and high demand for natural cosmetics. German ingredient makers like BASF and Symrise are investing in upcycled ingredient processing capabilities.
- EU circular economy and Extended Producer Responsibility regulations will support sustainable ingredient sourcing.
- The demand for natural cosmetics is high and this supports the premium pricing of certified upcycled ingredients.
- German ingredient manufacturers invest in biotechnological upcycling capacity.
Opportunity Analysis of Upcycled Cosmetic Ingredients Market in Brazil
Brazil will grow 7.04% until 2036. Brazil’s tropical agriculture and biodiversity produce large streams of by-products that are good sources of cosmetic ingredients. Natura and Co and local brands are the main drivers of the adoption of sustainably sourced ingredients.
- Tropical agriculture and biodiversity are unique sources of by-products to extract ingredients for cosmetics.
- The dedication to sustainable sourcing of Natura and Co sets the bar for the Brazilian procurement market.
- The export potential of Brazilian-origin upcycled ingredients boosts domestic processing investment.
Future Outlook for Upcycled Cosmetic Ingredients Market in the United States
The USA is at 6.37% growth through 2036. Clean beauty consumer demand and sustainability commitments from major brands are driving ingredient procurement shifts. That's the premise behind the Upcycled Certified standard: to provide a recognized framework for ingredient verification.
- Consumer demand for clean beauty is pushing brands to source cosmetic ingredients more sustainably.
- The Upcycled Certified standard offers a recognized verification framework for ingredient claims.
- Big beauty brands are going for circular and upcycled ingredient sourcing by 2030.
In-depth Analysis of Upcycled Cosmetic Ingredients Market in the United Kingdom
The UK is growing by 5.7% until 2036. The market is driven by post-Brexit regulatory alignment with EU cosmetics standards and a high level of consumer awareness of sustainability. UK beauty brands are very focused on traceability and ethical sourcing of ingredients.
- Post-Brexit regulatory standards are in line with EU cosmetics ingredient standards.
- Consumer demand for ethically sourced cosmetic ingredients is being driven by sustainability awareness.
- UK beauty brands are prioritising ingredient traceability and supply chain transparency.
Demand Outlook for Upcycled Cosmetic Ingredients Market in Japan
Japan is forecast to grow by 5.03% through 2036. Cosmetics makers in Japan are concerned about ingredient quality and functionality. Unique by-product sources are provided by cosmetic peptides and actives from Japan’s fishing industry marine waste processing.
- Standards on ingredient quality and functional performance rule the use of upcycled ingredients.
- Unique cosmetic ingredient feedstock from processing marine waste from the fishing industry.
- Japanese cosmetic makers are adding upcycled ingredients to their premium product lines.
Competitive Landscape and Strategic Positioning
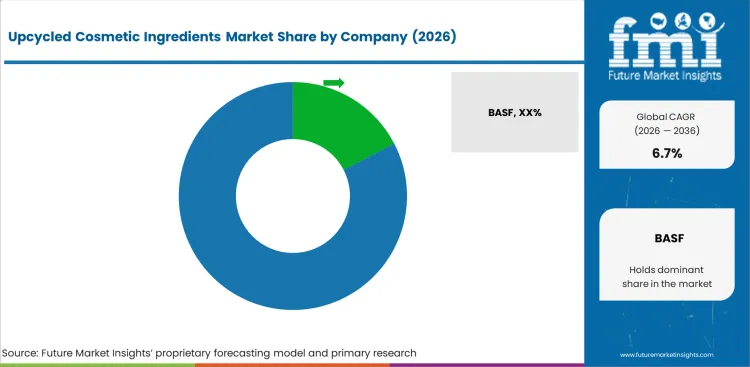
- BASF has a 17.4% market share and is a market leader with integrated chemical and ingredient manufacturing capabilities, global distribution, and investments in green chemistry platforms that support the production of upcycled cosmetic ingredients.
- Givaudan and Symrise compete on expertise in cosmetic ingredient innovation, sustainability certification capabilities and existing relationships with global beauty brand procurement teams.
- The mid-market is served by Croda International, Clariant and Firmenich, with niche ingredient portfolios, enzyme-assisted extraction technology and co-development partnerships with beauty brands.
The competition is defined by global players with a broad portfolio and regional players with niche capabilities.
Key Companies in the Upcycled Cosmetic Ingredients Market
Key global companies leading the upcycled cosmetic ingredients market include:
- BASF (Germany), Givaudan (Switzerland), Symrise (Germany) and Croda International (UK) are leading the way with global ingredient distribution, investment in biotechnological processing and established beauty brand procurement relationships.
- For the specialty ingredient segment, Clariant (Switzerland), Firmenich (Switzerland) and Seppic (France) provide formulation know-how, sustainability certification capabilities and co-development partnerships.
- Akott Evolution (Italy), IFF (USA) and L’Oreal (France) are growing through proprietary upcycled ingredient development, internal brand integration and sustainable sourcing commitments.
Competitive Benchmarking: Upcycled Cosmetic Ingredients Market
| Company | Extraction Tech | Sustainability Cert | Distribution | Market Reach |
|---|---|---|---|---|
| BASF | Very High | High | Global | Very Strong |
| Givaudan | High | Very High | Global | Strong |
| Symrise | High | Very High | Global | Strong |
| Croda International | High | High | Global | Strong |
| Clariant | Medium | High | Global | Moderate |
| Firmenich | Medium | High | Global | Moderate |
| Seppic | Medium | Medium | Europe | Moderate |
| Akott Evolution | Medium | Medium | Europe | Moderate |
| IFF | High | Medium | Global | Strong |
| L'Oreal | Medium | High | Global | Strong |
Source: Future Market Insights competitive analysis, 2026.
Key Developments in Upcycled Cosmetic Ingredients Market
- In 2025, BASF expanded its sustainable care portfolio by introducing advanced cosmetic active ingredients derived from upcycled agricultural by-products, including citrus-based sources rich in natural antioxidants and bioflavonoids, supporting anti-aging and skin protection applications in clean-label skincare formulations.
- In 2025, Givaudan, through its Active Beauty division, expanded its sustainable ingredient portfolio with the Softolive™ range, a plant-based emollient derived from olive oil side-streams and designed as a biodegradable alternative to synthetic silicones for use in clean-beauty skincare and cosmetic formulations.
Key Players in the Upcycled Cosmetic Ingredients Market
Major Global Players
- BASF
- Givaudan
- Symrise
- Croda International
- Clariant
- Firmenich
Emerging Players/Startups
- Seppic
- Akott Evolution
- IFF
- L'Oreal
- UpCircle Beauty
- Circumfauna
Report Scope and Coverage
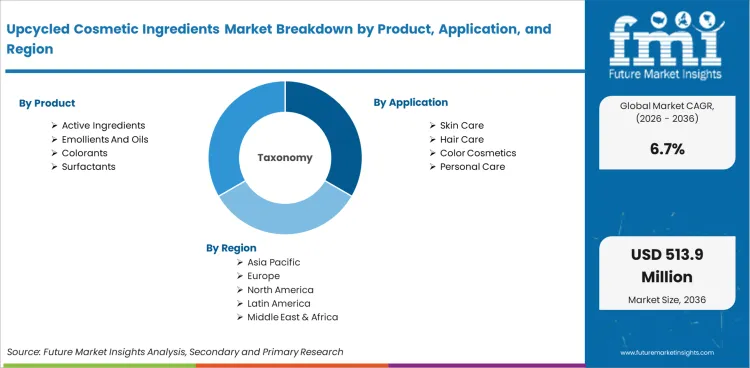
| Parameter | Details |
|---|---|
| Quantitative Units | USD 268.7 million to USD 513.9 million, at a CAGR of 6.7% |
| Market Definition | The upcycled cosmetic ingredients market encompasses commercially traded cosmetic raw materials derived from the repurposing of food, agricultural, and marine industry by-products. Product categories include active ingredients, emollients and oils, colorants, and surfactants sourced from plant-based waste, agricultural waste, animal-based waste, and marine waste processed through biotechnological, mechanical, and enzyme-assisted extraction technologies. |
| Regions Covered | North America, Latin America, Europe, East Asia, South Asia and Pacific, Middle East and Africa |
| Countries Covered | China, India, Germany, Brazil, USA, UK, Japan, 30 plus countries |
| Key Companies Profiled | BASF, Givaudan, Symrise, Croda International, Clariant, Firmenich, Seppic, Akott Evolution, IFF |
| Forecast Period | 2026 to 2036 |
| Approach | Hybrid bottom-up and top-down methodology starting with verified transaction data, projecting adoption velocity across segments and regions. |
Market Segmentation Analysis
Upcycled Cosmetic Ingredients Market Segmented by Product:
- Active Ingredients
- Botanical Extracts
- Fruit Derived Extracts
- Vegetable Derived Extracts
- Functional Actives
- Antioxidants
- Anti Aging Actives
- Botanical Extracts
- Emollients And Oils
- Plant Based Oils
- Seed Oils
- Fruit Peel Oils
- Butter And Lipids
- Natural Butters
- Fatty Acid Blends
- Plant Based Oils
- Colorants
- Natural Pigments
- Plant Pigments
- Mineral Pigments
- Bio Colorants
- Fermented Colorants
- Algae Derived Pigments
- Natural Pigments
- Surfactants
- Bio Based Surfactants
- Mild Cleansing Agents
- Foaming Agents
- Bio Based Surfactants
Upcycled Cosmetic Ingredients Market Segmented by Application:
- Skin Care
- Anti Aging Products
- Wrinkle Care
- Firming Products
- Moisturizers
- Hydration Creams
- Lotions
- Cleansers
- Face Wash
- Exfoliating Cleansers
- Anti Aging Products
- Hair Care
- Shampoos
- Scalp Care
- Damage Repair
- Conditioners
- Hydration Conditioners
- Repair Conditioners
- Shampoos
- Color Cosmetics
- Face Makeup
- Foundation
- Blush
- Eye Makeup
- Eyeshadow
- Mascara
- Face Makeup
- Personal Care
- Body Care
- Body Lotions
- Body Wash
- Oral Care
- Toothpaste
- Mouthwash
- Body Care
Upcycled Cosmetic Ingredients Market Segmented by End Use:
- Cosmetic Manufacturers
- Large Scale Manufacturers
- Global Brands
- Contract Manufacturers
- Small And Medium Enterprises
- Indie Brands
- Niche Product Manufacturers
- Large Scale Manufacturers
- Personal Care Brands
- Premium Brands
- Luxury Skincare Brands
- Clean Beauty Brands
- Mass Market Brands
- Retail Brands
- Private Label Brands
- Premium Brands
Upcycled Cosmetic Ingredients Market Segmented by Distribution Channel:
- Direct Sales
- Ingredient Suppliers To Manufacturers
- Bulk Supply Agreements
- Long Term Contracts
- Partnership Models
- Co Development Agreements
- Sustainability Partnerships
- Ingredient Suppliers To Manufacturers
- Distributors
- Specialty Chemical Distributors
- Regional Distributors
- Global Distributors
- Online Platforms
- Digital B2B Platforms
- Ingredient Marketplaces
- Specialty Chemical Distributors
Upcycled Cosmetic Ingredients Market Segmented by Source:
- Plant Based Waste
- Food Industry By Products
- Fruit Peels
- Seed Residues
- Agricultural Waste
- Crop Residue
- Plant Biomass
- Food Industry By Products
- Animal Based Waste
- Dairy By Products
- Milk Residues
- Fat Derivatives
- Marine Waste
- Fish By Products
- Algae Residues
- Dairy By Products
Upcycled Cosmetic Ingredients Market Segmented by Processing Technology:
- Biotechnological Processing
- Fermentation
- Microbial Fermentation
- Enzymatic Fermentation
- Enzyme Assisted Extraction
- Green Extraction Methods
- Low Temperature Processing
- Fermentation
- Mechanical Processing
- Cold Pressing
- Oil Extraction
- Juice Residue Processing
- Physical Separation
- Filtration
- Distillation
- Cold Pressing
Upcycled Cosmetic Ingredients Market Segmented by Pricing Tier:
- Premium
- Sustainable Certified Ingredients
- Organic Certified
- Eco Label Certified
- Sustainable Certified Ingredients
- Mid Range
- Standard Upcycled Ingredients
- Commercial Grade Ingredients
- Standard Upcycled Ingredients
- Economy
- Low Cost Ingredients
- Bulk Industrial Supply
- Low Cost Ingredients
Upcycled Cosmetic Ingredients Market by Region:
- North America
- USA
- Canada
- Mexico
- Latin America
- Brazil
- Chile
- Rest of Latin America
- Western Europe
- Germany
- UK
- Italy
- Spain
- France
- Nordic
- BENELUX
- Rest of Western Europe
- Eastern Europe
- Russia
- Poland
- Hungary
- Balkan & Baltic
- Rest of Eastern Europe
- East Asia
- China
- Japan
- South Korea
- South Asia and Pacific
- India
- ASEAN
- Australia & New Zealand
- Rest of South Asia and Pacific
- Middle East & Africa
- Kingdom of Saudi Arabia
- Other GCC Countries
- Turkiye
- South Africa
- Other African Union
- Rest of Middle East & Africa
Research Sources and Bibliography
- 1. European Commission. (2024). EU Circular Economy Action Plan: Cosmetics and Personal Care. EC.
- 2. Cosmetics Europe. (2025). Annual Report: Sustainable Ingredients in European Cosmetics. Cosmetics Europe.
- 3. United Nations Environment Programme. (2024). UNEP Circular Economy in the Beauty Industry. UNEP.
- 4. USA Environmental Protection Agency. (2024). EPA Guidance on Food Waste Valorization. EPA.
- 5. International Organization for Standardization. (2025). ISO Standards for Upcycled and Circular Materials. ISO.
This bibliography is provided for reader reference.
This Report Answers
- Estimating the market size and revenue generation from 2026 to 2036.
- Segmenting by product, application, end use, distribution channel, source, processing technology, and pricing tier.
- Providing regional insights across more than 30 markets.
- Analyzing circular economy impact on cosmetic ingredient sourcing.
- Assessing the competitive landscape across ingredient manufacturers.
- Identifying investment opportunities in biotechnological extraction and upcycled actives.
- Tracking sustainability certification and regulatory trends.
- Delivering data in PDF and Excel formats.
Frequently Asked Questions
How big is the upcycled cosmetic ingredients market in 2026?
The global upcycled cosmetic ingredients market is estimated to be valued at USD 268.7 million in 2026.
What will be the size of upcycled cosmetic ingredients market in 2036?
The market size for the upcycled cosmetic ingredients market is projected to reach USD 513.9 million by 2036.
How much will be the upcycled cosmetic ingredients market growth between 2026 and 2036?
The upcycled cosmetic ingredients market is expected to grow at a 6.7% CAGR between 2026 and 2036.
What are the key product types in the upcycled cosmetic ingredients market?
The key product types in upcycled cosmetic ingredients market are active ingredients, emollients and oils, colorants and surfactants.
Which application segment is expected to contribute significant share in the upcycled cosmetic ingredients market in 2026?
In terms of application, skin care segment is expected to command 50.0% share in the upcycled cosmetic ingredients market in 2026.
Preview the report firsthand - request a free sample
Get SampleGet the brochure for pricing and purchase details.
Get PDFTable of Content
- Executive Summary
- Global Market Outlook
- Demand-side Trends
- Supply-side Trends
- Technology Roadmap Analysis
- Analysis and Recommendations
- Market Overview
- Market Coverage / Taxonomy
- Market Definition / Scope / Limitations
- Research Methodology
- Chapter Orientation
- Analytical Lens and Working Hypotheses
- Market Structure, Signals, and Trend Drivers
- Benchmarking and Cross-market Comparability
- Market Sizing, Forecasting, and Opportunity Mapping
- Research Design and Evidence Framework
- Desk Research Programme (Secondary Evidence)
- Company Annual and Sustainability Reports
- Peer-reviewed Journals and Academic Literature
- Corporate Websites, Product Literature, and Technical Notes
- Earnings Decks and Investor Briefings
- Statutory Filings and Regulatory Disclosures
- Technical White Papers and Standards Notes
- Trade Journals, Industry Magazines, and Analyst Briefs
- Conference Proceedings, Webinars, and Seminar Materials
- Government Statistics Portals and Public Data Releases
- Press Releases and Reputable Media Coverage
- Specialist Newsletters and Curated Briefings
- Sector Databases and Reference Repositories
- FMI Internal Proprietary Databases and Historical Market Datasets
- Subscription Datasets and Paid Sources
- Social Channels, Communities, and Digital Listening Inputs
- Additional Desk Sources
- Expert Input and Fieldwork (Primary Evidence)
- Primary Modes
- Qualitative Interviews and Expert Elicitation
- Quantitative Surveys and Structured Data Capture
- Blended Approach
- Why Primary Evidence is Used
- Field Techniques
- Interviews
- Surveys
- Focus Groups
- Observational and In-context Research
- Social and Community Interactions
- Stakeholder Universe Engaged
- C-suite Leaders
- Board Members
- Presidents and Vice Presidents
- R&D and Innovation Heads
- Technical Specialists
- Domain Subject-matter Experts
- Scientists
- Physicians and Other Healthcare Professionals
- Governance, Ethics, and Data Stewardship
- Research Ethics
- Data Integrity and Handling
- Primary Modes
- Tooling, Models, and Reference Databases
- Desk Research Programme (Secondary Evidence)
- Data Engineering and Model Build
- Data Acquisition and Ingestion
- Cleaning, Normalisation, and Verification
- Synthesis, Triangulation, and Analysis
- Quality Assurance and Audit Trail
- Market Background
- Market Dynamics
- Drivers
- Restraints
- Opportunity
- Trends
- Scenario Forecast
- Demand in Optimistic Scenario
- Demand in Likely Scenario
- Demand in Conservative Scenario
- Opportunity Map Analysis
- Product Life Cycle Analysis
- Supply Chain Analysis
- Investment Feasibility Matrix
- Value Chain Analysis
- PESTLE and Porter’s Analysis
- Regulatory Landscape
- Regional Parent Market Outlook
- Production and Consumption Statistics
- Import and Export Statistics
- Market Dynamics
- Global Market Analysis 2021 to 2025 and Forecast, 2026 to 2036
- Historical Market Size Value (USD Million) Analysis, 2021 to 2025
- Current and Future Market Size Value (USD Million) Projections, 2026 to 2036
- Y-o-Y Growth Trend Analysis
- Absolute $ Opportunity Analysis
- Global Market Pricing Analysis 2021 to 2025 and Forecast 2026 to 2036
- Global Market Analysis 2021 to 2025 and Forecast 2026 to 2036, By Product
- Introduction / Key Findings
- Historical Market Size Value (USD Million) Analysis By Product , 2021 to 2025
- Current and Future Market Size Value (USD Million) Analysis and Forecast By Product , 2026 to 2036
- Active Ingredients
- Botanical Extracts
- Fruit Derived Extracts
- Vegetable Derived Extracts
- Functional Actives
- Antioxidants
- Anti Aging Actives
- Emollients And Oils
- Plant Based Oils
- Seed Oils
- Fruit Peel Oils
- Butter And Lipids
- Natural Butters
- Colorants
- Natural Pigments
- Plant Pigments
- Mineral Pigments
- Bio Colorants
- Fermented Colorants
- Surfactants
- Bio Based Surfactants
- Mild Cleansing Agents
- Foaming Agents
- Active Ingredients
- Y-o-Y Growth Trend Analysis By Product , 2021 to 2025
- Absolute $ Opportunity Analysis By Product , 2026 to 2036
- Global Market Analysis 2021 to 2025 and Forecast 2026 to 2036, By Application
- Introduction / Key Findings
- Historical Market Size Value (USD Million) Analysis By Application, 2021 to 2025
- Current and Future Market Size Value (USD Million) Analysis and Forecast By Application, 2026 to 2036
- Skin Care
- Anti Aging Products
- Wrinkle Care
- Firming Products
- Moisturizers
- Hydration Creams
- Lotions
- Cleansers
- Face Wash
- Exfoliating Cleansers
- Hair Care
- Shampoos
- Scalp Care
- Damage Repair
- Conditioners
- Hydration Conditioners
- Color Cosmetics
- Face Makeup
- Foundation
- Blush
- Eye Makeup
- Eyeshadow
- Personal Care
- Body Care
- Body Lotions
- Body Wash
- Oral Care
- Toothpaste
- Skin Care
- Y-o-Y Growth Trend Analysis By Application, 2021 to 2025
- Absolute $ Opportunity Analysis By Application, 2026 to 2036
- Global Market Analysis 2021 to 2025 and Forecast 2026 to 2036, By End Use
- Introduction / Key Findings
- Historical Market Size Value (USD Million) Analysis By End Use, 2021 to 2025
- Current and Future Market Size Value (USD Million) Analysis and Forecast By End Use, 2026 to 2036
- Cosmetic Manufacturers
- Large Scale Manufacturers
- Global Brands
- Contract Manufacturers
- Small And Medium Enterprises
- Indie Brands
- Niche Product Manufacturers
- Personal Care Brands
- Premium Brands
- Luxury Skincare Brands
- Clean Beauty Brands
- Mass Market Brands
- Retail Brands
- Cosmetic Manufacturers
- Y-o-Y Growth Trend Analysis By End Use, 2021 to 2025
- Absolute $ Opportunity Analysis By End Use, 2026 to 2036
- Global Market Analysis 2021 to 2025 and Forecast 2026 to 2036, By Distribution Channel
- Introduction / Key Findings
- Historical Market Size Value (USD Million) Analysis By Distribution Channel, 2021 to 2025
- Current and Future Market Size Value (USD Million) Analysis and Forecast By Distribution Channel, 2026 to 2036
- Direct Sales
- Ingredient Suppliers To Manufacturers
- Bulk Supply Agreements
- Long Term Contracts
- Partnership Models
- Co Development Agreements
- Sustainability Partnerships
- Distributors
- Specialty Chemical Distributors
- Regional Distributors
- Global Distributors
- Online Platforms
- Digital B2B Platforms
- Direct Sales
- Y-o-Y Growth Trend Analysis By Distribution Channel, 2021 to 2025
- Absolute $ Opportunity Analysis By Distribution Channel, 2026 to 2036
- Global Market Analysis 2021 to 2025 and Forecast 2026 to 2036, By Source
- Introduction / Key Findings
- Historical Market Size Value (USD Million) Analysis By Source, 2021 to 2025
- Current and Future Market Size Value (USD Million) Analysis and Forecast By Source, 2026 to 2036
- Plant Based Waste
- Food Industry By Products
- Fruit Peels
- Seed Residues
- Agricultural Waste
- Crop Residue
- Plant Biomass
- Animal Based Waste
- Dairy By Products
- Milk Residues
- Fat Derivatives
- Marine Waste
- Fish By Products
- Plant Based Waste
- Y-o-Y Growth Trend Analysis By Source, 2021 to 2025
- Absolute $ Opportunity Analysis By Source, 2026 to 2036
- Global Market Analysis 2021 to 2025 and Forecast 2026 to 2036, By Processing Technology
- Introduction / Key Findings
- Historical Market Size Value (USD Million) Analysis By Processing Technology, 2021 to 2025
- Current and Future Market Size Value (USD Million) Analysis and Forecast By Processing Technology, 2026 to 2036
- Biotechnological Processing
- Fermentation
- Microbial Fermentation
- Enzymatic Fermentation
- Enzyme Assisted Extraction
- Green Extraction Methods
- Low Temperature Processing
- Mechanical Processing
- Cold Pressing
- Oil Extraction
- Juice Residue Processing
- Physical Separation
- Filtration
- Biotechnological Processing
- Y-o-Y Growth Trend Analysis By Processing Technology, 2021 to 2025
- Absolute $ Opportunity Analysis By Processing Technology, 2026 to 2036
- Global Market Analysis 2021 to 2025 and Forecast 2026 to 2036, By Pricing Tier
- Introduction / Key Findings
- Historical Market Size Value (USD Million) Analysis By Pricing Tier, 2021 to 2025
- Current and Future Market Size Value (USD Million) Analysis and Forecast By Pricing Tier, 2026 to 2036
- Premium
- Sustainable Certified Ingredients
- Organic Certified
- Eco Label Certified
- Mid Range
- Standard Upcycled Ingredients
- Commercial Grade Ingredients
- Economy
- Low Cost Ingredients
- Bulk Industrial Supply
- Premium
- Y-o-Y Growth Trend Analysis By Pricing Tier, 2021 to 2025
- Absolute $ Opportunity Analysis By Pricing Tier, 2026 to 2036
- Global Market Analysis 2021 to 2025 and Forecast 2026 to 2036, By Region
- Introduction
- Historical Market Size Value (USD Million) Analysis By Region, 2021 to 2025
- Current Market Size Value (USD Million) Analysis and Forecast By Region, 2026 to 2036
- North America
- Latin America
- Western Europe
- Eastern Europe
- East Asia
- South Asia and Pacific
- Middle East & Africa
- Market Attractiveness Analysis By Region
- North America Market Analysis 2021 to 2025 and Forecast 2026 to 2036, By Country
- Historical Market Size Value (USD Million) Trend Analysis By Market Taxonomy, 2021 to 2025
- Market Size Value (USD Million) Forecast By Market Taxonomy, 2026 to 2036
- By Country
- USA
- Canada
- Mexico
- By Product
- By Application
- By End Use
- By Distribution Channel
- By Source
- By Processing Technology
- By Pricing Tier
- By Country
- Market Attractiveness Analysis
- By Country
- By Product
- By Application
- By End Use
- By Distribution Channel
- By Source
- By Processing Technology
- By Pricing Tier
- Key Takeaways
- Latin America Market Analysis 2021 to 2025 and Forecast 2026 to 2036, By Country
- Historical Market Size Value (USD Million) Trend Analysis By Market Taxonomy, 2021 to 2025
- Market Size Value (USD Million) Forecast By Market Taxonomy, 2026 to 2036
- By Country
- Brazil
- Chile
- Rest of Latin America
- By Product
- By Application
- By End Use
- By Distribution Channel
- By Source
- By Processing Technology
- By Pricing Tier
- By Country
- Market Attractiveness Analysis
- By Country
- By Product
- By Application
- By End Use
- By Distribution Channel
- By Source
- By Processing Technology
- By Pricing Tier
- Key Takeaways
- Western Europe Market Analysis 2021 to 2025 and Forecast 2026 to 2036, By Country
- Historical Market Size Value (USD Million) Trend Analysis By Market Taxonomy, 2021 to 2025
- Market Size Value (USD Million) Forecast By Market Taxonomy, 2026 to 2036
- By Country
- Germany
- UK
- Italy
- Spain
- France
- Nordic
- BENELUX
- Rest of Western Europe
- By Product
- By Application
- By End Use
- By Distribution Channel
- By Source
- By Processing Technology
- By Pricing Tier
- By Country
- Market Attractiveness Analysis
- By Country
- By Product
- By Application
- By End Use
- By Distribution Channel
- By Source
- By Processing Technology
- By Pricing Tier
- Key Takeaways
- Eastern Europe Market Analysis 2021 to 2025 and Forecast 2026 to 2036, By Country
- Historical Market Size Value (USD Million) Trend Analysis By Market Taxonomy, 2021 to 2025
- Market Size Value (USD Million) Forecast By Market Taxonomy, 2026 to 2036
- By Country
- Russia
- Poland
- Hungary
- Balkan & Baltic
- Rest of Eastern Europe
- By Product
- By Application
- By End Use
- By Distribution Channel
- By Source
- By Processing Technology
- By Pricing Tier
- By Country
- Market Attractiveness Analysis
- By Country
- By Product
- By Application
- By End Use
- By Distribution Channel
- By Source
- By Processing Technology
- By Pricing Tier
- Key Takeaways
- East Asia Market Analysis 2021 to 2025 and Forecast 2026 to 2036, By Country
- Historical Market Size Value (USD Million) Trend Analysis By Market Taxonomy, 2021 to 2025
- Market Size Value (USD Million) Forecast By Market Taxonomy, 2026 to 2036
- By Country
- China
- Japan
- South Korea
- By Product
- By Application
- By End Use
- By Distribution Channel
- By Source
- By Processing Technology
- By Pricing Tier
- By Country
- Market Attractiveness Analysis
- By Country
- By Product
- By Application
- By End Use
- By Distribution Channel
- By Source
- By Processing Technology
- By Pricing Tier
- Key Takeaways
- South Asia and Pacific Market Analysis 2021 to 2025 and Forecast 2026 to 2036, By Country
- Historical Market Size Value (USD Million) Trend Analysis By Market Taxonomy, 2021 to 2025
- Market Size Value (USD Million) Forecast By Market Taxonomy, 2026 to 2036
- By Country
- India
- ASEAN
- Australia & New Zealand
- Rest of South Asia and Pacific
- By Product
- By Application
- By End Use
- By Distribution Channel
- By Source
- By Processing Technology
- By Pricing Tier
- By Country
- Market Attractiveness Analysis
- By Country
- By Product
- By Application
- By End Use
- By Distribution Channel
- By Source
- By Processing Technology
- By Pricing Tier
- Key Takeaways
- Middle East & Africa Market Analysis 2021 to 2025 and Forecast 2026 to 2036, By Country
- Historical Market Size Value (USD Million) Trend Analysis By Market Taxonomy, 2021 to 2025
- Market Size Value (USD Million) Forecast By Market Taxonomy, 2026 to 2036
- By Country
- Kingdom of Saudi Arabia
- Other GCC Countries
- Turkiye
- South Africa
- Other African Union
- Rest of Middle East & Africa
- By Product
- By Application
- By End Use
- By Distribution Channel
- By Source
- By Processing Technology
- By Pricing Tier
- By Country
- Market Attractiveness Analysis
- By Country
- By Product
- By Application
- By End Use
- By Distribution Channel
- By Source
- By Processing Technology
- By Pricing Tier
- Key Takeaways
- Key Countries Market Analysis
- USA
- Pricing Analysis
- Market Share Analysis, 2025
- By Product
- By Application
- By End Use
- By Distribution Channel
- By Source
- By Processing Technology
- By Pricing Tier
- Canada
- Pricing Analysis
- Market Share Analysis, 2025
- By Product
- By Application
- By End Use
- By Distribution Channel
- By Source
- By Processing Technology
- By Pricing Tier
- Mexico
- Pricing Analysis
- Market Share Analysis, 2025
- By Product
- By Application
- By End Use
- By Distribution Channel
- By Source
- By Processing Technology
- By Pricing Tier
- Brazil
- Pricing Analysis
- Market Share Analysis, 2025
- By Product
- By Application
- By End Use
- By Distribution Channel
- By Source
- By Processing Technology
- By Pricing Tier
- Chile
- Pricing Analysis
- Market Share Analysis, 2025
- By Product
- By Application
- By End Use
- By Distribution Channel
- By Source
- By Processing Technology
- By Pricing Tier
- Germany
- Pricing Analysis
- Market Share Analysis, 2025
- By Product
- By Application
- By End Use
- By Distribution Channel
- By Source
- By Processing Technology
- By Pricing Tier
- UK
- Pricing Analysis
- Market Share Analysis, 2025
- By Product
- By Application
- By End Use
- By Distribution Channel
- By Source
- By Processing Technology
- By Pricing Tier
- Italy
- Pricing Analysis
- Market Share Analysis, 2025
- By Product
- By Application
- By End Use
- By Distribution Channel
- By Source
- By Processing Technology
- By Pricing Tier
- Spain
- Pricing Analysis
- Market Share Analysis, 2025
- By Product
- By Application
- By End Use
- By Distribution Channel
- By Source
- By Processing Technology
- By Pricing Tier
- France
- Pricing Analysis
- Market Share Analysis, 2025
- By Product
- By Application
- By End Use
- By Distribution Channel
- By Source
- By Processing Technology
- By Pricing Tier
- India
- Pricing Analysis
- Market Share Analysis, 2025
- By Product
- By Application
- By End Use
- By Distribution Channel
- By Source
- By Processing Technology
- By Pricing Tier
- ASEAN
- Pricing Analysis
- Market Share Analysis, 2025
- By Product
- By Application
- By End Use
- By Distribution Channel
- By Source
- By Processing Technology
- By Pricing Tier
- Australia & New Zealand
- Pricing Analysis
- Market Share Analysis, 2025
- By Product
- By Application
- By End Use
- By Distribution Channel
- By Source
- By Processing Technology
- By Pricing Tier
- China
- Pricing Analysis
- Market Share Analysis, 2025
- By Product
- By Application
- By End Use
- By Distribution Channel
- By Source
- By Processing Technology
- By Pricing Tier
- Japan
- Pricing Analysis
- Market Share Analysis, 2025
- By Product
- By Application
- By End Use
- By Distribution Channel
- By Source
- By Processing Technology
- By Pricing Tier
- South Korea
- Pricing Analysis
- Market Share Analysis, 2025
- By Product
- By Application
- By End Use
- By Distribution Channel
- By Source
- By Processing Technology
- By Pricing Tier
- Russia
- Pricing Analysis
- Market Share Analysis, 2025
- By Product
- By Application
- By End Use
- By Distribution Channel
- By Source
- By Processing Technology
- By Pricing Tier
- Poland
- Pricing Analysis
- Market Share Analysis, 2025
- By Product
- By Application
- By End Use
- By Distribution Channel
- By Source
- By Processing Technology
- By Pricing Tier
- Hungary
- Pricing Analysis
- Market Share Analysis, 2025
- By Product
- By Application
- By End Use
- By Distribution Channel
- By Source
- By Processing Technology
- By Pricing Tier
- Kingdom of Saudi Arabia
- Pricing Analysis
- Market Share Analysis, 2025
- By Product
- By Application
- By End Use
- By Distribution Channel
- By Source
- By Processing Technology
- By Pricing Tier
- Turkiye
- Pricing Analysis
- Market Share Analysis, 2025
- By Product
- By Application
- By End Use
- By Distribution Channel
- By Source
- By Processing Technology
- By Pricing Tier
- South Africa
- Pricing Analysis
- Market Share Analysis, 2025
- By Product
- By Application
- By End Use
- By Distribution Channel
- By Source
- By Processing Technology
- By Pricing Tier
- USA
- Market Structure Analysis
- Competition Dashboard
- Competition Benchmarking
- Market Share Analysis of Top Players
- By Regional
- By Product
- By Application
- By End Use
- By Distribution Channel
- By Source
- By Processing Technology
- By Pricing Tier
- Competition Analysis
- Competition Deep Dive
- BASF
- Overview
- Product Portfolio
- Profitability by Market Segments (Product/Age /Sales Channel/Region)
- Sales Footprint
- Strategy Overview
- Marketing Strategy
- Product Strategy
- Channel Strategy
- Givaudan
- Symrise
- Croda International
- Clariant
- Firmenich
- Seppic
- Akott Evolution
- IFF
- L’Oréal
- Others
- BASF
- Competition Deep Dive
- Assumptions & Acronyms Used


