Banana Milk Market Size and Share Forecast Outlook (2025 to 2035)

Between 2025 and 2035 the banana milk market will expand significantly because plant-based dairy alternatives appeal more to consumers while health concerns rise and people want beverages with more nutrients. Banana milk continues to grow in popularity because it suits health-focused people as well as those who follow vegan diets and have lactose intolerance.

Market growth receives additional support from two major market trends: functional beverage and clean-label product consumption increase. The marketplace is seeing higher adoption rates of banana milk products thanks to advanced packaging techniques and improved shelf life technology and enhanced fortified variances.

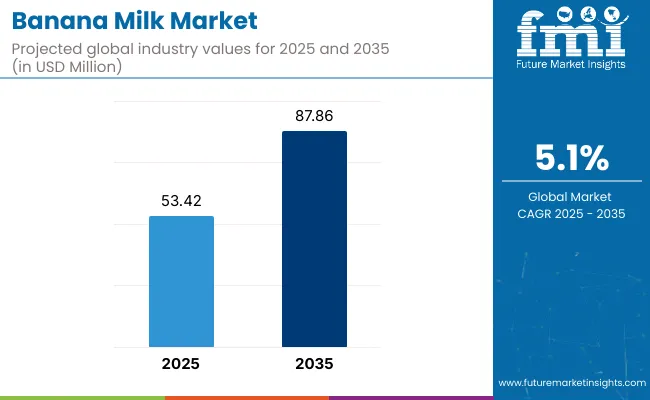
The banana milk market experienced a valuation of USD 53.42 Million in 2025 before it predicts to achieve USD 87.86 Million by 2035 showing a 5.1% CAGR growth. The market growth of banana milk derives from its expanding availability within general retail stores and major brand expansion of product selection together with strategic marketing initiatives that highlight digestive health benefits and energy-boosting potential.
Banana Milk Market

Market growth receives additional support from online grocery platforms and direct-to-consumer channels. The production of bananas with organic and sustainable origins fits the consumer preference for eco-friendly food items.

Regional Performance and Growth Trends in the Banana Milk Market

North America

The North America banana milk market remains significant as the need for healthy beverages increases, dairy-free alternatives are on the rise, and functional beverages take precedence. United States, Canada sales hitting plant-based milk record, banana milk has natural sweetness and nutritional advantages leisurely as a new option. Furthermore, these market growths are being backed with the expansion of health food store, online grocery delivery services, and product innovation of flavours and formulations. Moreover, collaborations of banana milk brands with fitness influencers are increasing product visibility and helping drive product adoption.

Europe

Increasing rise of vegan dietary patterns, governmental support for dairy free options, and growth in the organic food industry are all aiding Europe to witness high growth rates in the banana milk market. Germany, France, and the UK are spearheading growth in banana milk; supermarket and specialty health stores there are expanding dairy-free beverage aisles. Market growth is also accelerating as the demand for functional, protein-rich, plant-based beverages continues to increase. Moreover, environmentally aware consumers are getting behind banana milk brands that use sustainable sourcing and environmentally conscious packaging.

Asia-Pacific

The highest growth of the banana milk market should be from Asia-Pacific region, driven by the sewing trend of plant-based diets, increasing disposable incomes and the improving market for beverage health-cantered. According to a new report from Well meal, an Instacart company: In South Korea, China, Japan and India, the most demanded drinks are dairy-free and fortified, thereby increasing the popularity of banana milk in retailing and foodservice as well among consumers. The robust distribution networks of the region, strong marketing of products with aggressive promotional strategies, and increasing influence of social media trends promoting health benefits associated with plant-based followed by the growing trend of healthy diet among all age groups are being witnessed which further drives the growth in such market. In addition, governmental programs advocating alternative proteins and sustainable agriculture are propelling the banana milk sector in the long term.

Challenges and Opportunities

Challenge

High Costs and Regulatory Complexities

High production costs, stringent regulatory compliance, and supply chain restrictions are some of the constraints faced by the Banana Milk Market. Also, the high costs for processing and preserving the freshness and nutritional goodness of banana milk lead to even higher costs on the manufacturer side. Moreover, regulatory frameworks governing dairy alternatives and plant-based beverages (incidentally, the FDA and EU food safety guidelines) mandate stringent compliance with labelling and nutritional standards. This can only be achieved if companies invest in technologies that can facilitate the efficient processing of alternative proteins, responsible sourcing of ingredients, eco-friendly packaging solutions, and regulatory compliance of their products all while being cost-effective.

Short Shelf Life and Consumer Perception

In comparison with traditional dairy and plant-based milk alternatives, banana milk has a much shorter shelf-life, which presents challenges for distribution and inventory management. With high levels of natural sugars and susceptibility to oxidation, innovative preservation techniques are needed to keep closely atmospherically with flavour and mouthfeel. In addition, consumer perception is still a work in progress as banana milk is a new product in the plant-based beverages category. Many consumers may not understand its benefits, and they possibly innately favour more established alternatives like almond or oat milk. Wide awareness, better packaging lay down methods, and longer shelf life formulations are the need of the hour for better market penetration.

Opportunity

Rising Demand for Dairy Alternatives and Plant-Based Nutrition

Demand for banana milk is being driven by an increasing shift towards plant-based diets and sugar-free dairy alternatives. Demand for nutritious, allergen-friendly, and naturally sweetened milk alternatives has made banana milk particularly attractive. Given its high potassium and natural sugar content along with digestive benefits, it has a unique placement out there. Brands that invest in innovative flavours, fortified formulations and convenient packaging will encourage purchase from health-conscious consumers, thereby growing market share.

Advancements in Functional Beverages and Sustainable Packaging

Banana milk itself has great potential fuelled by the expansion of functional drinks enhanced with vitamins, probiotics or plant mad protein. This has inspired companies to create new nutrient-enhanced versions, suitable for fitness, children and consumers wanting fortified dairy alternatives. Additionally, the demand for sustainable and eco-friendly packaging is on the rise, this means manufacturers are now focusing on bio-degradable cartons or recyclable bottles, and waste-reducing production techniques. The Banana Milk Market is dynamic, with technology development and leaders actively covering their answer space regarding nutritional optimization and sustainable packaging, demonstrating they are two to take into account when it comes to becoming the market's next players.
Shifts in the Banana Milk Market from 2020 to 2024 and Future Trends 2025 to 2035.

During that time, customer interest in global Banana milk Market was growing with shifting to plant-based nutrition and dairy alternatives. As consumers focused on better health and individuals sensitive to lactose sought relief, banana milk was embraced as a nutritious and naturally sweet alternative. Nonetheless, factors like high production costs, scarcity, and a lack of consumer awareness hamstrung rapid development in the market space. Companies responded by enhancing processing techniques, introducing new flavours and expanding retail distribution lines to reach a wider range of consumers.

2025 to 2035: Changing the future of the world, from plant to people, banana milk will continue to transform the market through food technology, shelf-life extension, and banana milk's growth in retail and foodservice. AI-powered food formulation, sustainable ingredient sourcing, and interactive packaging will set new industry standards. The increasing impact of personalized nutrition and health-driven product development will also promote the development. The Next Level of Banana Milk Market Will Be Led by Such Companies Who Will Focus More on Innovation, Sustainability and Consumer Engagement.

Market Shifts: A Comparative Analysis (2020 to 2024 vs. 2025 to 2035)

Market Shift 2020 to 2024
Regulatory Landscape Compliance with plant-based beverage labelling and safety regulations
Technological Advancements Growth in natural sweetener use and organic processing techniques
Industry Adoption Increased demand in niche health markets and plant-based beverage enthusiasts
Supply Chain and Sourcing Dependence on seasonal banana crops and traditional processing methods
Market Competition Emerging plant-based brands and dairy-free product developers
Market Growth Drivers Lots of people are looking for dairy-free, allergen-free, and naturally sweetened milk alternatives
Sustainability and Energy Efficiency Early emphasis on recyclable packaging and organic ingredient sourcing
Integration of Smart Monitoring Limited use of real-time freshness tracking and digital product authentication
Advancements in Beverage Applications Use in breakfast smoothies, health drinks, and dairy-free alternatives
Market Shift 2025 to 2035
Regulatory Landscape Expansion of nutritional fortification standards, sustainability mandates, and clean-label certifications.
Technological Advancements Integration of AI-driven formulation, probiotic-enhanced banana milk, and extended shelf-life packaging.
Industry Adoption Expansion into mainstream retail, quick-service restaurants, and personalized nutrition platforms.
Supply Chain and Sourcing Shift toward controlled environment farming, sustainable sourcing, and AI-optimized supply chain logistics.
Market Competition The rise of functional beverage companies, eco-conscious food brands, and high-performance nutrition firms.
Market Growth Drivers More spending on functional drinks, sustainable packaging and customization in food plant-based nutrition
Sustainability and Energy Efficiency Widespread use of carbon-neutral production, zero-waste packaging, and upcycled banana ingredients.
Integration of Smart Monitoring Expansion of AI-powered food safety monitoring, block chain-based supply chain transparency, and IoT-enabled packaging.
Advancements in Beverage Applications Evolution of banana milk-based protein shakes, probiotic-enriched beverages, and plant-based sports nutrition solutions.

Country-wise Market Outlook: Banana Milk Market

United States

Rising consumer preference for functional beverages and plant-based dairy alternatives is driving growth in USA banana milk consumption. Meanwhile, rise in health-conscious population is driving demand for lactose-free and nutrient-enriched milk alternatives which in turn is bolstering market growth.

Key retailers and beverage brands are broadening product categories by adding banana milk solutions, with ready-to-drink palatable formats and flavoured beverage lines. Moreover, increased adoption of clean-label and organic products is also driving demand.

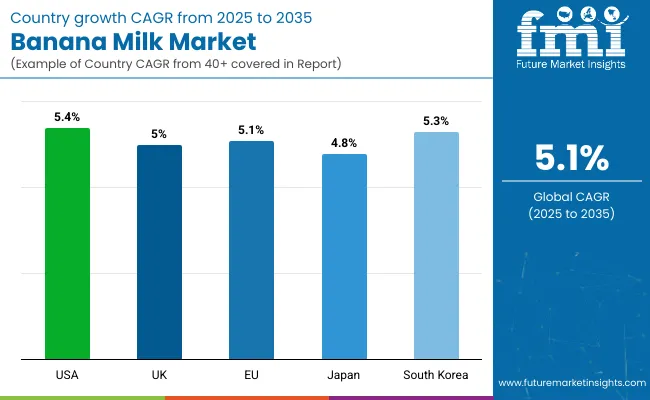
Country CAGR (2025 to 2035)
USA 5.4%

United Kingdom

The UK's banana milk market is on a steady growth path as health and wellness plant-based drinks gain momentum. This is driven by consumers looking for dairy-free and naturally sourced ingredients alternatives.

Many brands are now launching varieties of banana milk that have added nutritional benefits as the popularity of fortified and protein-enhanced plant-based beverages continues to grow. As well as the fact that consumers who are mindful of sustainability are gravitating toward packaging solutions that meet eco-friendly actions.

Country CAGR (2025 to 2035)
UK 5.0%

European Union

With strong demand for banana milk in the European Union, key markets include Germany, France and the Netherlands, which are leading in terms of growth. The rising trend towards veganism and lactose free diets has contributed to consumers opting for plant based dairy.

Market growth is further important by the support of initiative taken by government towards sustainable and non-diary milk options. Furthermore, flavour innovations and organic banana milk variants tend towards health-aware people across Europe.

Country CAGR (2025 to 2035)
European Union (EU) 5.1%

Japan

Japan’s banana milk market is being steadily driven by the country’s high demand for unique and functional beverages. The health advantages of banana-based drinks and the rising demand for flavoured milk drinks are driving the growth of the market.

Now urban consumers are being wooed by convenient, on-the-go packaging and premium banana milk offerings. The growth of café culture and the demand for naturally sweetened drinks are also helping to drive the complement banana milk products.

Country CAGR (2025 to 2035)
Japan 4.8%

South Korea

The market for banana milk is growing solid thanks to the popularity of various kinds of banana flavour dairy drinks. K-pop culture has a strong influence and marketing collaborations between beverage brands and entertainment industries are increasing product visibility.

Dean Foods, the leading milk producer in the United States, identified the rise in fortified and probiotic-infused plant-based drinks and has begun to reshape banana milk, which is a trend that we hope encourages innovation in this space. And, rising sales of banana milk products to foreign markets are also aiding the industry's expansion.

Country CAGR (2025 to 2035)
South Korea 5.3%

Segmentation Outlook - Banana Milk Market

Organic Banana Milk and Milk & Milk Beverages Drive Market Growth as Demand for Plant-Based Dairy Alternatives Expands

With an increasing demand for plant-based, nutrient-rich, and dairy-free food & beverages the organic banana milk and milk & milk beverages segments occupy a significant share of the banana milk market. Method produced banana-based milk products are key in the surface of the growing non-dairy beverages market, sustainable agriculture, valuable functional nutrition and health benefits, making them which are important to health-conscious consumers, plant-based propensity citizens, and milk industry innovators.

With the rising trends of veganism/lactose intolerance and clean-label inspection, manufacturers are increasingly investing in organic source of ingredients, fortified formulations, and cartridge packaging solutions for their products to be more appealing, shelf-life to expand, and balance of nutrients to be maintained.

Health-Conscious Consumers Focused on Clean-Label and Non-Dairy, Are Fuelling Market Demand for Organic Banana Milk

Organic Banana Milk Provides Chemical-Free Nutrition, Improved Sustainability, and Superior Taste

The organic banana milk segment has captured a significant portion of the banana milk market due to the demand among health-conscious consumers for a product with enhanced nutritional value, clear label value, and chemical-free processing. Organic banana milk, for instance, is produced without the use of synthetic pesticides, artificial flavouring, and GMOs, making it a far more reliable choice for consumers looking for that dietary assurance.

The adoption has been spurred by demand for certified organic banana milk, made with naturally ripe bananas, non-GMO ingredients, and ethically sourced raw materials. Organic Banana Milk Market Overview With an increasing number of consumers being health-conscious and environmentally aware, almost over 60% of banana milk consumers prefer organic banana milk against conventional banana milk, driving assured demand for this segment of the product.

The growing presence of sustainable agricultural programs, including regenerative agriculture, fair-trade sourced bananas, and carbon-neutral logistics, has aligned market demand with ethical and environmentally conservative food production practices.

Next-generation organic banana milk formulations characterized by dairy-free protein enrichment, increased fiber content, and fortified vitamin blends has further accelerated adoption ensuring improved functional nutrition and greater dietary inclusion.

Customised organic banana milk variations with sugar-free, probiotic-infused and flavoured formulations has facilitated market expansion as these variants cater to a wide scale of consumers and could be adjusted effectively based on the pulse of diet adoption.

Though it has benefits in terms of supporting clean eating, its effects on digestive health, and aligning with sustainable farming practices, the organic banana milk segment is also hamstrung by challenges related to higher production costs associated with organic farming, the limited global supply of organic bananas, and price-sensitive consumers. But this demand is being addressed by innovations such as AI-driven organic certification tracking, block chain-enabled ingredient sourcing, and eco-friendly packaging innovations that are helping to improve cost-efficiency, traceability, and sustainability compliance, as a result securing the ongoing market viability of organic banana milk in which ever region it is found across the globe.

Organic Banana Milk Is Growing Adoption in Health Retail Stores, Vegan Food Groups, and Functional Beverage Space

There is strong adoption for the organic banana milk segment, especially from vegan food producers, dairy-free beverage brands and specialty health food retailers, as the industries are projected to adopt clean-label, plant-based dairy alternatives in their product portfolios. Mass-market regular dairy milk is prevalent, but organic banana milk is gaining ground for several reasons - higher nutrient retention levels, natural sugar, lower environmental impact, greater consumer trust, and the ability to fit in with different diets.

Demand for next generation organic banana milk solutions with AI-based nutritional formulation, bio-fortified ingredient blends, and non-GMO organic certification tracking are fuelling adoption. Recent studies show that 70% of dairy-free consumers and fitness enthusiasts actively search for organic banana milk as a functional beverage choice, solidifying demand through this segment.

Market adoption has been further strengthened by increasing availability of organic banana milk-based health drinks, with no-sugar-added, high-protein, and gut-health-focusing variants, ensuring higher dietary inclusivity and wider health benefits.

The growth is driven by the growing trend towards the adoption of smart/interactive packaging solutions, including digital ingredient transparency display, QR code-based supply chain tracking, and biodegradable carton design to improve consumer engagement and sustainability compliance.

Although organic banana milk has advantages such as supporting consumer well-being, freedom from dietary restrictions and sustainable sourcing, its segment will need to overcome challenges such as a crowded market of competing non-dairy alternative milks, changing organic farming regulations and an inability to monetize in mass-market distribution. But innovative developments in AI powered dairy free processing, organic agro-tech pattern monitoring, as well as smart-label product authenticity verification will enhance product reliability, supply chain integrity and global market accessibility for free so ensuring organic banana milk will continue on its upward trajectory on the international stage.

Milk & Milk Beverages Drive Market Growth as Banana Milk Gains Popularity in Dairy-Free and Functional Beverage Categories

Banana Milk: Pioneering a new wave of Nutrient-Dense and Flavourful Dairy Alternatives

The milk & milk beverages segment has always been the riveted category in banana milk single-handedly making plant-based milk available across mainstream consumer markets for dairy alternative brands, beverage manufacturers, and nutritional product developers. In contrast to conventional dairy products, banana milk naturally contains sweetness without the lactose and allergens that can restrict pulp consumption, providing a broader dietary inclusion with a composition that optimizes nutritional balance.

The proliferation of fortified banana milk drinks with plant-based protein, omega-containing additives and probiotics for gut-health has driven market uptake. Research shows that more than 65 percent of consumers who defect from traditional dairy milk have, in fact, turned to banana milk as a flavourful and functional alternative, thus, making this segment a robust demand driver.

Calcium-fortified, naturally thickened and fortified “banana milk” drinks are just one innovation driving dairy-free market sales, making them more accessible to a broader spectrum of consumers and diets.

On-the-go packaging, extended shelf-life formulations, and single-serve convenience packs further encourage the adoption of the banana milk beverage in ready-to-drink (RTD) forms, expanding market reach, and further establishing broader retail availability.

The versatility and improved culinary applications of banana milk have been optimized in some part due to the development of the barista banana milk for frothing, smoothie formulations and dessert compatibility.

While offering benefits of expanding dairy-free choices, increasing beverage variety, and enhanced nutritional accessibility the milk & milk beverages segment is challenged by commodity raw ingredient pricing, food labelling compliance evolution, and consistency pricing in volume production. Production stability, market competitiveness, and health benefits of banana milk are all improved through new technologies to formulate beverages with the best performing plant materials, apply AI to develop and patent dairy-free emulsification powders, and create optimized plant-based nutritional compositions.

Milk & Milk Beverages Trend limiting Cato Banana Milk Uses in Smoothies, Coffee Enhancers, and Dairy-Free Protein Drinks

Banana milk and milk beverages segment is rapidly adopted in the industries of smoothie bar chains, coffee shops, and plant-based protein drinks, as increasing number of industries highlighting banana milk as high nutritive, naturally flavoured, lactose-free beverage alternative. Traditional dairy-based drinks have a lower digestibility compared with banana milk and are less effective, both in terms of their natural sweetness as well as their nutrient-rich compositions ensuring better consumer adoption as well as versatility in beverage applications.

Adoption has been fuelled by demand for coffee-gaining applications of banana milk, with barista-grade frothed capability, neutral taste balance and heat-resistant consistency; with its natural creaminess and mild sweetness, studies show that over two-thirds of plant-based beverage consumers prefer banana milk in their coffee and smoothie blends, creating an ever-present demand for this segment.

While the milk & milk beverages segment has several advantages in terms of functional beverage enhancement, improved dietary flexibility, and sustainability, consumers indicate several barriers including the higher costs associated with processing milk products, longer research and development cycles to facilitate taste optimization, and evolving consumer taste profiles favouring plant-based ingredients. But trends in AI-powered beverage analytics, plant-based stabilizers development and block chain-based ingredient authenticity assessment are increasing market transparency, product differentiation and audience credibility, guaranteeing global banana milk beverages' expansion.

Competitive Outlook: Banana Milk Market

Industry Overview

The banana milk market is influenced by growing consumer preference for plant-based dairy alternatives, rising health consciousness, and the proliferation of the functional beverages market. Banana milk is gaining traction as a sweet, lactose-free and nutrient-packed beverage, for vegans, lactose-intolerant consumers and fitness lovers. The market is also led by the innovations in flavour variations, fortified nutritional content, and sustainable packaging. Top manufacturers emphasize organic ingredients, clean-label formulations and wider coverage through retail and e-commerce channels to harness a growing consumer base.

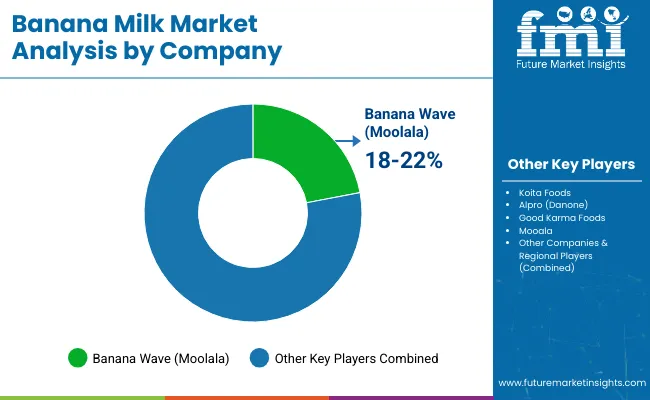
Market Share Analysis by Company

Company Name Estimated Market Share (%)
Banana Wave (Moolala) 18-22%
Koita Foods 15-19%
Alpro (Danone) 12-16%
Good Karma Foods 9-13%
Mooala 7-11%
Other Companies & Regional Players (Combined) 30-40%

Key Company Offerings and Activities

Company Name Key Offerings/Activities
Banana Wave (Moolala) Produces dairy-free banana milk with added nutrients, available in multiple flavours and fortified variants.
Koita Foods Specializes in organic banana milk with a focus on clean-label, non-GMO, and preservative-free formulations.
Alpro (Danone) Offers plant-based banana milk alternatives with protein enrichment and sustainable packaging.
Good Karma Foods Develops nutrient-rich banana milk with omega-3 fortification and enhanced functional benefits.
Mooala Provides organic, unsweetened, and flavoured banana milk options tailored to health-conscious consumers.

Key Company Insights

Banana Wave (Moolala) (18-22%)

Banana Wave is a leading brand in the banana milk segment, offering nutrient-fortified, plant-based alternatives with natural sweetness and no artificial additives.

Koita Foods (15-19%)

Koita Foods specializes in organic banana milk, emphasizing clean-label formulations, non-GMO ingredients, and global distribution.

Alpro (Danone) (12-16%)

A leader in plant-based milk, Alpro is owned by Danone and expands its portfolio with the addition of banana milk.

Good Karma Foods (9-13%)

Good Karma Foods differentiates itself with omega-3 fortified banana milk, catering to health-conscious consumers looking for added functional benefits.

Mooala (7-11%)

This allergen-free brand offers organic and unsweetened banana milk under the Mooala name, a smaller player in the dairy-free world that is slowly but surely growing.

Other Important Components (30-40% Combined)

Other companies are expanding the banana milk category with new flavours, organic products and sustainable manufacturing. Notable players include:

  • Elmhurst 1925 - provides dairy-free banana milk with simple, clean ingredients and no preservatives.
  • Pacific Foods - Makes sustainable organic, plant-based banana milk.
  • Three Trees Organics - Specializes in organic, handcrafted banana milk with no added sugars or artificial ingredients.
  • Sproud - Uses bananas for milk alternatives targeting the fitness and wellness market.
  • Califia Farms - focused on flavoured and barista-friendly banana milk for coffee and smoothie applications.

Top Segments Studied in the Banana Milk Market Research Report

By Nature:

  • Organic
  • Conventional

By Flavor:

  • Sweetened
  • Unsweetened

By Sales Channel:

  • Direct
  • Indirect

By End Use:

  • Dairy Products
  • Bakery & Confectionary
  • Milk & Milk Beverages
  • Retail Sales

By Region:

  • North America
  • Latin America
  • Western Europe
  • Eastern Europe
  • South Asia and Pacific
  • East Asia
  • Middle East and Africa

Table of Content

  1. Executive Summary
  2. Industry Introduction, including Taxonomy and Market Definition
  3. Market Trends and Success Factors, including Macro-economic Factors, Market Dynamics, and Recent Industry Developments
  4. Market Demand Analysis 2020 to 2024 and Forecast 2025 to 2035, including Historical Analysis and Future Projections
  5. Market Analysis 2020 to 2024 and Forecast 2025 to 2035
    • Nature
    • Sales Channel
    • End Use
    • Flavor
  6. Market Analysis 2020 to 2024 and Forecast 2025 to 2035, By Nature
    • Organic
    • Conventional
  7. Market Analysis 2020 to 2024 and Forecast 2025 to 2035, By Sales Channel
    • Direct
    • Indirect
  8. Market Analysis 2020 to 2024 and Forecast 2025 to 2035, By End Use
    • Dairy Products
    • Bakery & Confectionery
    • Milk & Milk Beverages
    • Retail Sales
  9. Market Analysis 2020 to 2024 and Forecast 2025 to 2035, By Flavor
    • Sweetened
    • Unsweetened
  10. Market Analysis 2020 to 2024 and Forecast 2025 to 2035, By Region
    • North America
    • Latin America
    • Western Europe
    • Eastern Europe
    • East Asia
    • South Asia Pacific
    • Middle East and Africa
  11. North America Sales Analysis 2020 to 2024 and Forecast 2025 to 2035, by Key Segments and Countries
  12. Latin America Sales Analysis 2020 to 2024 and Forecast 2025 to 2035, by Key Segments and Countries
  13. Western Europe Sales Analysis 2020 to 2024 and Forecast 2025 to 2035, by Key Segments and Countries
  14. Eastern Europe Sales Analysis 2020 to 2024 and Forecast 2025 to 2035, by Key Segments and Countries
  15. East Asia Sales Analysis 2020 to 2024 and Forecast 2025 to 2035, by Key Segments and Countries
  16. South Asia Pacific Sales Analysis 2020 to 2024 and Forecast 2025 to 2035, by Key Segments and Countries
  17. Middle East and Africa Sales Analysis 2020 to 2024 and Forecast 2025 to 2035, by Key Segments and Countries
  18. Sales Forecast 2025 to 2035 by Nature, Sales Channel, End Use, and Flavor for 30 Countries
  19. Competition Outlook, including Market Structure Analysis, Company Share Analysis by Key Players, and Competition Dashboardv
  20. Company Profile
    • Symrise AG (Cobel Ltd)
    • Döhler GmbH
    • Kiril Mischeff
    • Superior Foods
    • Paradise Ingredients
    • FructaCR S.A.
    • ABC Fruits
    • Ariza B.V.
    • Newberry International Produce Limited
    • Grünewald Fruchtsaft GmbH

List of Tables

Table 1: Global Market Value (US$ Million) Forecast by Region, 2018 to 2033

Table 2: Global Market Volume (Liters) Forecast by Region, 2018 to 2033

Table 3: Global Market Value (US$ Million) Forecast by Nature, 2018 to 2033

Table 4: Global Market Volume (Liters) Forecast by Nature, 2018 to 2033

Table 5: Global Market Value (US$ Million) Forecast by Flavor, 2018 to 2033

Table 6: Global Market Volume (Liters) Forecast by Flavor, 2018 to 2033

Table 7: Global Market Value (US$ Million) Forecast by Sales Channel, 2018 to 2033

Table 8: Global Market Volume (Liters) Forecast by Sales Channel, 2018 to 2033

Table 9: Global Market Value (US$ Million) Forecast by End-Use, 2018 to 2033

Table 10: Global Market Volume (Liters) Forecast by End-Use, 2018 to 2033

Table 11: North America Market Value (US$ Million) Forecast by Country, 2018 to 2033

Table 12: North America Market Volume (Liters) Forecast by Country, 2018 to 2033

Table 13: North America Market Value (US$ Million) Forecast by Nature, 2018 to 2033

Table 14: North America Market Volume (Liters) Forecast by Nature, 2018 to 2033

Table 15: North America Market Value (US$ Million) Forecast by Flavor, 2018 to 2033

Table 16: North America Market Volume (Liters) Forecast by Flavor, 2018 to 2033

Table 17: North America Market Value (US$ Million) Forecast by Sales Channel, 2018 to 2033

Table 18: North America Market Volume (Liters) Forecast by Sales Channel, 2018 to 2033

Table 19: North America Market Value (US$ Million) Forecast by End-Use, 2018 to 2033

Table 20: North America Market Volume (Liters) Forecast by End-Use, 2018 to 2033

Table 21: Latin America Market Value (US$ Million) Forecast by Country, 2018 to 2033

Table 22: Latin America Market Volume (Liters) Forecast by Country, 2018 to 2033

Table 23: Latin America Market Value (US$ Million) Forecast by Nature, 2018 to 2033

Table 24: Latin America Market Volume (Liters) Forecast by Nature, 2018 to 2033

Table 25: Latin America Market Value (US$ Million) Forecast by Flavor, 2018 to 2033

Table 26: Latin America Market Volume (Liters) Forecast by Flavor, 2018 to 2033

Table 27: Latin America Market Value (US$ Million) Forecast by Sales Channel, 2018 to 2033

Table 28: Latin America Market Volume (Liters) Forecast by Sales Channel, 2018 to 2033

Table 29: Latin America Market Value (US$ Million) Forecast by End-Use, 2018 to 2033

Table 30: Latin America Market Volume (Liters) Forecast by End-Use, 2018 to 2033

Table 31: Western Europe Market Value (US$ Million) Forecast by Country, 2018 to 2033

Table 32: Western Europe Market Volume (Liters) Forecast by Country, 2018 to 2033

Table 33: Western Europe Market Value (US$ Million) Forecast by Nature, 2018 to 2033

Table 34: Western Europe Market Volume (Liters) Forecast by Nature, 2018 to 2033

Table 35: Western Europe Market Value (US$ Million) Forecast by Flavor, 2018 to 2033

Table 36: Western Europe Market Volume (Liters) Forecast by Flavor, 2018 to 2033

Table 37: Western Europe Market Value (US$ Million) Forecast by Sales Channel, 2018 to 2033

Table 38: Western Europe Market Volume (Liters) Forecast by Sales Channel, 2018 to 2033

Table 39: Western Europe Market Value (US$ Million) Forecast by End-Use, 2018 to 2033

Table 40: Western Europe Market Volume (Liters) Forecast by End-Use, 2018 to 2033

Table 41: Eastern Europe Market Value (US$ Million) Forecast by Country, 2018 to 2033

Table 42: Eastern Europe Market Volume (Liters) Forecast by Country, 2018 to 2033

Table 43: Eastern Europe Market Value (US$ Million) Forecast by Nature, 2018 to 2033

Table 44: Eastern Europe Market Volume (Liters) Forecast by Nature, 2018 to 2033

Table 45: Eastern Europe Market Value (US$ Million) Forecast by Flavor, 2018 to 2033

Table 46: Eastern Europe Market Volume (Liters) Forecast by Flavor, 2018 to 2033

Table 47: Eastern Europe Market Value (US$ Million) Forecast by Sales Channel, 2018 to 2033

Table 48: Eastern Europe Market Volume (Liters) Forecast by Sales Channel, 2018 to 2033

Table 49: Eastern Europe Market Value (US$ Million) Forecast by End-Use, 2018 to 2033

Table 50: Eastern Europe Market Volume (Liters) Forecast by End-Use, 2018 to 2033

Table 51: South Asia and Pacific Market Value (US$ Million) Forecast by Country, 2018 to 2033

Table 52: South Asia and Pacific Market Volume (Liters) Forecast by Country, 2018 to 2033

Table 53: South Asia and Pacific Market Value (US$ Million) Forecast by Nature, 2018 to 2033

Table 54: South Asia and Pacific Market Volume (Liters) Forecast by Nature, 2018 to 2033

Table 55: South Asia and Pacific Market Value (US$ Million) Forecast by Flavor, 2018 to 2033

Table 56: South Asia and Pacific Market Volume (Liters) Forecast by Flavor, 2018 to 2033

Table 57: South Asia and Pacific Market Value (US$ Million) Forecast by Sales Channel, 2018 to 2033

Table 58: South Asia and Pacific Market Volume (Liters) Forecast by Sales Channel, 2018 to 2033

Table 59: South Asia and Pacific Market Value (US$ Million) Forecast by End-Use, 2018 to 2033

Table 60: South Asia and Pacific Market Volume (Liters) Forecast by End-Use, 2018 to 2033

Table 61: East Asia Market Value (US$ Million) Forecast by Country, 2018 to 2033

Table 62: East Asia Market Volume (Liters) Forecast by Country, 2018 to 2033

Table 63: East Asia Market Value (US$ Million) Forecast by Nature, 2018 to 2033

Table 64: East Asia Market Volume (Liters) Forecast by Nature, 2018 to 2033

Table 65: East Asia Market Value (US$ Million) Forecast by Flavor, 2018 to 2033

Table 66: East Asia Market Volume (Liters) Forecast by Flavor, 2018 to 2033

Table 67: East Asia Market Value (US$ Million) Forecast by Sales Channel, 2018 to 2033

Table 68: East Asia Market Volume (Liters) Forecast by Sales Channel, 2018 to 2033

Table 69: East Asia Market Value (US$ Million) Forecast by End-Use, 2018 to 2033

Table 70: East Asia Market Volume (Liters) Forecast by End-Use, 2018 to 2033

Table 71: Middle East and Africa Market Value (US$ Million) Forecast by Country, 2018 to 2033

Table 72: Middle East and Africa Market Volume (Liters) Forecast by Country, 2018 to 2033

Table 73: Middle East and Africa Market Value (US$ Million) Forecast by Nature, 2018 to 2033

Table 74: Middle East and Africa Market Volume (Liters) Forecast by Nature, 2018 to 2033

Table 75: Middle East and Africa Market Value (US$ Million) Forecast by Flavor, 2018 to 2033

Table 76: Middle East and Africa Market Volume (Liters) Forecast by Flavor, 2018 to 2033

Table 77: Middle East and Africa Market Value (US$ Million) Forecast by Sales Channel, 2018 to 2033

Table 78: Middle East and Africa Market Volume (Liters) Forecast by Sales Channel, 2018 to 2033

Table 79: Middle East and Africa Market Value (US$ Million) Forecast by End-Use, 2018 to 2033

Table 80: Middle East and Africa Market Volume (Liters) Forecast by End-Use, 2018 to 2033

List of Figures

Figure 1: Global Market Value (US$ Million) by Nature, 2023 to 2033

Figure 2: Global Market Value (US$ Million) by Flavor, 2023 to 2033

Figure 3: Global Market Value (US$ Million) by Sales Channel, 2023 to 2033

Figure 4: Global Market Value (US$ Million) by End-Use, 2023 to 2033

Figure 5: Global Market Value (US$ Million) by Region, 2023 to 2033

Figure 6: Global Market Value (US$ Million) Analysis by Region, 2018 to 2033

Figure 7: Global Market Volume (Liters) Analysis by Region, 2018 to 2033

Figure 8: Global Market Value Share (%) and BPS Analysis by Region, 2023 to 2033

Figure 9: Global Market Y-o-Y Growth (%) Projections by Region, 2023 to 2033

Figure 10: Global Market Value (US$ Million) Analysis by Nature, 2018 to 2033

Figure 11: Global Market Volume (Liters) Analysis by Nature, 2018 to 2033

Figure 12: Global Market Value Share (%) and BPS Analysis by Nature, 2023 to 2033

Figure 13: Global Market Y-o-Y Growth (%) Projections by Nature, 2023 to 2033

Figure 14: Global Market Value (US$ Million) Analysis by Flavor, 2018 to 2033

Figure 15: Global Market Volume (Liters) Analysis by Flavor, 2018 to 2033

Figure 16: Global Market Value Share (%) and BPS Analysis by Flavor, 2023 to 2033

Figure 17: Global Market Y-o-Y Growth (%) Projections by Flavor, 2023 to 2033

Figure 18: Global Market Value (US$ Million) Analysis by Sales Channel, 2018 to 2033

Figure 19: Global Market Volume (Liters) Analysis by Sales Channel, 2018 to 2033

Figure 20: Global Market Value Share (%) and BPS Analysis by Sales Channel, 2023 to 2033

Figure 21: Global Market Y-o-Y Growth (%) Projections by Sales Channel, 2023 to 2033

Figure 22: Global Market Value (US$ Million) Analysis by End-Use, 2018 to 2033

Figure 23: Global Market Volume (Liters) Analysis by End-Use, 2018 to 2033

Figure 24: Global Market Value Share (%) and BPS Analysis by End-Use, 2023 to 2033

Figure 25: Global Market Y-o-Y Growth (%) Projections by End-Use, 2023 to 2033

Figure 26: Global Market Attractiveness by Nature, 2023 to 2033

Figure 27: Global Market Attractiveness by Flavor, 2023 to 2033

Figure 28: Global Market Attractiveness by Sales Channel, 2023 to 2033

Figure 29: Global Market Attractiveness by End-Use, 2023 to 2033

Figure 30: Global Market Attractiveness by Region, 2023 to 2033

Figure 31: North America Market Value (US$ Million) by Nature, 2023 to 2033

Figure 32: North America Market Value (US$ Million) by Flavor, 2023 to 2033

Figure 33: North America Market Value (US$ Million) by Sales Channel, 2023 to 2033

Figure 34: North America Market Value (US$ Million) by End-Use, 2023 to 2033

Figure 35: North America Market Value (US$ Million) by Country, 2023 to 2033

Figure 36: North America Market Value (US$ Million) Analysis by Country, 2018 to 2033

Figure 37: North America Market Volume (Liters) Analysis by Country, 2018 to 2033

Figure 38: North America Market Value Share (%) and BPS Analysis by Country, 2023 to 2033

Figure 39: North America Market Y-o-Y Growth (%) Projections by Country, 2023 to 2033

Figure 40: North America Market Value (US$ Million) Analysis by Nature, 2018 to 2033

Figure 41: North America Market Volume (Liters) Analysis by Nature, 2018 to 2033

Figure 42: North America Market Value Share (%) and BPS Analysis by Nature, 2023 to 2033

Figure 43: North America Market Y-o-Y Growth (%) Projections by Nature, 2023 to 2033

Figure 44: North America Market Value (US$ Million) Analysis by Flavor, 2018 to 2033

Figure 45: North America Market Volume (Liters) Analysis by Flavor, 2018 to 2033

Figure 46: North America Market Value Share (%) and BPS Analysis by Flavor, 2023 to 2033

Figure 47: North America Market Y-o-Y Growth (%) Projections by Flavor, 2023 to 2033

Figure 48: North America Market Value (US$ Million) Analysis by Sales Channel, 2018 to 2033

Figure 49: North America Market Volume (Liters) Analysis by Sales Channel, 2018 to 2033

Figure 50: North America Market Value Share (%) and BPS Analysis by Sales Channel, 2023 to 2033

Figure 51: North America Market Y-o-Y Growth (%) Projections by Sales Channel, 2023 to 2033

Figure 52: North America Market Value (US$ Million) Analysis by End-Use, 2018 to 2033

Figure 53: North America Market Volume (Liters) Analysis by End-Use, 2018 to 2033

Figure 54: North America Market Value Share (%) and BPS Analysis by End-Use, 2023 to 2033

Figure 55: North America Market Y-o-Y Growth (%) Projections by End-Use, 2023 to 2033

Figure 56: North America Market Attractiveness by Nature, 2023 to 2033

Figure 57: North America Market Attractiveness by Flavor, 2023 to 2033

Figure 58: North America Market Attractiveness by Sales Channel, 2023 to 2033

Figure 59: North America Market Attractiveness by End-Use, 2023 to 2033

Figure 60: North America Market Attractiveness by Country, 2023 to 2033

Figure 61: Latin America Market Value (US$ Million) by Nature, 2023 to 2033

Figure 62: Latin America Market Value (US$ Million) by Flavor, 2023 to 2033

Figure 63: Latin America Market Value (US$ Million) by Sales Channel, 2023 to 2033

Figure 64: Latin America Market Value (US$ Million) by End-Use, 2023 to 2033

Figure 65: Latin America Market Value (US$ Million) by Country, 2023 to 2033

Figure 66: Latin America Market Value (US$ Million) Analysis by Country, 2018 to 2033

Figure 67: Latin America Market Volume (Liters) Analysis by Country, 2018 to 2033

Figure 68: Latin America Market Value Share (%) and BPS Analysis by Country, 2023 to 2033

Figure 69: Latin America Market Y-o-Y Growth (%) Projections by Country, 2023 to 2033

Figure 70: Latin America Market Value (US$ Million) Analysis by Nature, 2018 to 2033

Figure 71: Latin America Market Volume (Liters) Analysis by Nature, 2018 to 2033

Figure 72: Latin America Market Value Share (%) and BPS Analysis by Nature, 2023 to 2033

Figure 73: Latin America Market Y-o-Y Growth (%) Projections by Nature, 2023 to 2033

Figure 74: Latin America Market Value (US$ Million) Analysis by Flavor, 2018 to 2033

Figure 75: Latin America Market Volume (Liters) Analysis by Flavor, 2018 to 2033

Figure 76: Latin America Market Value Share (%) and BPS Analysis by Flavor, 2023 to 2033

Figure 77: Latin America Market Y-o-Y Growth (%) Projections by Flavor, 2023 to 2033

Figure 78: Latin America Market Value (US$ Million) Analysis by Sales Channel, 2018 to 2033

Figure 79: Latin America Market Volume (Liters) Analysis by Sales Channel, 2018 to 2033

Figure 80: Latin America Market Value Share (%) and BPS Analysis by Sales Channel, 2023 to 2033

Figure 81: Latin America Market Y-o-Y Growth (%) Projections by Sales Channel, 2023 to 2033

Figure 82: Latin America Market Value (US$ Million) Analysis by End-Use, 2018 to 2033

Figure 83: Latin America Market Volume (Liters) Analysis by End-Use, 2018 to 2033

Figure 84: Latin America Market Value Share (%) and BPS Analysis by End-Use, 2023 to 2033

Figure 85: Latin America Market Y-o-Y Growth (%) Projections by End-Use, 2023 to 2033

Figure 86: Latin America Market Attractiveness by Nature, 2023 to 2033

Figure 87: Latin America Market Attractiveness by Flavor, 2023 to 2033

Figure 88: Latin America Market Attractiveness by Sales Channel, 2023 to 2033

Figure 89: Latin America Market Attractiveness by End-Use, 2023 to 2033

Figure 90: Latin America Market Attractiveness by Country, 2023 to 2033

Figure 91: Western Europe Market Value (US$ Million) by Nature, 2023 to 2033

Figure 92: Western Europe Market Value (US$ Million) by Flavor, 2023 to 2033

Figure 93: Western Europe Market Value (US$ Million) by Sales Channel, 2023 to 2033

Figure 94: Western Europe Market Value (US$ Million) by End-Use, 2023 to 2033

Figure 95: Western Europe Market Value (US$ Million) by Country, 2023 to 2033

Figure 96: Western Europe Market Value (US$ Million) Analysis by Country, 2018 to 2033

Figure 97: Western Europe Market Volume (Liters) Analysis by Country, 2018 to 2033

Figure 98: Western Europe Market Value Share (%) and BPS Analysis by Country, 2023 to 2033

Figure 99: Western Europe Market Y-o-Y Growth (%) Projections by Country, 2023 to 2033

Figure 100: Western Europe Market Value (US$ Million) Analysis by Nature, 2018 to 2033

Figure 101: Western Europe Market Volume (Liters) Analysis by Nature, 2018 to 2033

Figure 102: Western Europe Market Value Share (%) and BPS Analysis by Nature, 2023 to 2033

Figure 103: Western Europe Market Y-o-Y Growth (%) Projections by Nature, 2023 to 2033

Figure 104: Western Europe Market Value (US$ Million) Analysis by Flavor, 2018 to 2033

Figure 105: Western Europe Market Volume (Liters) Analysis by Flavor, 2018 to 2033

Figure 106: Western Europe Market Value Share (%) and BPS Analysis by Flavor, 2023 to 2033

Figure 107: Western Europe Market Y-o-Y Growth (%) Projections by Flavor, 2023 to 2033

Figure 108: Western Europe Market Value (US$ Million) Analysis by Sales Channel, 2018 to 2033

Figure 109: Western Europe Market Volume (Liters) Analysis by Sales Channel, 2018 to 2033

Figure 110: Western Europe Market Value Share (%) and BPS Analysis by Sales Channel, 2023 to 2033

Figure 111: Western Europe Market Y-o-Y Growth (%) Projections by Sales Channel, 2023 to 2033

Figure 112: Western Europe Market Value (US$ Million) Analysis by End-Use, 2018 to 2033

Figure 113: Western Europe Market Volume (Liters) Analysis by End-Use, 2018 to 2033

Figure 114: Western Europe Market Value Share (%) and BPS Analysis by End-Use, 2023 to 2033

Figure 115: Western Europe Market Y-o-Y Growth (%) Projections by End-Use, 2023 to 2033

Figure 116: Western Europe Market Attractiveness by Nature, 2023 to 2033

Figure 117: Western Europe Market Attractiveness by Flavor, 2023 to 2033

Figure 118: Western Europe Market Attractiveness by Sales Channel, 2023 to 2033

Figure 119: Western Europe Market Attractiveness by End-Use, 2023 to 2033

Figure 120: Western Europe Market Attractiveness by Country, 2023 to 2033

Figure 121: Eastern Europe Market Value (US$ Million) by Nature, 2023 to 2033

Figure 122: Eastern Europe Market Value (US$ Million) by Flavor, 2023 to 2033

Figure 123: Eastern Europe Market Value (US$ Million) by Sales Channel, 2023 to 2033

Figure 124: Eastern Europe Market Value (US$ Million) by End-Use, 2023 to 2033

Figure 125: Eastern Europe Market Value (US$ Million) by Country, 2023 to 2033

Figure 126: Eastern Europe Market Value (US$ Million) Analysis by Country, 2018 to 2033

Figure 127: Eastern Europe Market Volume (Liters) Analysis by Country, 2018 to 2033

Figure 128: Eastern Europe Market Value Share (%) and BPS Analysis by Country, 2023 to 2033

Figure 129: Eastern Europe Market Y-o-Y Growth (%) Projections by Country, 2023 to 2033

Figure 130: Eastern Europe Market Value (US$ Million) Analysis by Nature, 2018 to 2033

Figure 131: Eastern Europe Market Volume (Liters) Analysis by Nature, 2018 to 2033

Figure 132: Eastern Europe Market Value Share (%) and BPS Analysis by Nature, 2023 to 2033

Figure 133: Eastern Europe Market Y-o-Y Growth (%) Projections by Nature, 2023 to 2033

Figure 134: Eastern Europe Market Value (US$ Million) Analysis by Flavor, 2018 to 2033

Figure 135: Eastern Europe Market Volume (Liters) Analysis by Flavor, 2018 to 2033

Figure 136: Eastern Europe Market Value Share (%) and BPS Analysis by Flavor, 2023 to 2033

Figure 137: Eastern Europe Market Y-o-Y Growth (%) Projections by Flavor, 2023 to 2033

Figure 138: Eastern Europe Market Value (US$ Million) Analysis by Sales Channel, 2018 to 2033

Figure 139: Eastern Europe Market Volume (Liters) Analysis by Sales Channel, 2018 to 2033

Figure 140: Eastern Europe Market Value Share (%) and BPS Analysis by Sales Channel, 2023 to 2033

Figure 141: Eastern Europe Market Y-o-Y Growth (%) Projections by Sales Channel, 2023 to 2033

Figure 142: Eastern Europe Market Value (US$ Million) Analysis by End-Use, 2018 to 2033

Figure 143: Eastern Europe Market Volume (Liters) Analysis by End-Use, 2018 to 2033

Figure 144: Eastern Europe Market Value Share (%) and BPS Analysis by End-Use, 2023 to 2033

Figure 145: Eastern Europe Market Y-o-Y Growth (%) Projections by End-Use, 2023 to 2033

Figure 146: Eastern Europe Market Attractiveness by Nature, 2023 to 2033

Figure 147: Eastern Europe Market Attractiveness by Flavor, 2023 to 2033

Figure 148: Eastern Europe Market Attractiveness by Sales Channel, 2023 to 2033

Figure 149: Eastern Europe Market Attractiveness by End-Use, 2023 to 2033

Figure 150: Eastern Europe Market Attractiveness by Country, 2023 to 2033

Figure 151: South Asia and Pacific Market Value (US$ Million) by Nature, 2023 to 2033

Figure 152: South Asia and Pacific Market Value (US$ Million) by Flavor, 2023 to 2033

Figure 153: South Asia and Pacific Market Value (US$ Million) by Sales Channel, 2023 to 2033

Figure 154: South Asia and Pacific Market Value (US$ Million) by End-Use, 2023 to 2033

Figure 155: South Asia and Pacific Market Value (US$ Million) by Country, 2023 to 2033

Figure 156: South Asia and Pacific Market Value (US$ Million) Analysis by Country, 2018 to 2033

Figure 157: South Asia and Pacific Market Volume (Liters) Analysis by Country, 2018 to 2033

Figure 158: South Asia and Pacific Market Value Share (%) and BPS Analysis by Country, 2023 to 2033

Figure 159: South Asia and Pacific Market Y-o-Y Growth (%) Projections by Country, 2023 to 2033

Figure 160: South Asia and Pacific Market Value (US$ Million) Analysis by Nature, 2018 to 2033

Figure 161: South Asia and Pacific Market Volume (Liters) Analysis by Nature, 2018 to 2033

Figure 162: South Asia and Pacific Market Value Share (%) and BPS Analysis by Nature, 2023 to 2033

Figure 163: South Asia and Pacific Market Y-o-Y Growth (%) Projections by Nature, 2023 to 2033

Figure 164: South Asia and Pacific Market Value (US$ Million) Analysis by Flavor, 2018 to 2033

Figure 165: South Asia and Pacific Market Volume (Liters) Analysis by Flavor, 2018 to 2033

Figure 166: South Asia and Pacific Market Value Share (%) and BPS Analysis by Flavor, 2023 to 2033

Figure 167: South Asia and Pacific Market Y-o-Y Growth (%) Projections by Flavor, 2023 to 2033

Figure 168: South Asia and Pacific Market Value (US$ Million) Analysis by Sales Channel, 2018 to 2033

Figure 169: South Asia and Pacific Market Volume (Liters) Analysis by Sales Channel, 2018 to 2033

Figure 170: South Asia and Pacific Market Value Share (%) and BPS Analysis by Sales Channel, 2023 to 2033

Figure 171: South Asia and Pacific Market Y-o-Y Growth (%) Projections by Sales Channel, 2023 to 2033

Figure 172: South Asia and Pacific Market Value (US$ Million) Analysis by End-Use, 2018 to 2033

Figure 173: South Asia and Pacific Market Volume (Liters) Analysis by End-Use, 2018 to 2033

Figure 174: South Asia and Pacific Market Value Share (%) and BPS Analysis by End-Use, 2023 to 2033

Figure 175: South Asia and Pacific Market Y-o-Y Growth (%) Projections by End-Use, 2023 to 2033

Figure 176: South Asia and Pacific Market Attractiveness by Nature, 2023 to 2033

Figure 177: South Asia and Pacific Market Attractiveness by Flavor, 2023 to 2033

Figure 178: South Asia and Pacific Market Attractiveness by Sales Channel, 2023 to 2033

Figure 179: South Asia and Pacific Market Attractiveness by End-Use, 2023 to 2033

Figure 180: South Asia and Pacific Market Attractiveness by Country, 2023 to 2033

Figure 181: East Asia Market Value (US$ Million) by Nature, 2023 to 2033

Figure 182: East Asia Market Value (US$ Million) by Flavor, 2023 to 2033

Figure 183: East Asia Market Value (US$ Million) by Sales Channel, 2023 to 2033

Figure 184: East Asia Market Value (US$ Million) by End-Use, 2023 to 2033

Figure 185: East Asia Market Value (US$ Million) by Country, 2023 to 2033

Figure 186: East Asia Market Value (US$ Million) Analysis by Country, 2018 to 2033

Figure 187: East Asia Market Volume (Liters) Analysis by Country, 2018 to 2033

Figure 188: East Asia Market Value Share (%) and BPS Analysis by Country, 2023 to 2033

Figure 189: East Asia Market Y-o-Y Growth (%) Projections by Country, 2023 to 2033

Figure 190: East Asia Market Value (US$ Million) Analysis by Nature, 2018 to 2033

Figure 191: East Asia Market Volume (Liters) Analysis by Nature, 2018 to 2033

Figure 192: East Asia Market Value Share (%) and BPS Analysis by Nature, 2023 to 2033

Figure 193: East Asia Market Y-o-Y Growth (%) Projections by Nature, 2023 to 2033

Figure 194: East Asia Market Value (US$ Million) Analysis by Flavor, 2018 to 2033

Figure 195: East Asia Market Volume (Liters) Analysis by Flavor, 2018 to 2033

Figure 196: East Asia Market Value Share (%) and BPS Analysis by Flavor, 2023 to 2033

Figure 197: East Asia Market Y-o-Y Growth (%) Projections by Flavor, 2023 to 2033

Figure 198: East Asia Market Value (US$ Million) Analysis by Sales Channel, 2018 to 2033

Figure 199: East Asia Market Volume (Liters) Analysis by Sales Channel, 2018 to 2033

Figure 200: East Asia Market Value Share (%) and BPS Analysis by Sales Channel, 2023 to 2033

Figure 201: East Asia Market Y-o-Y Growth (%) Projections by Sales Channel, 2023 to 2033

Figure 202: East Asia Market Value (US$ Million) Analysis by End-Use, 2018 to 2033

Figure 203: East Asia Market Volume (Liters) Analysis by End-Use, 2018 to 2033

Figure 204: East Asia Market Value Share (%) and BPS Analysis by End-Use, 2023 to 2033

Figure 205: East Asia Market Y-o-Y Growth (%) Projections by End-Use, 2023 to 2033

Figure 206: East Asia Market Attractiveness by Nature, 2023 to 2033

Figure 207: East Asia Market Attractiveness by Flavor, 2023 to 2033

Figure 208: East Asia Market Attractiveness by Sales Channel, 2023 to 2033

Figure 209: East Asia Market Attractiveness by End-Use, 2023 to 2033

Figure 210: East Asia Market Attractiveness by Country, 2023 to 2033

Figure 211: Middle East and Africa Market Value (US$ Million) by Nature, 2023 to 2033

Figure 212: Middle East and Africa Market Value (US$ Million) by Flavor, 2023 to 2033

Figure 213: Middle East and Africa Market Value (US$ Million) by Sales Channel, 2023 to 2033

Figure 214: Middle East and Africa Market Value (US$ Million) by End-Use, 2023 to 2033

Figure 215: Middle East and Africa Market Value (US$ Million) by Country, 2023 to 2033

Figure 216: Middle East and Africa Market Value (US$ Million) Analysis by Country, 2018 to 2033

Figure 217: Middle East and Africa Market Volume (Liters) Analysis by Country, 2018 to 2033

Figure 218: Middle East and Africa Market Value Share (%) and BPS Analysis by Country, 2023 to 2033

Figure 219: Middle East and Africa Market Y-o-Y Growth (%) Projections by Country, 2023 to 2033

Figure 220: Middle East and Africa Market Value (US$ Million) Analysis by Nature, 2018 to 2033

Figure 221: Middle East and Africa Market Volume (Liters) Analysis by Nature, 2018 to 2033

Figure 222: Middle East and Africa Market Value Share (%) and BPS Analysis by Nature, 2023 to 2033

Figure 223: Middle East and Africa Market Y-o-Y Growth (%) Projections by Nature, 2023 to 2033

Figure 224: Middle East and Africa Market Value (US$ Million) Analysis by Flavor, 2018 to 2033

Figure 225: Middle East and Africa Market Volume (Liters) Analysis by Flavor, 2018 to 2033

Figure 226: Middle East and Africa Market Value Share (%) and BPS Analysis by Flavor, 2023 to 2033

Figure 227: Middle East and Africa Market Y-o-Y Growth (%) Projections by Flavor, 2023 to 2033

Figure 228: Middle East and Africa Market Value (US$ Million) Analysis by Sales Channel, 2018 to 2033

Figure 229: Middle East and Africa Market Volume (Liters) Analysis by Sales Channel, 2018 to 2033

Figure 230: Middle East and Africa Market Value Share (%) and BPS Analysis by Sales Channel, 2023 to 2033

Figure 231: Middle East and Africa Market Y-o-Y Growth (%) Projections by Sales Channel, 2023 to 2033

Figure 232: Middle East and Africa Market Value (US$ Million) Analysis by End-Use, 2018 to 2033

Figure 233: Middle East and Africa Market Volume (Liters) Analysis by End-Use, 2018 to 2033

Figure 234: Middle East and Africa Market Value Share (%) and BPS Analysis by End-Use, 2023 to 2033

Figure 235: Middle East and Africa Market Y-o-Y Growth (%) Projections by End-Use, 2023 to 2033

Figure 236: Middle East and Africa Market Attractiveness by Nature, 2023 to 2033

Figure 237: Middle East and Africa Market Attractiveness by Flavor, 2023 to 2033

Figure 238: Middle East and Africa Market Attractiveness by Sales Channel, 2023 to 2033

Figure 239: Middle East and Africa Market Attractiveness by End-Use, 2023 to 2033

Figure 240: Middle East and Africa Market Attractiveness by Country, 2023 to 2033

Frequently Asked Questions

What was the overall size of the in Banana Milk Market 2025?

The overall market size for Banana Milk Market was USD 53.42 Million in 2025.

How big the Bio is based Banana Milk Market expected in 2035?

The Banana Milk Market expected to reach USD 87.86 Million in 2035.

What will drive the demand for Banana Milk Market during the forecast period?

The demand for the banana milk market will grow due to increasing consumer preference for plant-based dairy alternatives, rising awareness of health and wellness benefits, growing lactose-intolerant population, and expanding product innovation in flavoured and nutrient-rich beverage options.

List the top 5 countries contributing Banana Milk Market?

The top 5 countries which drives the development of Banana Milk Market are USA, UK, Europe Union, Japan and South Korea.

Which segment in type is expected to lead in Banana Milk Market?

Milk & Milk Beverages lead market growth to command significant share over the assessment period.

Explore Similar Insights

Future Market Insights

Banana Milk Market