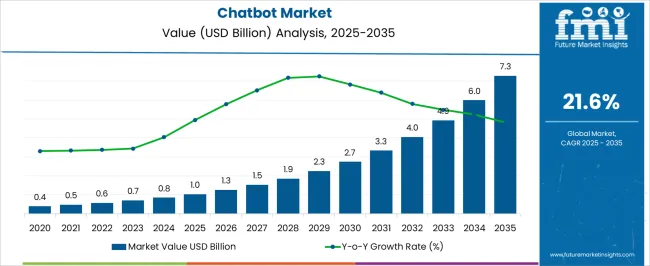
The Chatbot Market is estimated to be valued at USD 1.0 billion in 2025 and is projected to reach USD 7.3 billion by 2035, registering a compound annual growth rate (CAGR) of 21.6% over the forecast period.

| Metric | Value |
|---|---|
| Chatbot Market Estimated Value in (2025 E) | USD 1.0 billion |
| Chatbot Market Forecast Value in (2035 F) | USD 7.3 billion |
| Forecast CAGR (2025 to 2035) | 21.6% |
The chatbot market is expanding rapidly due to the increasing adoption of AI driven conversational tools across industries, rising demand for automated customer engagement, and the need to reduce operational costs. Advancements in natural language processing, multilingual support, and integration with enterprise applications are accelerating deployment across both B2B and B2C environments.
Growing reliance on digital channels and 24/7 service availability is further reinforcing adoption. Enterprises are leveraging chatbots not only for customer support but also for lead generation, internal process automation, and personalized user experiences.
Regulatory focus on data privacy and the growing importance of secure communication solutions are shaping product development. The outlook remains strong as investments in generative AI and voice enabled assistants are expected to expand market opportunities and enhance conversational intelligence, enabling broader applications across multiple verticals.

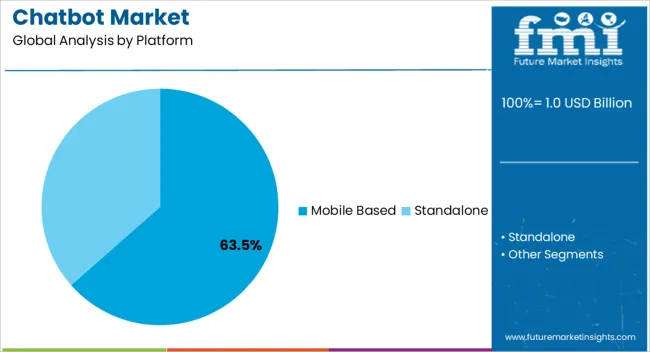
The mobile based platform segment is projected to represent 63.50% of total revenue by 2025 within the platform category, establishing itself as the leading segment. This is driven by the widespread penetration of smartphones, increased mobile internet usage, and consumer preference for on the go services.
Mobile based chatbots provide accessibility, convenience, and instant connectivity, making them highly effective for industries focused on customer facing interactions. Integration with mobile applications, messaging platforms, and voice assistants has strengthened adoption.
Businesses have also benefited from the ability of mobile chatbots to deliver personalized, location based, and real time responses, enhancing overall user engagement. These advantages have secured the dominance of mobile based chatbots in the platform category.

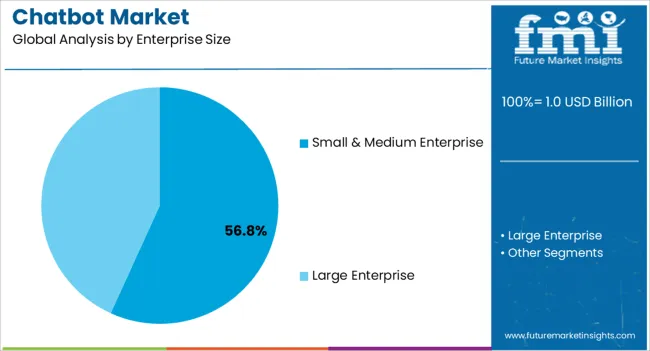
The small and medium enterprise segment is expected to account for 56.80% of the overall market revenue by 2025 under the enterprise size category, positioning it as the largest segment. This leadership is attributed to the rising need among SMEs to enhance customer service efficiency while managing limited resources.
Chatbots offer cost effective automation, allowing smaller enterprises to scale customer interactions without expanding workforce size. The growing adoption of cloud based chatbot platforms has lowered deployment barriers and reduced infrastructure costs, making them highly accessible for SMEs.
Additionally, the competitive advantage gained through improved customer experience and faster service delivery has encouraged SMEs to adopt chatbot solutions extensively. This has reinforced the segment’s dominant share within the enterprise size category.
Chatbots were mostly rule-based or simple FAQ-oriented systems from 2020 to 2025. They supplied basic information and answered clear questions. However, limitations in their verbal ability were clear, as they struggled with sophisticated relationships and grasping context. Nonetheless, corporations recognized the value of chatbots and invested in their development and deployment.
The chatbot industry is predicted to grow significantly between 2025 and 2035. Chatbots are projected to become increasingly intelligent, flexible, and capable of handling complex discussions as AI technology advances. They may use powerful NLP algorithms, deep learning models, and contextual awareness to create more personalized and human-like experiences.
Chatbots are expected to grow beyond typical customer support applications. They may be critical in virtual assistants, healthcare diagnostics, language translation, and even as companions in a variety of industries. Chatbots may become more smoothly integrated with other developing technologies such as augmented reality (AR) and virtual reality (VR) as technology advances, providing greater user experiences.
Ethical and privacy problems in chatbot usage are predicted to gain significance. Regulations and guidelines may be put in place to enable ethical and transparent chatbot deployments, as well as to protect user data and preserve confidentiality.
Chatbots are becoming more significant in providing round-the-clock assistance to clients. Allowing various industries to streamline and improve the customer experience at every process level.
Its application in various businesses has changed its priority to quickly handling client inquiries, which leads to an expansion in demand for chatbots. This includes finance, telecommunications, retail and eCommerce, travel and hospitality, and government.
Quickly responding to customer inquiries has become a critical component of business success. As a result, businesses view the chatbot as a powerful conversational interface for effectively engaging customers and creating a dynamic and rich user experience environment.
When users talk in the future, the new voice prints generated can be compared to their previous voice prints to verify their identity. Its disadvantage is that voiceprints are more generic and hence cannot be validated with the same level of accuracy as voiceprints made in a single run. Hampering the growth of the chatbot industry.
The second method is to record a single phrase or word as a voiceprint and save it for each voiceprint. Third parties, on the other hand, can record authentication attempts and replay them to get access using this method.
These are two existing voice authentication techniques that require additional characteristics to be useful as a stand-alone means of user authentication. However, as SMEs become more aware of chatbot solutions, the usage of chatbot solutions is projected to increase in the future years.
In the next few years, instead of general intelligence, corporations may concentrate on integrating reinforcement learning technologies. Together with the growing requirement to give personalized experiences, these initiatives are projected to drive demand for self-learning chatbots.
These programs and others aimed at developing advanced chatbots that can intelligently respond to user questions are still in the research phase. Self-learning chatbots with data-driven behavior are powered by NLP technology and self-learning capabilities and can provide more human-like and natural communication. They also learn from their own mistakes.
For example, Facebook data scientists and Stanford University academics have created cooperation to develop self-learning chatbots, focusing on the integration of reinforcement learning technology rather than general intelligence. To avoid circumstances in which technology fails.
Lack of awareness and problems associated with management change may have an impact on chatbot market growth to some extent. Issues with successful implementation and a lack of understanding of the benefits given by AI-powered chatbot solutions may hinder their acceptance in developing regions such as Latin America and Africa. Though chatbot solutions are becoming more popular in a variety of industries.
| Segment | Platform |
|---|---|
| Segment Name | Mobile Based |
| Segment Share | 56.7% |
| Segment | Enterprises Size |
|---|---|
| Segment Name | Large Enterprises |
| Segment Share | 61.5% |
By platform, Mobile is the leading segment with an anticipated CAGR during the forecast period. The mobile category is leading, as various mobile applications that use AI for chatbots or image analysis are becoming increasingly popular among mobile users. It contributes to a larger market share for chatbots, with an expected CAGR of 24.1% during the forecast period.
Consider Babylon, a popular AI-powered mobile app that allows users to employ an intelligent chatbot. To help and relate symptoms while also connecting with a suitable doctor via video chat.
Large enterprises are likely to boost their demand for chatbots during the forecast period. Large enterprises are rapidly adopting chatbot solutions and services, and this trend is expected to continue during the forecast period. As a result, large enterprises are expected to have a prodigious CAGR of 21%.
To boost their total revenue and efficiency, large enterprises are heavily investing in modern technologies. The rising demand for chatbots in the retail and eCommerce industries can be linked to various benefits of chatbots. Such as continuous customer service and decreased marketing expenditures, which boost market revenue.
| Countries | Market Share |
|---|---|
| North America | 29.3% |
| Europe | 24.3% |
During the forecast period, North America is expected to have a leading market size of USD 2.8 billion. During the projected period, Asia Pacific is anticipated to grow expeditiously. The countries in the Asia Pacific are technologically advanced and provide promising investment and income opportunities.
The expansion of the chatbot market in the Asia Pacific is likely to be aided by factors such as flexible economic conditions and government policies. As it can promote industrialization and globalization, and digitization. Numerous startups in the Asia Pacific area are investing in chatbots and machine learning technology.
Small and mid-sized organizations are rapidly incorporating chatbots into their customer service procedures and resulting in perfect performance. Moreover, the ability to handle a high consumer queue and improved client engagement tactics.
The chatbot market is likely to increase further in the region as the top economies, including China and India. Quickly build their information and communications technology infrastructures. The region's large population and rapid smartphone penetration are creating a high-potential consumer pool for chatbots. Particularly for applications like personal help.
Chatbot adoption is increasing steadily in Latin America. The region's key markets are Brazil, Mexico, and Argentina. Chatbots have been used extensively in the e-commerce industry, particularly for customer service and order processing. Language diversity and cultural nuances provide hurdles, but advances in language processing technologies are propelling the market growth.
Chatbot technologies are gaining popularity in the Middle East and Africa. Leading adopters include the United Arab Emirates, Saudi Arabia, and South Africa. Chatbots are used in industries such as banking, telecommunications, and healthcare to provide multilingual support and automate repetitive operations to improve client experiences.
| Countries | Market Share |
|---|---|
| United States | 20.4% |
| Germany | 10.1% |
| Japan | 8.2% |
| Australia | 2.9% |
| Countries | Market CAGR |
|---|---|
| China | 24.3% |
| India | 22.5% |
| United Kingdom | 23.2% |
Due to the enormous increase in competitors in the chatbot business, the industry is getting quite competitive. The chatbot industry is highly consolidated, with key firms employing techniques such as product innovation to stay ahead of the pack. As a result, many businesses are aggressively seeking out strategic mergers and acquisitions to expand their market dominance.
Continuous technical improvements promote competition in the chatbot business. Chatbots with advanced capabilities, such as improved natural language processing, sentiment analysis, machine learning algorithms, and context awareness, are being developed by companies. Gaining a competitive advantage also requires innovation in areas such as voice recognition, deep learning, and emotional intelligence.
The competition includes industry-specific chatbot solutions. Providers concentrate on producing chatbots that are targeted to the specific needs of various industries. Such as healthcare, banking, retail, hospitality, and customer service. Differentiating chatbot products need industry-specific expertise and capabilities.
Gaining market share and growing the client base are two aspects of competition. To raise awareness and attract clients, providers use marketing tactics such as targeted advertising, content marketing, and involvement in industry events. Strategic alliances with complementary technology providers or industry influencers can also help to increase market penetration.
Recent Advancements
The strategy framework of leading service providers is centered on bagging larger revenues to achieve greater profits. A few recent developments in the chatbot business are as follows:
The global chatbot market is estimated to be valued at USD 1.0 billion in 2025.
The market size for the chatbot market is projected to reach USD 7.3 billion by 2035.
The chatbot market is expected to grow at a 21.6% CAGR between 2025 and 2035.
The key product types in chatbot market are mobile based and standalone.
In terms of enterprise size, small & medium enterprise segment to command 56.8% share in the chatbot market in 2025.


Our Research Products

The "Full Research Suite" delivers actionable market intel, deep dives on markets or technologies, so clients act faster, cut risk, and unlock growth.

The Leaderboard benchmarks and ranks top vendors, classifying them as Established Leaders, Leading Challengers, or Disruptors & Challengers.

Locates where complements amplify value and substitutes erode it, forecasting net impact by horizon

We deliver granular, decision-grade intel: market sizing, 5-year forecasts, pricing, adoption, usage, revenue, and operational KPIs—plus competitor tracking, regulation, and value chains—across 60 countries broadly.

Spot the shifts before they hit your P&L. We track inflection points, adoption curves, pricing moves, and ecosystem plays to show where demand is heading, why it is changing, and what to do next across high-growth markets and disruptive tech

Real-time reads of user behavior. We track shifting priorities, perceptions of today’s and next-gen services, and provider experience, then pace how fast tech moves from trial to adoption, blending buyer, consumer, and channel inputs with social signals (#WhySwitch, #UX).

Partner with our analyst team to build a custom report designed around your business priorities. From analysing market trends to assessing competitors or crafting bespoke datasets, we tailor insights to your needs.
Supplier Intelligence
Discovery & Profiling
Capacity & Footprint
Performance & Risk
Compliance & Governance
Commercial Readiness
Who Supplies Whom
Scorecards & Shortlists
Playbooks & Docs
Category Intelligence
Definition & Scope
Demand & Use Cases
Cost Drivers
Market Structure
Supply Chain Map
Trade & Policy
Operating Norms
Deliverables
Buyer Intelligence
Account Basics
Spend & Scope
Procurement Model
Vendor Requirements
Terms & Policies
Entry Strategy
Pain Points & Triggers
Outputs
Pricing Analysis
Benchmarks
Trends
Should-Cost
Indexation
Landed Cost
Commercial Terms
Deliverables
Brand Analysis
Positioning & Value Prop
Share & Presence
Customer Evidence
Go-to-Market
Digital & Reputation
Compliance & Trust
KPIs & Gaps
Outputs
Full Research Suite comprises of:
Market outlook & trends analysis
Interviews & case studies
Strategic recommendations
Vendor profiles & capabilities analysis
5-year forecasts
8 regions and 60+ country-level data splits
Market segment data splits
12 months of continuous data updates
DELIVERED AS:
PDF EXCEL ONLINE
AI-Driven Chatbot Security – Protecting Digital Interactions
Healthcare Chatbot Market - Growth Trends & Forecast 2025 to 2035

Thank you!
You will receive an email from our Business Development Manager. Please be sure to check your SPAM/JUNK folder too.
Chat With
MaRIA