The compost turning machine market is expected to grow from USD 134.1 million in 2025 to USD 182 million by 2035, representing substantial growth and demonstrating the accelerating adoption of advanced compost processing technology and waste management optimization across municipal facilities, agricultural operations, and commercial composting sectors.
The first half of the decade (2025-2030) will see the market increase from USD 134.1 million to approximately USD 155.8 million, adding USD 21.7 million in value, which constitutes 52% of the total forecasted growth period. This phase will be characterized by the rapid adoption of drum compost turning systems, driven by increasing organic waste processing volumes and the growing need for environmental waste management solutions worldwide. Advanced composting capabilities and automated processing systems will become standard expectations rather than premium options.
The latter half (2030-2035) will witness sustained growth from USD 155.8 million to USD 182 million, representing an addition of USD 25.5 million or 48% of the decade's expansion. This period will be defined by mass market penetration of specialized composting technologies, integration with comprehensive waste management platforms, and seamless compatibility with existing municipal infrastructure. The market trajectory signals fundamental shifts in how waste management facilities approach compost processing optimization and operational efficiency management, with participants positioned to benefit from sustained demand across multiple machine types and capacity segments.
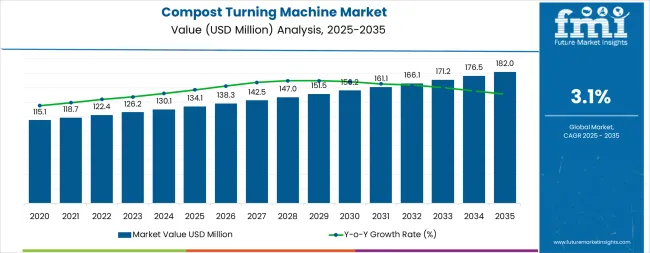
The compost turning machine market demonstrates distinct growth phases with varying market characteristics and competitive dynamics. Between 2025 and 2030, the market progresses through its technology adoption phase, expanding from USD 134.1 million to USD 155.8 million with steady annual increments averaging 3.1% growth. This period showcases the transition from basic composting equipment to advanced drum-based systems with enhanced processing capabilities and integrated monitoring systems becoming mainstream features.
The 2025-2030 phase adds USD 21.7 million to market value, representing 52% of total decade expansion. Market maturation factors include standardization of composting protocols, declining component costs for specialized equipment, and increasing waste management industry awareness of composting benefits reaching 94-97% processing effectiveness in organic waste applications. Competitive landscape evolution during this period features established machinery companies like Vermeer Corporation and Komptech GmbH expanding their compost processing portfolios while specialty manufacturers focus on advanced technology development and enhanced operational capabilities.
From 2030 to 2035, market dynamics shift toward advanced automation integration and global waste management expansion, with growth continuing from USD 155.8 million to USD 182 million, adding USD 25.5 million or 48% of total expansion. This phase transition centers on specialized processing systems, integration with automated waste management networks, and deployment across diverse municipal and commercial scenarios, becoming standard rather than specialized applications. The competitive environment matures with focus shifting from basic processing capability to comprehensive waste management optimization systems and integration with facility monitoring platforms.
| Metric | Value |
|---|---|
| Market Value (2025) | USD 134.1 million |
| Market Forecast (2035) | USD 182 million |
| Growth Rate | 3.1% CAGR |
| Leading Technology | Drum Compost Turning Machine Type |
| Primary Application | Below 500 Cubic Mtrs/h Segment |
The market demonstrates strong fundamentals with drum compost turning systems capturing a dominant share through advanced processing capabilities and waste management optimization. Small to medium capacity applications drive primary demand, supported by increasing municipal composting programs and organic waste management requirements. Geographic expansion remains concentrated in developed markets with established waste management infrastructure, while emerging economies show accelerating adoption rates driven by environmental initiatives and rising ecological standards.
Market expansion rests on three fundamental shifts driving adoption across the waste management and agricultural sectors. 1. Environmental mandates create compelling operational advantages through compost turning machines that provide immediate processing efficiency without infrastructure delays, enabling waste management facilities to meet ecological standards while maintaining operational productivity and reducing waste disposal costs. 2. Organic waste management modernization accelerates as processing facilities worldwide seek advanced systems that complement traditional waste disposal processes, enabling precise composting control and quality management that align with environmental regulations and operational efficiency standards. 3. Agricultural infrastructure enhancement drives adoption from composting facilities and agricultural operations requiring effective processing solutions that minimize decomposition time while maintaining operational productivity during organic waste management and soil enhancement operations.
However, growth faces headwinds from equipment cost challenges that vary across machinery suppliers regarding the pricing of specialized composting equipment and processing systems, which may limit adoption in budget-sensitive municipal environments. Technical limitations also persist regarding material handling capabilities and operational conditions that may reduce effectiveness in extreme weather or varying waste composition environments, which affect processing performance and output consistency.
The compost turning machine market represents a specialized yet critical waste management opportunity driven by expanding global environmental initiatives, municipal waste management modernization, and the need for superior processing effectiveness in organic waste management operations. As waste management facilities worldwide seek to achieve 94–97% processing effectiveness, reduce operational costs, and integrate advanced systems with automated monitoring platforms, compost turning machines are evolving from basic processing equipment to sophisticated waste management solutions that ensure operational efficiency and environmental compliance.
The convergence of environmental expansion, waste management infrastructure enhancement, and advanced processing technology development creates sustained demand drivers across multiple waste management segments. The market's growth trajectory from USD 134.1 million in 2025 to USD 182 million by 2035 at a 3.1% CAGR reflects fundamental shifts in waste management requirements and composting optimization.
Geographic expansion opportunities are particularly pronounced in North American markets, where the United States (3.4% growth rate) and developed regions lead through aggressive environmental programs and waste management infrastructure development. The dominance of drum compost turning systems (45% market share) and small capacity applications (50% share) provides clear strategic focus areas, while emerging commercial applications and specialized processing technologies open new revenue streams across diverse waste management markets.
Primary Classification: The market segments by machine type into Drum Compost Turning Machines, Elevating Face Compost Turning Machines, and Vacuum systems, representing the evolution from basic processing equipment to specialized waste management solutions for comprehensive composting optimization.
Secondary Classification: Capacity segmentation divides the market into Below 500 Cubic Mtrs/h, Between 500-1,000 Cubic Mtrs/h, and More than 1,000 Cubic Mtrs/h sectors, reflecting distinct requirements for processing performance, operational volume capacity, and facility efficiency standards.
Regional Classification: Geographic distribution covers North America, Latin America, Western Europe, Eastern Europe, East Asia, South Asia Pacific, and Middle East & Africa, with developed markets leading adoption while emerging economies show accelerating growth patterns driven by environmental expansion programs.
The segmentation structure reveals technology progression from standard composting equipment toward specialized processing systems with enhanced automation and monitoring capabilities, while capacity diversity spans from small municipal facilities to large-scale commercial composting operations requiring precise waste management solutions.
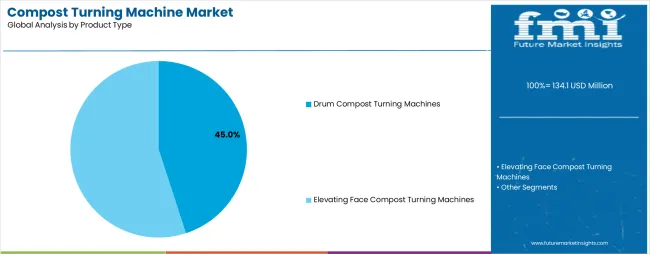
Market Position: Drum compost turning machine systems command the leading position in the compost turning machine market with approximately 45% market share through advanced processing features, including superior material handling, operational efficiency capability, and waste management optimization that enable composting facilities to achieve optimal organic waste processing across diverse municipal and commercial environments.
Value Drivers: The segment benefits from waste management facility preference for reliable processing systems that provide consistent material handling, reduced processing time, and operational efficiency optimization without requiring significant infrastructure modifications. Advanced design features enable automated control systems, processing consistency, and integration with existing composting equipment, where operational performance and processing reliability represent critical facility requirements.
Competitive Advantages: Drum Compost Turning Machine systems differentiate through proven operational stability, consistent processing characteristics, and integration with automated waste management systems that enhance facility effectiveness while maintaining optimal compost quality suitable for diverse agricultural and municipal applications.
Key market characteristics:
Elevating Face Compost Turning Machine systems maintain a significant market position in the Compost Turning Machine market due to their specialized processing properties and operational advantages. These systems appeal to facilities requiring specific material handling characteristics with competitive pricing for specialized composting applications. Market growth is driven by waste management expansion, emphasizing reliable processing solutions and operational efficiency through optimized system designs.
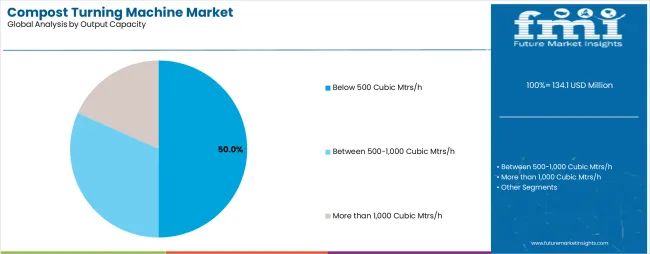
Market Context: Below 500 Cubic Mtrs/h applications dominate the Compost Turning Machine market with approximately 50% market share due to widespread adoption of small-scale processing systems and increasing focus on municipal composting optimization, operational efficiency management, and facility cost reduction applications that minimize processing complexity while maintaining waste management standards.
Appeal Factors: Small capacity facility operators prioritize system reliability, processing consistency, and integration with existing municipal infrastructure that enables coordinated waste management across multiple processing operations. The segment benefits from substantial municipal investment and modernization programs that emphasize the acquisition of processing systems for efficiency control and waste management applications.
Growth Drivers: Municipal expansion programs incorporate compost turning machines as standard equipment for waste processing operations, while small-scale facility growth increases demand for advanced processing capabilities that comply with environmental standards and minimize operational complexity.
Market Challenges: Varying municipal standards and waste processing technology differences may limit system standardization across different facilities or operational scenarios.
Application dynamics include:
Between 500-1,000 Cubic Mtrs/h applications capture approximately 30% market share through specialized processing requirements in commercial composting facilities, large municipal operations, and institutional waste management applications. These facilities demand robust processing systems capable of operating in high-volume environments while providing effective material handling and operational efficiency capabilities.
More than 1,000 Cubic Mtrs/h applications account for approximately 20% market share, including large-scale commercial composting, industrial waste processing, and specialized municipal applications requiring processing capabilities for facility optimization and operational control.
Growth Accelerators: Environmental initiatives drive primary adoption as compost turning machines provide processing efficiency capabilities that enable waste management facilities to meet ecological standards without excessive infrastructure investment, supporting municipal operations and environmental missions that require precise organic waste processing applications. Municipal infrastructure demand accelerates market expansion as processing facilities seek effective systems that minimize waste disposal costs while maintaining operational effectiveness during composting and material handling scenarios. Environmental technology spending increases worldwide, creating sustained demand for processing systems that complement traditional waste management and provide operational flexibility in complex ecological environments.
Growth Inhibitors: Equipment cost challenges vary across machinery suppliers regarding the pricing of specialized processing systems and composting equipment, which may limit operational flexibility and market penetration in regions with budget constraints or cost-sensitive municipal operations. Technical performance limitations persist regarding material handling capabilities and operational conditions that may reduce effectiveness in extreme weather, varying waste composition, or facility environment conditions, affecting processing performance and output consistency. Market fragmentation across multiple municipal specifications and waste management standards creates compatibility concerns between different equipment suppliers and existing facility infrastructure.
Market Evolution Patterns: Adoption accelerates in municipal and commercial waste management sectors where environmental requirements justify processing system costs, with geographic concentration in developed markets transitioning toward mainstream adoption in emerging economies driven by environmental initiatives and waste management development. Technology development focuses on enhanced processing capabilities, improved operational efficiency, and integration with automated monitoring systems that optimize material handling and facility effectiveness. The market could face disruption if alternative waste processing technologies or environmental regulations significantly limit the deployment of traditional composting equipment in municipal or commercial waste management applications.
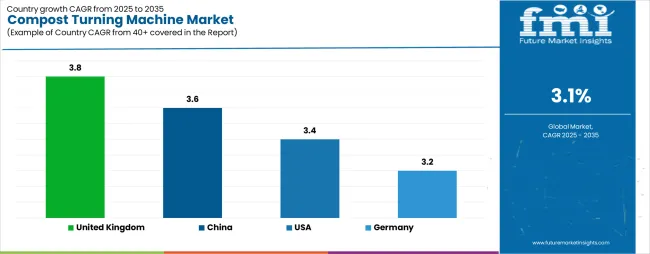
The Compost Turning Machine market demonstrates varied regional dynamics with Growth Leaders including United States (3.4% growth rate) and China (3.6% growth rate) driving expansion through environmental initiatives and waste management infrastructure development. Steady Performers encompass Germany (3.2% growth rate), United Kingdom (3.8% growth rate), and developed regions, benefiting from established environmental technology industries and advanced waste management adoption. Emerging Markets feature ASEAN (2.9% growth rate) and developing regions, where environmental initiatives and waste management modernization support consistent growth patterns.
| Country | Growth Rate (2025-2035) |
|---|---|
| China | 3.6% |
| United Kingdom | 3.8% |
| United States | 3.4% |
| Germany | 3.2% |
Regional synthesis reveals North American markets leading adoption through environmental expansion and waste management infrastructure development, while European countries maintain steady expansion supported by environmental technology advancement and municipal standardization requirements. Asian markets show moderate growth driven by waste management applications and environmental integration trends.
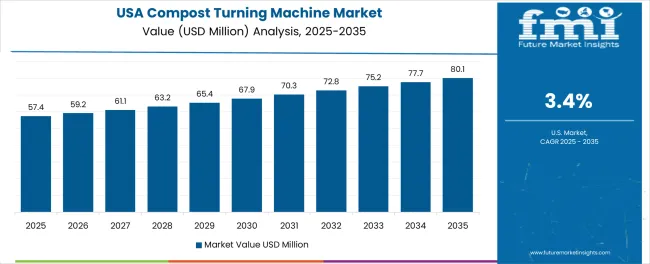
United States establishes market leadership through aggressive environmental programs and comprehensive waste management infrastructure development, integrating advanced compost turning machines as standard components in municipal composting and commercial waste processing installations. The country's 3.4% growth rate reflects government initiatives promoting environmental technology and domestic manufacturing capabilities that mandate the use of advanced processing systems in waste management and municipal composting facilities. Growth concentrates in major metropolitan centers, including California, Texas, and New York, where environmental technology development showcases integrated processing systems that appeal to municipal operators seeking advanced facility optimization capabilities and waste management efficiency applications.
American manufacturers are developing cost-effective processing solutions that combine domestic production advantages with advanced operational features, including automated control systems and enhanced processing efficiency capabilities. Distribution channels through municipal suppliers and environmental equipment distributors expand market access, while government support for environmental development supports adoption across diverse waste management and municipal composting segments.
Strategic Market Indicators:
In Beijing, Shanghai, and Guangzhou, municipal waste management facilities and commercial composting plants are implementing advanced compost turning machines as standard equipment for processing optimization and environmental compliance applications, driven by increasing government environmental investment and waste management modernization programs that emphasize the importance of composting capabilities. The market holds a 3.6% growth rate, supported by government environmental initiatives and municipal infrastructure development programs that promote advanced processing systems for waste management and municipal composting facilities. Chinese operators are adopting processing systems that provide consistent operational performance and environmental compliance features, particularly appealing in urban regions where processing efficiency and environmental standards represent critical operational requirements.
Market expansion benefits from growing environmental technology manufacturing capabilities and international technology transfer agreements that enable domestic production of advanced processing systems for waste management and municipal applications. Technology adoption follows patterns established in environmental equipment, where reliability and performance drive procurement decisions and operational deployment.
Market Intelligence Brief:
Germany's advanced environmental technology market demonstrates sophisticated compost turning machine deployment with documented operational effectiveness in waste management applications and municipal composting facilities through integration with existing processing systems and facility infrastructure. The country leverages engineering expertise in environmental technology and waste management systems integration to maintain a 3.2% growth rate. Industrial centers, including Baden-Württemberg, Bavaria, and North Rhine-Westphalia, showcase premium installations where processing systems integrate with comprehensive waste management platforms and facility management systems to optimize composting operations and processing effectiveness.
German manufacturers prioritize system reliability and EU compliance in processing equipment development, creating demand for premium systems with advanced features, including facility monitoring integration and automated control systems. The market benefits from established environmental technology infrastructure and a willingness to invest in advanced waste management technologies that provide long-term operational benefits and compliance with international environmental standards.
Market Intelligence Brief:
United Kingdom's market expansion benefits from diverse municipal demand, including waste management modernization in London and Manchester, commercial facility upgrades, and government environmental programs that increasingly incorporate processing solutions for environmental optimization applications. The country maintains a 3.8% growth rate, driven by rising environmental awareness and increasing recognition of composting technology benefits, including precise processing control and reduced waste disposal capabilities.
Market dynamics focus on cost-effective processing solutions that balance advanced operational performance with affordability considerations important to British municipal operators. Growing environmental industrialization creates sustained demand for modern processing systems in new facility infrastructure and municipal modernization projects.
Strategic Market Considerations:
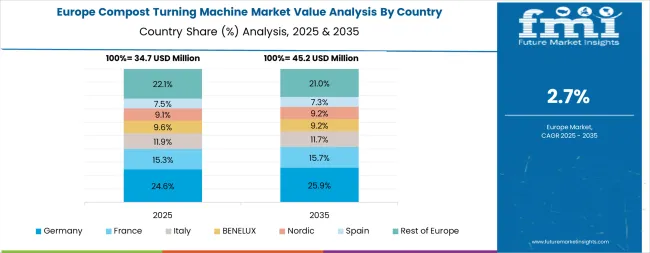
The European Compost Turning Machine market is projected to grow from USD 28.5 million in 2025 to USD 38.7 million by 2035, registering a CAGR of 3.1% over the forecast period. Germany is expected to maintain its leadership position with a 35.2% market share in 2025, supported by its advanced environmental technology infrastructure and major waste management centers.
France follows with a 22.8% share in 2025, driven by comprehensive municipal environmental programs and environmental technology development initiatives. The United Kingdom holds a 18.9% share through specialized municipal applications and environmental compliance requirements. Italy commands a 12.4% share, while Spain accounts for 10.7% in 2025. The Rest of Europe region is anticipated to gain momentum, expanding its collective share from 8.1% to 8.6% by 2035, attributed to increasing environmental adoption in Nordic countries and emerging waste management facilities implementing environmental modernization programs.
In Germany, the Compost Turning Machine market prioritizes drum processing systems, which capture the dominant share of waste management and municipal composting installations due to their advanced features, including precision material handling optimization and seamless integration with existing waste management infrastructure. German facility operators emphasize reliability, precision, and long-term operational excellence, creating demand for drum systems that provide consistent processing capabilities and adaptive operational performance based on facility requirements and environmental conditions. Other processing types maintain secondary positions primarily in specialized applications and commercial facilities where comprehensive processing functionality meets operational requirements without compromising facility efficiency.
Market Characteristics:
In France, the market structure favors international environmental companies, including Vermeer Corporation, Komptech GmbH, and Ecoverse Industries, which maintain dominant positions through comprehensive product portfolios and established municipal networks supporting both waste management and composting installations. These providers offer integrated solutions combining advanced processing systems with professional installation services and ongoing technical support that appeal to French municipal operators seeking reliable environmental processing systems. Local environmental contractors and system integrators capture a moderate market share by providing localized service capabilities and competitive pricing for standard municipal installations, while domestic manufacturers focus on specialized applications and cost-effective solutions tailored to French municipal characteristics.
Channel Insights:
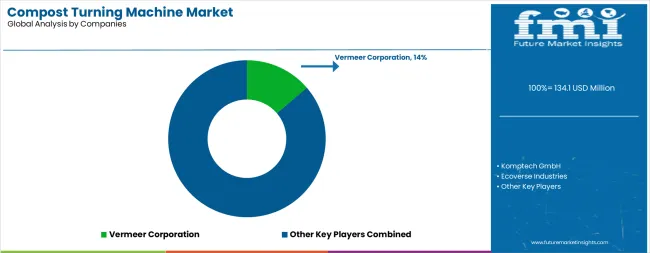
The compost turning machine market operates with moderate concentration, featuring approximately 15-20 meaningful participants, where leading companies control roughly 45-50% of the global market share through established waste management industry relationships and comprehensive processing portfolios. Competition emphasizes advanced processing capabilities, system reliability, and facility integration rather than price-based rivalry.
Market Leaders encompass Vermeer Corporation, Komptech GmbH, and Ecoverse Industries, which maintain competitive advantages through extensive environmental technology expertise, global waste management contractor networks, and comprehensive system integration capabilities that create customer switching costs and support premium pricing. These companies leverage decades of processing technology experience and ongoing research investments to develop advanced composting systems with precision operational control and facility monitoring features.
Technology Innovators include SCARAB International, Midwest Bio-Systems, and EYS Metal, which compete through specialized processing technology focus and innovative operational interfaces that appeal to facility operators seeking advanced composting capabilities and operational flexibility. These companies differentiate through rapid technology development cycles and specialized waste management application focus.
Regional Specialists feature companies like Brown Bear Corporation, ALLU Finland Oy, and EZ Machinery, which focus on specific geographic markets and specialized applications, including drum-based systems and integrated processing solutions. Market dynamics favor participants that combine reliable processing capabilities with advanced operational software, including precision composting control and automatic performance optimization capabilities. Competitive pressure intensifies as traditional waste management contractors expand into processing systems, while specialized environmental companies challenge established players through innovative processing solutions and cost-effective platforms targeting specialized municipal segments.
| Item | Value |
|---|---|
| Quantitative Units | USD 134.1 million |
| Product Type | Drum Compost Turning Machines, Elevating Face Compost Turning Machines |
| Output Capacity | Below 500 Cubic Mtrs/h, Between 500-1,000 Cubic Mtrs/h, More than 1,000 Cubic Mtrs/h |
| Regions Covered | North America, Latin America, Western Europe, Eastern Europe, East Asia, South Asia Pacific, Middle East & Africa |
| Countries Covered | United States, China, Germany, United Kingdom, ASEAN, and 25+ additional countries |
| Key Companies Profiled | Vermeer Corporation, Komptech GmbH, Ecoverse Industries, SCARAB International, Midwest Bio-Systems, Brown Bear Corporation, ALLU Finland Oy |
| Additional Attributes | Dollar sales by product type and capacity categories, regional adoption trends across North America, Western Europe, and East Asia, competitive landscape with environmental equipment manufacturers and municipal suppliers, facility operator preferences for precision processing control and system reliability, integration with waste management platforms and monitoring systems, innovations in composting technology and environmental durability, and development of automated processing solutions with enhanced performance and facility optimization capabilities. |
The global compost turning machine market is estimated to be valued at USD 134.1 million in 2025.
The market size for the compost turning machine market is projected to reach USD 182.0 million by 2035.
The compost turning machine market is expected to grow at a 3.1% CAGR between 2025 and 2035.
The key product types in compost turning machine market are drum compost turning machines and elevating face compost turning machines.
In terms of output capacity, below 500 cubic mtrs/h segment to command 50.0% share in the compost turning machine market in 2025.


Full Research Suite comprises of:
Market outlook & trends analysis
Interviews & case studies
Strategic recommendations
Vendor profiles & capabilities analysis
5-year forecasts
8 regions and 60+ country-level data splits
Market segment data splits
12 months of continuous data updates
DELIVERED AS:
PDF EXCEL ONLINE
Understanding Market Share Trends in Compost Turning Machine Industry
Compostable Foodservice Packaging Market Size and Share Forecast Outlook 2025 to 2035
Compostable Packaging Equipment Market Size and Share Forecast Outlook 2025 to 2035
Compostable Adhesives Market Analysis - Size and Share Forecast Outlook 2025 to 2035
Compostable Packaging Films Market Size and Share Forecast Outlook 2025 to 2035
Compostable Tableware Market Size and Share Forecast Outlook 2025 to 2035
Compostable Straws Market Growth - Demand & Forecast 2025 to 2035
Compostable Food Trays Market Size and Share Forecast Outlook 2025 to 2035
Compostable Plastic Packaging Material Market from 2025 to 2035
Compostable Toothbrush Market Growth & Forecast 2025 to 2035
Composting Equipment Market Growth - Trends, Demand & Innovations 2025 to 2035
Market Positioning & Share in the Compostable Food Trays Industry
Market Share Insights of Compostable Foodservice Packaging Providers
Leading Providers & Market Share in the Compostable Toothbrush Industry
Global Compostable & Biodegradable Refuse Bags Market Insights – Trends, Demand & Growth 2025–2035
Competitive Overview of Compostable Packaging Companies
Market Share Distribution Among Compostable Refuse Bag Manufacturers
Compostable Mailer Market Growth & Trends Forecast 2024-2034
Compostable Pouch Market Insights – Growth & Forecast 2024-2034
UK Compostable Toothbrush Market Report – Key Trends & Growth Forecast 2025-2035

Thank you!
You will receive an email from our Business Development Manager. Please be sure to check your SPAM/JUNK folder too.
Chat With
MaRIA