Reports

- Global Locations -

Headquarters

Future Market Insights, Inc.

Christiana Corporate, 200
Continental Drive, Suite 401,
Newark, Delaware - 19713,
United States

T: +1-845-579-5705

Americas

Future Market Insights, Inc.

616 Corporate Way, Suite 2-9018,
Valley Cottage, NY 10989, United States

T: +1-347-918-3531

MEA

Future Market Insights

1602-6 Jumeirah Bay X2 Tower, Plot No: JLT-PH2-X2A,
Jumeirah Lakes Towers, Dubai,
United Arab Emirates

Europe

Future Market Insights

3rd Floor, 207 Regent Street,
W1B 3HH London
United Kingdom

T: + 44 (0) 20 8123 9659
D: +44 (0) 20 3287 4268

Asia Pacific

Future Market Insights

IndiaLand Global Tech Park, Unit UG-1, Behind Grand HighStreet, Phase 1, Hinjawadi, MH, Pune – 411057, India

Compression Garments Market Outlook (2023 to 2033)

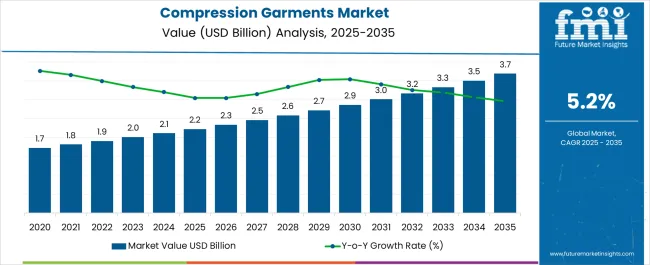
The global compression garments market size is expected to be valued at US$ 1,991.7 million in 2023. The growth of this market is stimulated by factors such as changing lifestyles, increased use of compression wear among the geriatric population, and developments in garment designs and fabric technology.

The overall demand for compression garments is projected to grow at a CAGR of 5.2% between 2023 and 2033, totaling around US$ 3,316.3 million by 2033.

Attributes Details
Historical Value (2022) US$ 1,906.6 million
Current Year Value (2023) US$ 1,991.7 million
Expected Forecast Value (2033) US$ 3,316.3 million
Historical CAGR (2018 to 2022) 4.1%
Projected CAGR (2023 to 2033) 5.2%

The billion-dollar global fitness industry is dovetailed with the emerging global healthcare industry. Both are in harmony with each other and they are growing manifold. Fitness is the buzzword of modern society and global citizens are extremely conscious about their physical and mental fitness. The enhanced awareness levels amongst denizens are creating a major and robust platform for the Compression Garments market.

The compression garments market is directly attached to the development and growth of the healthcare industry. The compression garments are extremely useful and they are tailor-made to protect limbs and muscles from any possible injury. Compression garments are used by athletes globally and also by physicians to treat any kind of limb or muscular injury.

A recently tabled report reveals that the sports apparel and foot ware industry is growing at an average rate of 42%. The global sports and fitness industry is predicted to touch 300 billion in the coming few years.

This acute growth rate will surely cement the future of the compression garments industry. Compression garments are widely used by physicians for treating lymphedema. Presently more than 2, 50,000 people are suffering from this disease in the United Kingdom The global population of affected people is swelling every day.

Women who are undergoing treatment for breast cancer are prone to diseases like lymphedema. Presently more than 1.38 million women worldwide are prey to breast cancer which is a prospective market for Compression garments makers.

Don't pay for what you don't need

Customize your report by selecting specific countries or regions and save 30%!

Compression Garments Demand Analysis (2018 to 2022) Vs Market Outlook (2023 to 2033)

The global demand for compression garments is projected to increase at a CAGR of 5.2% during the forecast period between 2023 and 2033, reaching a total of US$ 3,316.3 million by 2033, according to a report from Future Market Insights (FMI). From 2018 to 2022, sales witnessed significant growth, registering a CAGR of 4.1%.

The valuation of the industry is increasing with an increase in certain disorders that require compression garments to manage their disease conditions. For instance, according to SAGE Journal’s publication, there were approximately 122,000, 263,000, 345,000, 253,000, 85,000, 230,000, and 643,000 new or recurrent deep venous disease-related venous leg ulcers (DRV) in Australia, France, Germany, Italy, Spain, United Kingdom, and the USA respectively in the year 2019.

These leg ulcers have mainly a venous origin and are caused by high pressure in the veins. This can further lead to blockage and weakness of the valves in the veins of the leg. To prevent and treat venous ulcers, one has to reduce the pressure using external appliances such as compression garments, which absorb the shock, or pressure on the legs.

Increasing cases of obesity are also playing a key role in driving the market for compression garments. Obesity has various associated issues such as swelling of the foot due to poor circulation. Obesity has been noted by the WHO to be common in the pediatric population as well.

For instance, according to WHO, there were approximately 39 million overweight or obese children under the age of 5 in 2020. Thus, to manage the swelling of the foot due to poor circulation, this population uses compression garments and stockings that benefit the industry by increasing the volume of products manufactured and distributed.

Which Drivers Underpin Compression Garments Industry Expansion?

The compression therapy market is growing fast. The rise of the diseases like lymphedema and the overall growth of the healthcare industry’s massive global aging population which is easily affected by age-related muscular problems and the steady rise of the fitness and sports industry are some of the drivers which are pulling up the potentiality of the compression garments market globally.

Compression-based garments are mostly used by physicians for treating specific ailments. The compression garments provide instant relief from muscle pain and help in repairing any torn tissue. They are specifically made to protect and heal a specific set of injured muscles.

The entire manufacturing market of compression garments is concentrated in Australia and the supply of clothes and an overall positive scene of the textile market is also fuelling the growth of the compression garments market.

The demand for compression garments soared as athletes are preferring them to avoid any kind of possible injury during an event. The producers are constantly innovating with the materials and revamping styles to woo more consumers. The compression garments market is extremely prosperous because of the constant modernization drive happening in the sports, fitness, and healthcare sector.

Sabyasachi Ghosh
Sabyasachi Ghosh

Principal Consultant

Talk to Analyst

Find your sweet spots for generating winning opportunities in this market.

Which Factors Are Limiting The Growth Of The Compression Garments Market?

The global compression garments market is on the rise. But the production of these stylized garments is limited to the clutches of a few major manufacturers and exporters who are camping in a specific corner of the world.

This autonomy is not only restricting the growth of the compression garments market but is also affecting the pricing of these medicated garments. The high pricing is a major factor that is also dipping the global growth of the compression garments market.
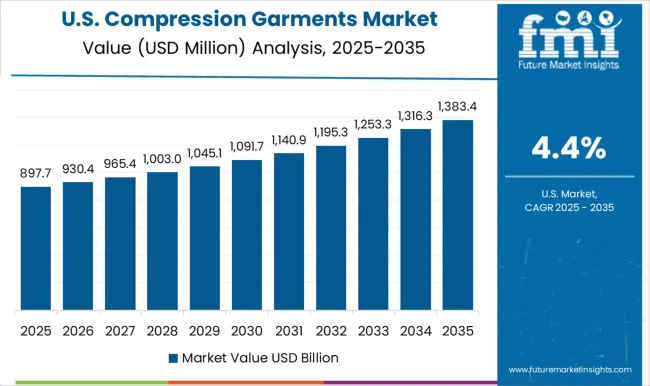
Region-Wise Insights

Will North America Hold a Significant Position in the Global Compression Garments Market?

In terms of geographic divisions, North America accumulated the maximum revenue, accounting for a 48.2% share in compression garments in 2022. According to Future Market Insights analysis, the region is projected to maintain its governance over the projection period, backed by the increasing participation of women in sporting events and championships.

Today in the USA over one-third of all female students in high school play sports, and the number of women participating in university sports has tripled. Women now compete in almost every sport, whether the competition is team, individual, or mixed gender.

Girls and women also are increasingly participants in sports that have traditionally been seen as out of bounds for women, including soccer, ice hockey, lacrosse, wrestling, and rugby. Hence, the increasing participation upsurges the use of compression garments.

The compression wear decreases muscle vibrations. Hence, players wearing it are less likely to experience muscle soreness the next day. Additionally, it provides extra support and improved oxygen flow, which altogether reduces the risk of straining a muscle during games and practice sessions.

The tremendous popularity of major professional sports leagues, commonly referred to as the Big Four which includes Major League Baseball (MLB), the National Basketball Association (NBA), the National Football League (NFL), and the National Hockey League (NHL) in the region is a crucial factor driving the demand for compression garments.

Country United States
2022 Value Share in Global Market 39%

The United States holds a prominent position in the global compression garments market. The increasing prevalence of chronic conditions such as obesity, diabetes, and cardiovascular diseases has driven the demand for compression garments as part of a holistic healthcare approach. Athletes and fitness enthusiasts also contribute significantly to the market's growth as they seek performance-enhancing products and faster recovery solutions.

The United States compression garments market is poised for further growth due to increasing health consciousness. The healthcare industry plays a crucial role in the United States compression garments market. The sports and fitness culture in the United States is thriving. Athletes, fitness enthusiasts, and weekend warriors are adopting compression garments to enhance performance and facilitate quicker recovery after intense workouts or sports events.
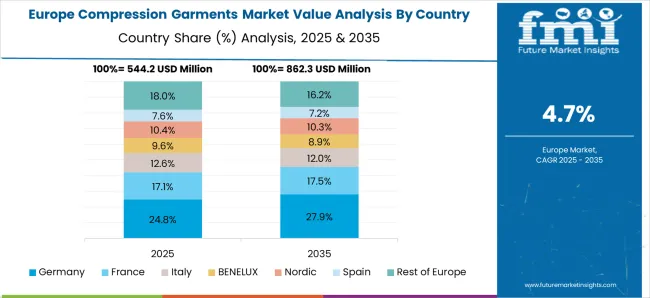
How Will the Growth of the European Compression Garments Market unfold?

Based on Future Market Insight’s recent analysis, Europe is the second-largest region in terms of revenue share, accounting for nearly 26.8% share of the Compression Garments market. Prominent countries contributing to the regional revenue share of compression garments are Germany, the United Kingdom, and France.

The increasing workload for varicose veins treatments and orthopedic surgeries is observed ahead with advancements in fabric, garment designers are likely to propel the region’s growth.

A textile company-Barcelcom Têxteis in North Portugal has developed new materials and fabric technologies with applications for several medical conditions, from blood circulation in the legs to breast cancer. The company used the funding to finance research and development, in partnership with the University of Minho and a local research organization, TecMinho.

The consortium investigated new technologies and tested new medical devices based on tubular compression meshes that can be worn over the legs and arms. A sleeve for breast cancer treatment was developed. The garment’s material is light and breathable. These advancements in materials and the development of new products are likely to foster the demand for compression garments in the region.

Country United Kingdom
Value CAGR (2023 to 2033) 5.1%

The United Kingdom compression garments market has seen the integration of smart technology into compression garments. This includes sensors that monitor body metrics, biometric feedback, and other performance-related data. Smart compression garments are appealing to tech-savvy consumers and athletes seeking data-driven insights for optimizing their workouts.

Consumers in the United Kingdom are becoming more environmentally conscious, leading to a rising demand for sustainable and eco-friendly compression garments. Manufacturers that adopt environmentally friendly practices and use recycled materials are likely to gain a competitive edge in the market.

Country Germany
2022 Value Share in Global Market 6.8%

The Germany compression garments market has experienced significant growth over the past few years, driven by increasing awareness about the benefits of compression wear across various age groups and industries. Germany has a reputation for being health-conscious, with individuals increasingly adopting preventive healthcare practices. Compression garments are viewed as a non-invasive method to enhance overall well-being, thereby driving demand.

The country has experienced a surge in fitness and sports activities, ranging from amateur to professional levels. Athletes and fitness enthusiasts use compression wear to improve performance, reduce muscle soreness, and aid in post-workout recovery. As the fitness industry thrives in Germany, the demand for compression garments as workout accessories is on the rise. Gymnasiums and fitness centers promote compression wear, contributing to its market growth.

How is the Asia Pacific bolstering the Demand for Compression Garments?

Increasing Healthcare Spending to Act as a Principal Growth Driver

According to Future Market Insights, the Asia-Pacific market is anticipated to register rapid growth owing to the availability of cheap labor and raw material. The Chinese and Indian products are cost-effective and made of quality textiles. The Indian-made products and making quite a roar in the international arena and giving stiff competition to the international makers of compression garments.

In the Asia Pacific, start-ups, new entrants, and domestic firms have been breaking into the compression garment industry by developing new products for men and women. Compression garment manufacturers are trying out innovative technologies to create new designs and patterns in the clothing line. The latest technological advancements in the compression clothing sector include 3D printing and smart textiles.

The surges in the incidence of sports injuries and accidents, and clinical evidence favoring the adoption of compression therapy in the management of target conditions accelerate the market growth.

Countries Value CAGR (2023 to 2033)
China 6.3%
India 6.8%

The adoption of compression garments for medical purposes, such as post-surgery recovery, varicose vein treatment, and lymphedema management, is rising in China. The healthcare industry's emphasis on non-invasive treatments has positively influenced this trend. China's burgeoning sports and fitness culture has driven the demand for compression garments among athletes and fitness enthusiasts. The products' ability to enhance performance, reduce muscle fatigue, and prevent injuries has made them popular in the sports community.

The increasing penetration of e-commerce platforms in China has made compression garments more accessible to consumers across different regions. Online retail channels offer a wide range of products, easy comparisons, and doorstep delivery, boosting the China compression garments market growth. China's significant tourism industry has indirectly influenced the compression garments industry. Tourists, especially those engaged in long-haul flights, often purchase compression socks to mitigate the risk of deep vein thrombosis (DVT) during travel.

The India compression garments market exhibits promising growth prospects. A surge in health consciousness, driven by growing disposable incomes and urbanization, has led to a rise in demand for compression garments among individuals engaged in various physical activities. The rapid growth of sports and athletics in India, including cricket, football, and other sports, has contributed to the increased adoption of compression garments by athletes seeking enhanced performance and reduced injury risks. India's burgeoning fitness and wellness industry, including gyms, yoga studios, and wellness centers, has driven the demand for compression wear as more individuals seek suitable active wear for their workouts.

The proliferation of e-commerce platforms in India has made compression garments easily accessible to consumers across the country. Online retail channels offer a wide range of products and convenient shopping experiences. The aging population in India is more health-conscious than ever before. Elderly individuals increasingly use compression garments to manage circulation issues and support overall mobility. Celebrities and influencers endorsing compression garments have positively influenced consumer perceptions in India.

Country Japan
2022 Value Share in Global Market 2.7%

Japan has the maximum aging population in the world. With an increasing number of elderly individuals, there is a greater demand for compression garments to address health issues related to poor blood circulation, joint pains, and muscle weakness. In Japan, there is a long-standing belief in the concept of Bonyu Sokuhatsu, which translates to preventing illness through the feet. This belief has led to a strong market for compression stockings, as they are considered beneficial for improving circulation and preventing health issues.

The younger population in Japan is becoming increasingly health-conscious, leading to a surge in sports and fitness activities. Compression garments have gained popularity among athletes and fitness enthusiasts because they enhance performance and reduce muscle fatigue. The Japan compression garments market is influenced by advancements in textile technology. Manufacturers are constantly researching and adopting innovative materials and fabrication techniques to enhance the functionality and comfort of compression wear.

Get the data you need at a Fraction of the cost

Personalize your report by choosing insights you need
and save 40%!

Category-Wise Insights

Segment 2022 Value Share in Global Market
Male 58.7%
Pharmacy & Offline Retailers 51.3%

Which Compression Garments Category Dominates Among Different Gender Types?

Male Consumers are Driving Unprecedented Growth in Compression Garments Sales

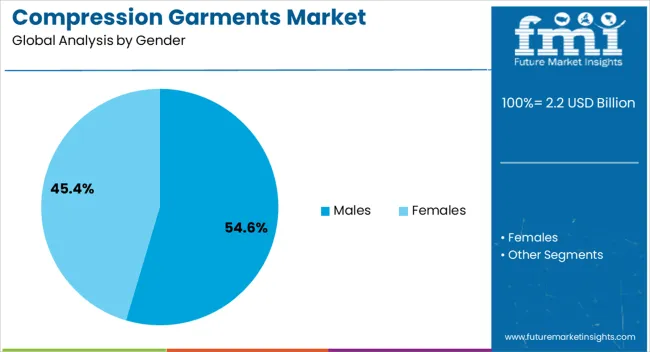
The male gender segment has dominated the market due to various factors. Compression garments are often used in sports and fitness activities. The popularity of such activities among males drives higher demand for compression garments in this segment. Certain professions and industries involve physically demanding tasks. These fields have traditionally employed more men. The presence of men in these industries contributes to their dominance in the market. Cultural norms and societal expectations regarding body image and appearance also play a role in shaping preferences for compression garments. Furthermore, marketing strategies focused on male consumers, athlete endorsements, and product development tailored to male needs have further reinforced their market dominance. However, as societies evolve and traditional gender roles change, the dynamics in the compression garments market are likely to shift, with increased awareness and adoption among females.

Among the Different Distribution Channels, Which Compression Garments Category Emerges as the Dominant Player?

In-person Expertise is the Key to Pharmacy & Offline Retailers' Dominance in Compression Garments Industry

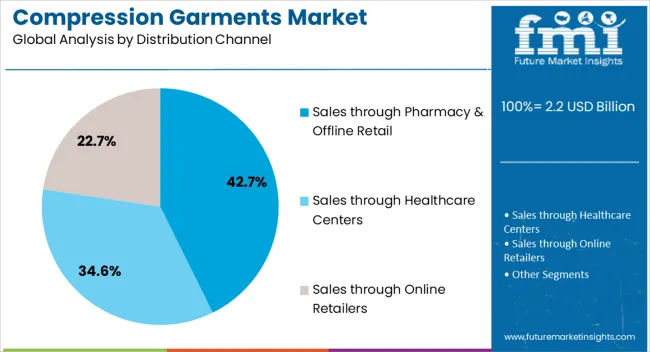
The pharmacy & offline retail distribution channel segment leads the market for several reasons. The widespread accessibility of pharmacies and brick-and-mortar retail stores makes it convenient for consumers to purchase compression garments promptly when needed. In-person assistance provided by knowledgeable staff further increases the value of the buying experience, especially when customers require proper fitting and sizing for medical-grade garments. Moreover, the well-established distribution networks of these physical stores contribute to wider market reach and better product placement. Additionally, the trust consumers place in these established outlets, particularly in the medical context, encourages them to purchase in-store. Furthermore, the instant gratification of taking the product home immediately appeals to certain customers compared to waiting for online deliveries. Lastly, the preference of a portion of the target audience for physical stores over online platforms reinforces the dominance of sales through pharmacy & offline retail in the market.

By End-user type, Which Compression Garments Category Will Remain Prominent?

Increasing Popularity of Sporting Events in Several Countries to Augment Demand for Compression Garments

The global compression garments market is segmented into end-user types and regions. Based on the end-user type segment, the men’s subtype holds a majority share in compression undergarments.

As per the recently published report by Future Market Insights, the segment is likely to maintain its governance over the conjecture period, attributed to the increasing number of male athletes and sporting events at the international and domestic levels.

The women segment is also likely to capture a significant share throughout the forecast period. This market growth is attributed to the increasing recognition of different sports championships with the rising number of women’s participation and demand for compression leggings, bras, and socks.

Compression sportswear effectively reduces limb swelling and supports various muscles and ligaments, which are prone to injuries with extensive sports events in a calendar year.

The Start-up Ecosystem

How key Players are Opening Frontiers for Future Growth?
  • Founded in 2013, ARMR is an online store selling its private-label line of sports training apparel and accessories. Products such as t-shirts, training shorts & pants, jackets, towels, compression garments, gloves, socks, etc. Sells its items across 3 brand types - Skyn, Aire-Pro, and Sport. The company is located in Bangalore, India.
  • Launched in 2019, ElderLiving is an online retailer of medical devices, orthopedic, and healthcare products for elders. Users can use the site to look for information and place orders for products. Mobility and walking aids, respiratory care equipment, medical compression garments, personal protective equipment (PPE), and much more are among the product categories. The company is headquartered in Pune (India).

Competitive Landscape

What are the Leading Players in the Compression Garments Market Up to?

  • In March 2023, Pressio revealed the debut of its United States e-commerce website and the immediate availability of its latest Spring/Summer 2023 collection. This marks the first time the company has introduced a comprehensive sustainable range of running, compression, and endurance sportswear, along with accessories, tailored for both men and women in the United States.
  • In April 2023, AIROS Medical Inc. achieved a significant milestone. It received 510(k) approval from the United States Food and Drug Administration to market the AIROS 8P sequential therapy device and garment system. This approval allows AIROS to launch a larger variety of compression treatment garments, including lower truncal garments to treat belly edema.
  • In January 2023, Tennis Australia introduced the initial batch of SportsTech companies chosen to take part in the newly launched AO StartUps program. Among these companies, CAPE Bionics, a manufacturer of compression garments, had the honor of being the first to be showcased as part of this program.
  • In February 2022, the renowned German sporting goods giant, Adidas, introduced a fresh lineup called Formotion. This collection takes inspiration from shapewear and incorporates graded zonal compression to provide sculpting and support that complements the unique shapes of women. The Formotion collection caters to active women of various body types and sizes. It offers them comfortable performance wear suitable for a wide range of activities, including Pilates and intense HIIT gym workouts.
  • In June 2021, Device Technologies was acquired by Navis Capital Partners, which resulted in the company’s expansion into Southeast Asia. Adding to the complexity, Device Technologies is currently managing more than 70,000 individual products from 200 different brands.
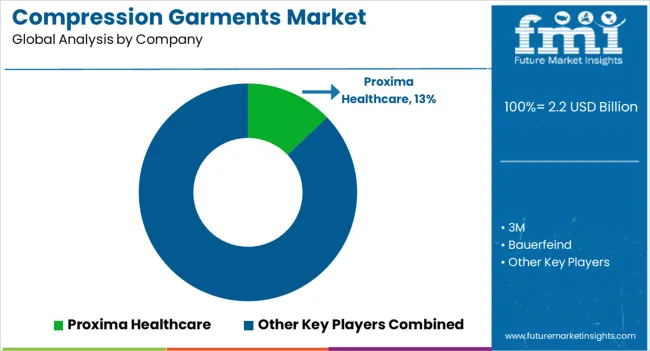
  • In May 2021, Proxima Healthcare Solutions manufactured post-surgical compression garments that are the ultimate in innovation and lead the plastic surgery industry.

Key Companies Profiled

  • Proxima Healthcare
  • 3M
  • Bauerfeind
  • Macom Enterprises
  • Leonisa
  • LIPOELASTIC
  • Cosmac Healthcare
  • Lohmann and Rauscher
  • Wear Ease
  • Peninsula BioMedical
  • LympheDIVAs
  • Juzo
  • Medico International
  • The Marena Group
  • Essity

Key Segments Covered In The Compression Garments Industry Analysis

By Gender:

  • Males
  • Females

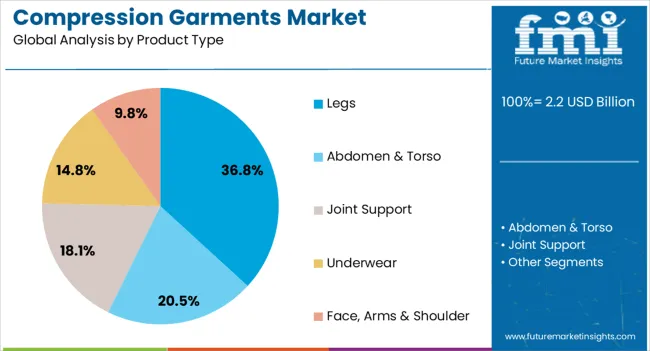
By Product Type:

  • Abdomen & Torso
  • Legs
  • Joint Support
  • Underwear
  • Face, Arms & Shoulder

By Distribution Channel:

  • Sales through Pharmacy & Offline Retail
  • Sales through Healthcare Centers
  • Sales through Online Retailers

By Compression Delivery:

  • Elastic
  • Pneumatic

By Application:

  • Healthcare
  • Sports
  • Swimwear

By Region:

  • North America
  • Latin America
  • Europe
  • Asia Pacific
  • Middle East & Africa

Frequently Asked Questions

Which is the Most Popular Destination Wedding Company?

Sandals Resorts, Tamarind, and Dreams Resort are popular companies in the global market.

What is the Current Compression Garments Market Size?

The global market is estimated to be around US$ 1,991.7 million in 2023.

What could be the Total Value of Compression Garments Market Size by 2033?

The net worth of the global market could reach around US$ 3,316.3 million by 2033.

Which is the Most Preferred Product Type of Compression Garments Worldwide?

The male gender segment is preferred and their sales contributed 58.7% of the total sales in 2022.

Why Sales of the Compression Garments Market is Expanding at a Notable Rate in India?

The booming e-commerce industry in India could drive sales at 6.8% CAGR up to 2033.

Table of Content

1. Executive Summary

    1.1. Global Market Outlook

    1.2. Demand-side Trends

    1.3. Supply-side Trends

    1.4. Technology Roadmap Analysis

    1.5. Analysis and Recommendations

2. Market Overview

    2.1. Market Coverage / Taxonomy

    2.2. Market Definition / Scope / Limitations

3. Market Background

    3.1. Market Dynamics

        3.1.1. Drivers

        3.1.2. Restraints

        3.1.3. Opportunity

        3.1.4. Trends

    3.2. Scenario Forecast

        3.2.1. Demand in Optimistic Scenario

        3.2.2. Demand in Likely Scenario

        3.2.3. Demand in Conservative Scenario

    3.3. Opportunity Map Analysis

    3.4. Investment Feasibility Matrix

    3.5. PESTLE and Porter’s Analysis

    3.6. Regulatory Landscape

        3.6.1. By Key Regions

        3.6.2. By Key Countries

    3.7. Regional Parent Market Outlook

4. Global Market Analysis 2018 to 2022 and Forecast, 2023 to 2033

    4.1. Historical Market Size Value (US$ Million) Analysis, 2018 to 2022

    4.2. Current and Future Market Size Value (US$ Million) Projections, 2023 to 2033

        4.2.1. Y-o-Y Growth Trend Analysis

        4.2.2. Absolute $ Opportunity Analysis

5. Global Market Analysis 2018 to 2022 and Forecast 2023 to 2033, By Gender

    5.1. Introduction / Key Findings

    5.2. Historical Market Size Value (US$ Million) Analysis By Gender, 2018 to 2022

    5.3. Current and Future Market Size Value (US$ Million) Analysis and Forecast By Gender, 2023 to 2033

        5.3.1. Male

        5.3.2. Female

    5.4. Y-o-Y Growth Trend Analysis By Gender, 2018 to 2022

    5.5. Absolute $ Opportunity Analysis By Gender, 2023 to 2033

6. Global Market Analysis 2018 to 2022 and Forecast 2023 to 2033, By Product Type

    6.1. Introduction / Key Findings

    6.2. Historical Market Size Value (US$ Million) Analysis By Product Type, 2018 to 2022

    6.3. Current and Future Market Size Value (US$ Million) Analysis and Forecast By Product Type, 2023 to 2033

        6.3.1. Abdomen & Torso

        6.3.2. Legs

        6.3.3. Joint Support

        6.3.4. Underwear

        6.3.5. Face, Arms & Shoulder

    6.4. Y-o-Y Growth Trend Analysis By Product Type, 2018 to 2022

    6.5. Absolute $ Opportunity Analysis By Product Type, 2023 to 2033

7. Global Market Analysis 2018 to 2022 and Forecast 2023 to 2033, By Distribution Channel 

    7.1. Introduction / Key Findings

    7.2. Historical Market Size Value (US$ Million) Analysis By Distribution Channel, 2018 to 2022

    7.3. Current and Future Market Size Value (US$ Million) Analysis and Forecast By Distribution Channel, 2023 to 2033

        7.3.1. Pharmacy & Offline Retail

        7.3.2. Healthcare Centers

        7.3.3. Online Retailers

    7.4. Y-o-Y Growth Trend Analysis By Distribution Channel, 2018 to 2022

    7.5. Absolute $ Opportunity Analysis By Distribution Channel, 2023 to 2033

8. Global Market Analysis 2018 to 2022 and Forecast 2023 to 2033, By Compression Delivery

    8.1. Introduction / Key Findings

    8.2. Historical Market Size Value (US$ Million) Analysis By Compression Delivery, 2018 to 2022

    8.3. Current and Future Market Size Value (US$ Million) Analysis and Forecast By Compression Delivery, 2023 to 2033

        8.3.1. Elastic

        8.3.2. Pneumatic

    8.4. Y-o-Y Growth Trend Analysis By Compression Delivery, 2018 to 2022

    8.5. Absolute $ Opportunity Analysis By Compression Delivery, 2023 to 2033

9. Global Market Analysis 2018 to 2022 and Forecast 2023 to 2033, By Application

    9.1. Introduction / Key Findings

    9.2. Historical Market Size Value (US$ Million) Analysis By Application, 2018 to 2022

    9.3. Current and Future Market Size Value (US$ Million) Analysis and Forecast By Application, 2023 to 2033

        9.3.1. Healthcare

        9.3.2. Sports

        9.3.3. Swimwear

    9.4. Y-o-Y Growth Trend Analysis By Application, 2018 to 2022

    9.5. Absolute $ Opportunity Analysis By Application, 2023 to 2033

10. Global Market Analysis 2018 to 2022 and Forecast 2023 to 2033, By Region

    10.1. Introduction

    10.2. Historical Market Size Value (US$ Million) Analysis By Region, 2018 to 2022

    10.3. Current Market Size Value (US$ Million) Analysis and Forecast By Region, 2023 to 2033

        10.3.1. North America

        10.3.2. Latin America

        10.3.3. Western Europe

        10.3.4. Eastern Europe

        10.3.5. South Asia and Pacific

        10.3.6. East Asia

        10.3.7. Middle East and Africa

    10.4. Market Attractiveness Analysis By Region

11. North America Market Analysis 2018 to 2022 and Forecast 2023 to 2033, By Country

    11.1. Historical Market Size Value (US$ Million) Trend Analysis By Market Taxonomy, 2018 to 2022

    11.2. Market Size Value (US$ Million) Forecast By Market Taxonomy, 2023 to 2033

        11.2.1. By Country

            11.2.1.1. USA

            11.2.1.2. Canada

        11.2.2. By Gender

        11.2.3. By Product Type

        11.2.4. By Distribution Channel

        11.2.5. By Compression Delivery

        11.2.6. By Application

    11.3. Market Attractiveness Analysis

        11.3.1. By Country

        11.3.2. By Gender

        11.3.3. By Product Type

        11.3.4. By Distribution Channel

        11.3.5. By Compression Delivery

        11.3.6. By Application

    11.4. Key Takeaways

12. Latin America Market Analysis 2018 to 2022 and Forecast 2023 to 2033, By Country

    12.1. Historical Market Size Value (US$ Million) Trend Analysis By Market Taxonomy, 2018 to 2022

    12.2. Market Size Value (US$ Million) Forecast By Market Taxonomy, 2023 to 2033

        12.2.1. By Country

            12.2.1.1. Brazil

            12.2.1.2. Mexico

            12.2.1.3. Rest of Latin America

        12.2.2. By Gender

        12.2.3. By Product Type

        12.2.4. By Distribution Channel

        12.2.5. By Compression Delivery

        12.2.6. By Application

    12.3. Market Attractiveness Analysis

        12.3.1. By Country

        12.3.2. By Gender

        12.3.3. By Product Type

        12.3.4. By Distribution Channel

        12.3.5. By Compression Delivery

        12.3.6. By Application

    12.4. Key Takeaways

13. Western Europe Market Analysis 2018 to 2022 and Forecast 2023 to 2033, By Country

    13.1. Historical Market Size Value (US$ Million) Trend Analysis By Market Taxonomy, 2018 to 2022

    13.2. Market Size Value (US$ Million) Forecast By Market Taxonomy, 2023 to 2033

        13.2.1. By Country

            13.2.1.1. Germany

            13.2.1.2. U.K.

            13.2.1.3. France

            13.2.1.4. Spain

            13.2.1.5. Italy

            13.2.1.6. Rest of Western Europe

        13.2.2. By Gender

        13.2.3. By Product Type

        13.2.4. By Distribution Channel

        13.2.5. By Compression Delivery

        13.2.6. By Application

    13.3. Market Attractiveness Analysis

        13.3.1. By Country

        13.3.2. By Gender

        13.3.3. By Product Type

        13.3.4. By Distribution Channel

        13.3.5. By Compression Delivery

        13.3.6. By Application

    13.4. Key Takeaways

14. Eastern Europe Market Analysis 2018 to 2022 and Forecast 2023 to 2033, By Country

    14.1. Historical Market Size Value (US$ Million) Trend Analysis By Market Taxonomy, 2018 to 2022

    14.2. Market Size Value (US$ Million) Forecast By Market Taxonomy, 2023 to 2033

        14.2.1. By Country

            14.2.1.1. Poland

            14.2.1.2. Russia

            14.2.1.3. Czech Republic

            14.2.1.4. Romania

            14.2.1.5. Rest of Eastern Europe

        14.2.2. By Gender

        14.2.3. By Product Type

        14.2.4. By Distribution Channel

        14.2.5. By Compression Delivery

        14.2.6. By Application

    14.3. Market Attractiveness Analysis

        14.3.1. By Country

        14.3.2. By Gender

        14.3.3. By Product Type

        14.3.4. By Distribution Channel

        14.3.5. By Compression Delivery

        14.3.6. By Application

    14.4. Key Takeaways

15. South Asia and Pacific Market Analysis 2018 to 2022 and Forecast 2023 to 2033, By Country

    15.1. Historical Market Size Value (US$ Million) Trend Analysis By Market Taxonomy, 2018 to 2022

    15.2. Market Size Value (US$ Million) Forecast By Market Taxonomy, 2023 to 2033

        15.2.1. By Country

            15.2.1.1. India

            15.2.1.2. Bangladesh

            15.2.1.3. Australia

            15.2.1.4. New Zealand

            15.2.1.5. Rest of South Asia and Pacific

        15.2.2. By Gender

        15.2.3. By Product Type

        15.2.4. By Distribution Channel

        15.2.5. By Compression Delivery

        15.2.6. By Application

    15.3. Market Attractiveness Analysis

        15.3.1. By Country

        15.3.2. By Gender

        15.3.3. By Product Type

        15.3.4. By Distribution Channel

        15.3.5. By Compression Delivery

        15.3.6. By Application

    15.4. Key Takeaways

16. East Asia Market Analysis 2018 to 2022 and Forecast 2023 to 2033, By Country

    16.1. Historical Market Size Value (US$ Million) Trend Analysis By Market Taxonomy, 2018 to 2022

    16.2. Market Size Value (US$ Million) Forecast By Market Taxonomy, 2023 to 2033

        16.2.1. By Country

            16.2.1.1. China

            16.2.1.2. Japan

            16.2.1.3. South Korea

        16.2.2. By Gender

        16.2.3. By Product Type

        16.2.4. By Distribution Channel

        16.2.5. By Compression Delivery

        16.2.6. By Application

    16.3. Market Attractiveness Analysis

        16.3.1. By Country

        16.3.2. By Gender

        16.3.3. By Product Type

        16.3.4. By Distribution Channel

        16.3.5. By Compression Delivery

        16.3.6. By Application

    16.4. Key Takeaways

17. Middle East and Africa Market Analysis 2018 to 2022 and Forecast 2023 to 2033, By Country

    17.1. Historical Market Size Value (US$ Million) Trend Analysis By Market Taxonomy, 2018 to 2022

    17.2. Market Size Value (US$ Million) Forecast By Market Taxonomy, 2023 to 2033

        17.2.1. By Country

            17.2.1.1. GCC Countries

            17.2.1.2. South Africa

            17.2.1.3. Israel

            17.2.1.4. Rest of MEA

        17.2.2. By Gender

        17.2.3. By Product Type

        17.2.4. By Distribution Channel

        17.2.5. By Compression Delivery

        17.2.6. By Application

    17.3. Market Attractiveness Analysis

        17.3.1. By Country

        17.3.2. By Gender

        17.3.3. By Product Type

        17.3.4. By Distribution Channel

        17.3.5. By Compression Delivery

        17.3.6. By Application

    17.4. Key Takeaways

18. Key Countries Market Analysis

    18.1. USA

        18.1.1. Pricing Analysis

        18.1.2. Market Share Analysis, 2022

            18.1.2.1. By Gender

            18.1.2.2. By Product Type

            18.1.2.3. By Distribution Channel

            18.1.2.4. By Compression Delivery

            18.1.2.5. By Application

    18.2. Canada

        18.2.1. Pricing Analysis

        18.2.2. Market Share Analysis, 2022

            18.2.2.1. By Gender

            18.2.2.2. By Product Type

            18.2.2.3. By Distribution Channel

            18.2.2.4. By Compression Delivery

            18.2.2.5. By Application

    18.3. Brazil

        18.3.1. Pricing Analysis

        18.3.2. Market Share Analysis, 2022

            18.3.2.1. By Gender

            18.3.2.2. By Product Type

            18.3.2.3. By Distribution Channel

            18.3.2.4. By Compression Delivery

            18.3.2.5. By Application

    18.4. Mexico

        18.4.1. Pricing Analysis

        18.4.2. Market Share Analysis, 2022

            18.4.2.1. By Gender

            18.4.2.2. By Product Type

            18.4.2.3. By Distribution Channel

            18.4.2.4. By Compression Delivery

            18.4.2.5. By Application

    18.5. Germany

        18.5.1. Pricing Analysis

        18.5.2. Market Share Analysis, 2022

            18.5.2.1. By Gender

            18.5.2.2. By Product Type

            18.5.2.3. By Distribution Channel

            18.5.2.4. By Compression Delivery

            18.5.2.5. By Application

    18.6. UK

        18.6.1. Pricing Analysis

        18.6.2. Market Share Analysis, 2022

            18.6.2.1. By Gender

            18.6.2.2. By Product Type

            18.6.2.3. By Distribution Channel

            18.6.2.4. By Compression Delivery

            18.6.2.5. By Application

    18.7. France

        18.7.1. Pricing Analysis

        18.7.2. Market Share Analysis, 2022

            18.7.2.1. By Gender

            18.7.2.2. By Product Type

            18.7.2.3. By Distribution Channel

            18.7.2.4. By Compression Delivery

            18.7.2.5. By Application

    18.8. Spain

        18.8.1. Pricing Analysis

        18.8.2. Market Share Analysis, 2022

            18.8.2.1. By Gender

            18.8.2.2. By Product Type

            18.8.2.3. By Distribution Channel

            18.8.2.4. By Compression Delivery

            18.8.2.5. By Application

    18.9. Italy

        18.9.1. Pricing Analysis

        18.9.2. Market Share Analysis, 2022

            18.9.2.1. By Gender

            18.9.2.2. By Product Type

            18.9.2.3. By Distribution Channel

            18.9.2.4. By Compression Delivery

            18.9.2.5. By Application

    18.10. Poland

        18.10.1. Pricing Analysis

        18.10.2. Market Share Analysis, 2022

            18.10.2.1. By Gender

            18.10.2.2. By Product Type

            18.10.2.3. By Distribution Channel

            18.10.2.4. By Compression Delivery

            18.10.2.5. By Application

    18.11. Russia

        18.11.1. Pricing Analysis

        18.11.2. Market Share Analysis, 2022

            18.11.2.1. By Gender

            18.11.2.2. By Product Type

            18.11.2.3. By Distribution Channel

            18.11.2.4. By Compression Delivery

            18.11.2.5. By Application

    18.12. Czech Republic

        18.12.1. Pricing Analysis

        18.12.2. Market Share Analysis, 2022

            18.12.2.1. By Gender

            18.12.2.2. By Product Type

            18.12.2.3. By Distribution Channel

            18.12.2.4. By Compression Delivery

            18.12.2.5. By Application

    18.13. Romania

        18.13.1. Pricing Analysis

        18.13.2. Market Share Analysis, 2022

            18.13.2.1. By Gender

            18.13.2.2. By Product Type

            18.13.2.3. By Distribution Channel

            18.13.2.4. By Compression Delivery

            18.13.2.5. By Application

    18.14. India

        18.14.1. Pricing Analysis

        18.14.2. Market Share Analysis, 2022

            18.14.2.1. By Gender

            18.14.2.2. By Product Type

            18.14.2.3. By Distribution Channel

            18.14.2.4. By Compression Delivery

            18.14.2.5. By Application

    18.15. Bangladesh

        18.15.1. Pricing Analysis

        18.15.2. Market Share Analysis, 2022

            18.15.2.1. By Gender

            18.15.2.2. By Product Type

            18.15.2.3. By Distribution Channel

            18.15.2.4. By Compression Delivery

            18.15.2.5. By Application

    18.16. Australia

        18.16.1. Pricing Analysis

        18.16.2. Market Share Analysis, 2022

            18.16.2.1. By Gender

            18.16.2.2. By Product Type

            18.16.2.3. By Distribution Channel

            18.16.2.4. By Compression Delivery

            18.16.2.5. By Application

    18.17. New Zealand

        18.17.1. Pricing Analysis

        18.17.2. Market Share Analysis, 2022

            18.17.2.1. By Gender

            18.17.2.2. By Product Type

            18.17.2.3. By Distribution Channel

            18.17.2.4. By Compression Delivery

            18.17.2.5. By Application

    18.18. China

        18.18.1. Pricing Analysis

        18.18.2. Market Share Analysis, 2022

            18.18.2.1. By Gender

            18.18.2.2. By Product Type

            18.18.2.3. By Distribution Channel

            18.18.2.4. By Compression Delivery

            18.18.2.5. By Application

    18.19. Japan

        18.19.1. Pricing Analysis

        18.19.2. Market Share Analysis, 2022

            18.19.2.1. By Gender

            18.19.2.2. By Product Type

            18.19.2.3. By Distribution Channel

            18.19.2.4. By Compression Delivery

            18.19.2.5. By Application

    18.20. South Korea

        18.20.1. Pricing Analysis

        18.20.2. Market Share Analysis, 2022

            18.20.2.1. By Gender

            18.20.2.2. By Product Type

            18.20.2.3. By Distribution Channel

            18.20.2.4. By Compression Delivery

            18.20.2.5. By Application

    18.21. GCC Countries

        18.21.1. Pricing Analysis

        18.21.2. Market Share Analysis, 2022

            18.21.2.1. By Gender

            18.21.2.2. By Product Type

            18.21.2.3. By Distribution Channel

            18.21.2.4. By Compression Delivery

            18.21.2.5. By Application

    18.22. South Africa

        18.22.1. Pricing Analysis

        18.22.2. Market Share Analysis, 2022

            18.22.2.1. By Gender

            18.22.2.2. By Product Type

            18.22.2.3. By Distribution Channel

            18.22.2.4. By Compression Delivery

            18.22.2.5. By Application

    18.23. Israel

        18.23.1. Pricing Analysis

        18.23.2. Market Share Analysis, 2022

            18.23.2.1. By Gender

            18.23.2.2. By Product Type

            18.23.2.3. By Distribution Channel

            18.23.2.4. By Compression Delivery

            18.23.2.5. By Application

19. Market Structure Analysis

    19.1. Competition Dashboard

    19.2. Competition Benchmarking

    19.3. Market Share Analysis of Top Players

        19.3.1. By Regional

        19.3.2. By Gender

        19.3.3. By Product Type

        19.3.4. By Distribution Channel

        19.3.5. By Compression Delivery

        19.3.6. By Application

20. Competition Analysis

    20.1. Competition Deep Dive

        20.1.1. Proxima Healthcare

            20.1.1.1. Overview

            20.1.1.2. Product Portfolio

            20.1.1.3. Profitability by Market Segments

            20.1.1.4. Sales Footprint

            20.1.1.5. Strategy Overview

                20.1.1.5.1. Marketing Strategy

        20.1.2. 3M

            20.1.2.1. Overview

            20.1.2.2. Product Portfolio

            20.1.2.3. Profitability by Market Segments

            20.1.2.4. Sales Footprint

            20.1.2.5. Strategy Overview

                20.1.2.5.1. Marketing Strategy

        20.1.3. Bauerfeind

            20.1.3.1. Overview

            20.1.3.2. Product Portfolio

            20.1.3.3. Profitability by Market Segments

            20.1.3.4. Sales Footprint

            20.1.3.5. Strategy Overview

                20.1.3.5.1. Marketing Strategy

        20.1.4. Macom Enterprises

            20.1.4.1. Overview

            20.1.4.2. Product Portfolio

            20.1.4.3. Profitability by Market Segments

            20.1.4.4. Sales Footprint

            20.1.4.5. Strategy Overview

                20.1.4.5.1. Marketing Strategy

        20.1.5. Leonisa

            20.1.5.1. Overview

            20.1.5.2. Product Portfolio

            20.1.5.3. Profitability by Market Segments

            20.1.5.4. Sales Footprint

            20.1.5.5. Strategy Overview

                20.1.5.5.1. Marketing Strategy

        20.1.6. LIPOELASTIC

            20.1.6.1. Overview

            20.1.6.2. Product Portfolio

            20.1.6.3. Profitability by Market Segments

            20.1.6.4. Sales Footprint

            20.1.6.5. Strategy Overview

                20.1.6.5.1. Marketing Strategy

        20.1.7. Cosmac Healthcare

            20.1.7.1. Overview

            20.1.7.2. Product Portfolio

            20.1.7.3. Profitability by Market Segments

            20.1.7.4. Sales Footprint

            20.1.7.5. Strategy Overview

                20.1.7.5.1. Marketing Strategy

        20.1.8. Lohmann and Rauscher

            20.1.8.1. Overview

            20.1.8.2. Product Portfolio

            20.1.8.3. Profitability by Market Segments

            20.1.8.4. Sales Footprint

            20.1.8.5. Strategy Overview

                20.1.8.5.1. Marketing Strategy

        20.1.9. Wear Ease

            20.1.9.1. Overview

            20.1.9.2. Product Portfolio

            20.1.9.3. Profitability by Market Segments

            20.1.9.4. Sales Footprint

            20.1.9.5. Strategy Overview

                20.1.9.5.1. Marketing Strategy

        20.1.10. Peninsula BioMedical

            20.1.10.1. Overview

            20.1.10.2. Product Portfolio

            20.1.10.3. Profitability by Market Segments

            20.1.10.4. Sales Footprint

            20.1.10.5. Strategy Overview

                20.1.10.5.1. Marketing Strategy

        20.1.11. LympheDIVAs

            20.1.11.1. Overview

            20.1.11.2. Product Portfolio

            20.1.11.3. Profitability by Market Segments

            20.1.11.4. Sales Footprint

            20.1.11.5. Strategy Overview

                20.1.11.5.1. Marketing Strategy

        20.1.12. Juzo

            20.1.12.1. Overview

            20.1.12.2. Product Portfolio

            20.1.12.3. Profitability by Market Segments

            20.1.12.4. Sales Footprint

            20.1.12.5. Strategy Overview

                20.1.12.5.1. Marketing Strategy

        20.1.13. Medico International

            20.1.13.1. Overview

            20.1.13.2. Product Portfolio

            20.1.13.3. Profitability by Market Segments

            20.1.13.4. Sales Footprint

            20.1.13.5. Strategy Overview

                20.1.13.5.1. Marketing Strategy

        20.1.14. The Marena Group

            20.1.14.1. Overview

            20.1.14.2. Product Portfolio

            20.1.14.3. Profitability by Market Segments

            20.1.14.4. Sales Footprint

            20.1.14.5. Strategy Overview

                20.1.14.5.1. Marketing Strategy

        20.1.15. Essity

            20.1.15.1. Overview

            20.1.15.2. Product Portfolio

            20.1.15.3. Profitability by Market Segments

            20.1.15.4. Sales Footprint

            20.1.15.5. Strategy Overview

                20.1.15.5.1. Marketing Strategy

21. Assumptions & Acronyms Used

22. Research Methodology

Don't pay for what you don't need

Customize your report by selecting specific countries or regions and save 30%!

List of Tables

Table 1: Global Market Value (US$ Million) Forecast by Region, 2018 to 2033

Table 2: Global Market Value (US$ Million) Forecast by Gender, 2018 to 2033

Table 3: Global Market Value (US$ Million) Forecast by Product Type, 2018 to 2033

Table 4: Global Market Value (US$ Million) Forecast by Distribution Channel, 2018 to 2033

Table 5: Global Market Value (US$ Million) Forecast by Compression Delivery, 2018 to 2033

Table 6: Global Market Value (US$ Million) Forecast by Application, 2018 to 2033

Table 7: North America Market Value (US$ Million) Forecast by Country, 2018 to 2033

Table 8: North America Market Value (US$ Million) Forecast by Gender, 2018 to 2033

Table 9: North America Market Value (US$ Million) Forecast by Product Type, 2018 to 2033

Table 10: North America Market Value (US$ Million) Forecast by Distribution Channel, 2018 to 2033

Table 11: North America Market Value (US$ Million) Forecast by Compression Delivery, 2018 to 2033

Table 12: North America Market Value (US$ Million) Forecast by Application, 2018 to 2033

Table 13: Latin America Market Value (US$ Million) Forecast by Country, 2018 to 2033

Table 14: Latin America Market Value (US$ Million) Forecast by Gender, 2018 to 2033

Table 15: Latin America Market Value (US$ Million) Forecast by Product Type, 2018 to 2033

Table 16: Latin America Market Value (US$ Million) Forecast by Distribution Channel, 2018 to 2033

Table 17: Latin America Market Value (US$ Million) Forecast by Compression Delivery, 2018 to 2033

Table 18: Latin America Market Value (US$ Million) Forecast by Application, 2018 to 2033

Table 19: Western Europe Market Value (US$ Million) Forecast by Country, 2018 to 2033

Table 20: Western Europe Market Value (US$ Million) Forecast by Gender, 2018 to 2033

Table 21: Western Europe Market Value (US$ Million) Forecast by Product Type, 2018 to 2033

Table 22: Western Europe Market Value (US$ Million) Forecast by Distribution Channel, 2018 to 2033

Table 23: Western Europe Market Value (US$ Million) Forecast by Compression Delivery, 2018 to 2033

Table 24: Western Europe Market Value (US$ Million) Forecast by Application, 2018 to 2033

Table 25: Eastern Europe Market Value (US$ Million) Forecast by Country, 2018 to 2033

Table 26: Eastern Europe Market Value (US$ Million) Forecast by Gender, 2018 to 2033

Table 27: Eastern Europe Market Value (US$ Million) Forecast by Product Type, 2018 to 2033

Table 28: Eastern Europe Market Value (US$ Million) Forecast by Distribution Channel, 2018 to 2033

Table 29: Eastern Europe Market Value (US$ Million) Forecast by Compression Delivery, 2018 to 2033

Table 30: Eastern Europe Market Value (US$ Million) Forecast by Application, 2018 to 2033

Table 31: South Asia and Pacific Market Value (US$ Million) Forecast by Country, 2018 to 2033

Table 32: South Asia and Pacific Market Value (US$ Million) Forecast by Gender, 2018 to 2033

Table 33: South Asia and Pacific Market Value (US$ Million) Forecast by Product Type, 2018 to 2033

Table 34: South Asia and Pacific Market Value (US$ Million) Forecast by Distribution Channel, 2018 to 2033

Table 35: South Asia and Pacific Market Value (US$ Million) Forecast by Compression Delivery, 2018 to 2033

Table 36: South Asia and Pacific Market Value (US$ Million) Forecast by Application, 2018 to 2033

Table 37: East Asia Market Value (US$ Million) Forecast by Country, 2018 to 2033

Table 38: East Asia Market Value (US$ Million) Forecast by Gender, 2018 to 2033

Table 39: East Asia Market Value (US$ Million) Forecast by Product Type, 2018 to 2033

Table 40: East Asia Market Value (US$ Million) Forecast by Distribution Channel, 2018 to 2033

Table 41: East Asia Market Value (US$ Million) Forecast by Compression Delivery, 2018 to 2033

Table 42: East Asia Market Value (US$ Million) Forecast by Application, 2018 to 2033

Table 43: Middle East and Africa Market Value (US$ Million) Forecast by Country, 2018 to 2033

Table 44: Middle East and Africa Market Value (US$ Million) Forecast by Gender, 2018 to 2033

Table 45: Middle East and Africa Market Value (US$ Million) Forecast by Product Type, 2018 to 2033

Table 46: Middle East and Africa Market Value (US$ Million) Forecast by Distribution Channel, 2018 to 2033

Table 47: Middle East and Africa Market Value (US$ Million) Forecast by Compression Delivery, 2018 to 2033

Table 48: Middle East and Africa Market Value (US$ Million) Forecast by Application, 2018 to 2033
Sabyasachi Ghosh
Sabyasachi Ghosh

Principal Consultant

Talk to Analyst

Find your sweet spots for generating winning opportunities in this market.

List of Charts

Figure 1: Global Market Value (US$ Million) by Gender, 2023 to 2033

Figure 2: Global Market Value (US$ Million) by Product Type, 2023 to 2033

Figure 3: Global Market Value (US$ Million) by Distribution Channel, 2023 to 2033

Figure 4: Global Market Value (US$ Million) by Compression Delivery, 2023 to 2033

Figure 5: Global Market Value (US$ Million) by Application, 2023 to 2033

Figure 6: Global Market Value (US$ Million) by Region, 2023 to 2033

Figure 7: Global Market Value (US$ Million) Analysis by Region, 2018 to 2033

Figure 8: Global Market Value Share (%) and BPS Analysis by Region, 2023 to 2033

Figure 9: Global Market Y-o-Y Growth (%) Projections by Region, 2023 to 2033

Figure 10: Global Market Value (US$ Million) Analysis by Gender, 2018 to 2033

Figure 11: Global Market Value Share (%) and BPS Analysis by Gender, 2023 to 2033

Figure 12: Global Market Y-o-Y Growth (%) Projections by Gender, 2023 to 2033

Figure 13: Global Market Value (US$ Million) Analysis by Product Type, 2018 to 2033

Figure 14: Global Market Value Share (%) and BPS Analysis by Product Type, 2023 to 2033

Figure 15: Global Market Y-o-Y Growth (%) Projections by Product Type, 2023 to 2033

Figure 16: Global Market Value (US$ Million) Analysis by Distribution Channel, 2018 to 2033

Figure 17: Global Market Value Share (%) and BPS Analysis by Distribution Channel, 2023 to 2033

Figure 18: Global Market Y-o-Y Growth (%) Projections by Distribution Channel, 2023 to 2033

Figure 19: Global Market Value (US$ Million) Analysis by Compression Delivery, 2018 to 2033

Figure 20: Global Market Value Share (%) and BPS Analysis by Compression Delivery, 2023 to 2033

Figure 21: Global Market Y-o-Y Growth (%) Projections by Compression Delivery, 2023 to 2033

Figure 22: Global Market Value (US$ Million) Analysis by Application, 2018 to 2033

Figure 23: Global Market Value Share (%) and BPS Analysis by Application, 2023 to 2033

Figure 24: Global Market Y-o-Y Growth (%) Projections by Application, 2023 to 2033

Figure 25: Global Market Attractiveness by Gender, 2023 to 2033

Figure 26: Global Market Attractiveness by Product Type, 2023 to 2033

Figure 27: Global Market Attractiveness by Distribution Channel, 2023 to 2033

Figure 28: Global Market Attractiveness by Compression Delivery, 2023 to 2033

Figure 29: Global Market Attractiveness by Application, 2023 to 2033

Figure 30: Global Market Attractiveness by Region, 2023 to 2033

Figure 31: North America Market Value (US$ Million) by Gender, 2023 to 2033

Figure 32: North America Market Value (US$ Million) by Product Type, 2023 to 2033

Figure 33: North America Market Value (US$ Million) by Distribution Channel, 2023 to 2033

Figure 34: North America Market Value (US$ Million) by Compression Delivery, 2023 to 2033

Figure 35: North America Market Value (US$ Million) by Application, 2023 to 2033

Figure 36: North America Market Value (US$ Million) by Country, 2023 to 2033

Figure 37: North America Market Value (US$ Million) Analysis by Country, 2018 to 2033

Figure 38: North America Market Value Share (%) and BPS Analysis by Country, 2023 to 2033

Figure 39: North America Market Y-o-Y Growth (%) Projections by Country, 2023 to 2033

Figure 40: North America Market Value (US$ Million) Analysis by Gender, 2018 to 2033

Figure 41: North America Market Value Share (%) and BPS Analysis by Gender, 2023 to 2033

Figure 42: North America Market Y-o-Y Growth (%) Projections by Gender, 2023 to 2033

Figure 43: North America Market Value (US$ Million) Analysis by Product Type, 2018 to 2033

Figure 44: North America Market Value Share (%) and BPS Analysis by Product Type, 2023 to 2033

Figure 45: North America Market Y-o-Y Growth (%) Projections by Product Type, 2023 to 2033

Figure 46: North America Market Value (US$ Million) Analysis by Distribution Channel, 2018 to 2033

Figure 47: North America Market Value Share (%) and BPS Analysis by Distribution Channel, 2023 to 2033

Figure 48: North America Market Y-o-Y Growth (%) Projections by Distribution Channel, 2023 to 2033

Figure 49: North America Market Value (US$ Million) Analysis by Compression Delivery, 2018 to 2033

Figure 50: North America Market Value Share (%) and BPS Analysis by Compression Delivery, 2023 to 2033

Figure 51: North America Market Y-o-Y Growth (%) Projections by Compression Delivery, 2023 to 2033

Figure 52: North America Market Value (US$ Million) Analysis by Application, 2018 to 2033

Figure 53: North America Market Value Share (%) and BPS Analysis by Application, 2023 to 2033

Figure 54: North America Market Y-o-Y Growth (%) Projections by Application, 2023 to 2033

Figure 55: North America Market Attractiveness by Gender, 2023 to 2033

Figure 56: North America Market Attractiveness by Product Type, 2023 to 2033

Figure 57: North America Market Attractiveness by Distribution Channel, 2023 to 2033

Figure 58: North America Market Attractiveness by Compression Delivery, 2023 to 2033

Figure 59: North America Market Attractiveness by Application, 2023 to 2033

Figure 60: North America Market Attractiveness by Country, 2023 to 2033

Figure 61: Latin America Market Value (US$ Million) by Gender, 2023 to 2033

Figure 62: Latin America Market Value (US$ Million) by Product Type, 2023 to 2033

Figure 63: Latin America Market Value (US$ Million) by Distribution Channel, 2023 to 2033

Figure 64: Latin America Market Value (US$ Million) by Compression Delivery, 2023 to 2033

Figure 65: Latin America Market Value (US$ Million) by Application, 2023 to 2033

Figure 66: Latin America Market Value (US$ Million) by Country, 2023 to 2033

Figure 67: Latin America Market Value (US$ Million) Analysis by Country, 2018 to 2033

Figure 68: Latin America Market Value Share (%) and BPS Analysis by Country, 2023 to 2033

Figure 69: Latin America Market Y-o-Y Growth (%) Projections by Country, 2023 to 2033

Figure 70: Latin America Market Value (US$ Million) Analysis by Gender, 2018 to 2033

Figure 71: Latin America Market Value Share (%) and BPS Analysis by Gender, 2023 to 2033

Figure 72: Latin America Market Y-o-Y Growth (%) Projections by Gender, 2023 to 2033

Figure 73: Latin America Market Value (US$ Million) Analysis by Product Type, 2018 to 2033

Figure 74: Latin America Market Value Share (%) and BPS Analysis by Product Type, 2023 to 2033

Figure 75: Latin America Market Y-o-Y Growth (%) Projections by Product Type, 2023 to 2033

Figure 76: Latin America Market Value (US$ Million) Analysis by Distribution Channel, 2018 to 2033

Figure 77: Latin America Market Value Share (%) and BPS Analysis by Distribution Channel, 2023 to 2033

Figure 78: Latin America Market Y-o-Y Growth (%) Projections by Distribution Channel, 2023 to 2033

Figure 79: Latin America Market Value (US$ Million) Analysis by Compression Delivery, 2018 to 2033

Figure 80: Latin America Market Value Share (%) and BPS Analysis by Compression Delivery, 2023 to 2033

Figure 81: Latin America Market Y-o-Y Growth (%) Projections by Compression Delivery, 2023 to 2033

Figure 82: Latin America Market Value (US$ Million) Analysis by Application, 2018 to 2033

Figure 83: Latin America Market Value Share (%) and BPS Analysis by Application, 2023 to 2033

Figure 84: Latin America Market Y-o-Y Growth (%) Projections by Application, 2023 to 2033

Figure 85: Latin America Market Attractiveness by Gender, 2023 to 2033

Figure 86: Latin America Market Attractiveness by Product Type, 2023 to 2033

Figure 87: Latin America Market Attractiveness by Distribution Channel, 2023 to 2033

Figure 88: Latin America Market Attractiveness by Compression Delivery, 2023 to 2033

Figure 89: Latin America Market Attractiveness by Application, 2023 to 2033

Figure 90: Latin America Market Attractiveness by Country, 2023 to 2033

Figure 91: Western Europe Market Value (US$ Million) by Gender, 2023 to 2033

Figure 92: Western Europe Market Value (US$ Million) by Product Type, 2023 to 2033

Figure 93: Western Europe Market Value (US$ Million) by Distribution Channel, 2023 to 2033

Figure 94: Western Europe Market Value (US$ Million) by Compression Delivery, 2023 to 2033

Figure 95: Western Europe Market Value (US$ Million) by Application, 2023 to 2033

Figure 96: Western Europe Market Value (US$ Million) by Country, 2023 to 2033

Figure 97: Western Europe Market Value (US$ Million) Analysis by Country, 2018 to 2033

Figure 98: Western Europe Market Value Share (%) and BPS Analysis by Country, 2023 to 2033

Figure 99: Western Europe Market Y-o-Y Growth (%) Projections by Country, 2023 to 2033

Figure 100: Western Europe Market Value (US$ Million) Analysis by Gender, 2018 to 2033

Figure 101: Western Europe Market Value Share (%) and BPS Analysis by Gender, 2023 to 2033

Figure 102: Western Europe Market Y-o-Y Growth (%) Projections by Gender, 2023 to 2033

Figure 103: Western Europe Market Value (US$ Million) Analysis by Product Type, 2018 to 2033

Figure 104: Western Europe Market Value Share (%) and BPS Analysis by Product Type, 2023 to 2033

Figure 105: Western Europe Market Y-o-Y Growth (%) Projections by Product Type, 2023 to 2033

Figure 106: Western Europe Market Value (US$ Million) Analysis by Distribution Channel, 2018 to 2033

Figure 107: Western Europe Market Value Share (%) and BPS Analysis by Distribution Channel, 2023 to 2033

Figure 108: Western Europe Market Y-o-Y Growth (%) Projections by Distribution Channel, 2023 to 2033

Figure 109: Western Europe Market Value (US$ Million) Analysis by Compression Delivery, 2018 to 2033

Figure 110: Western Europe Market Value Share (%) and BPS Analysis by Compression Delivery, 2023 to 2033

Figure 111: Western Europe Market Y-o-Y Growth (%) Projections by Compression Delivery, 2023 to 2033

Figure 112: Western Europe Market Value (US$ Million) Analysis by Application, 2018 to 2033

Figure 113: Western Europe Market Value Share (%) and BPS Analysis by Application, 2023 to 2033

Figure 114: Western Europe Market Y-o-Y Growth (%) Projections by Application, 2023 to 2033

Figure 115: Western Europe Market Attractiveness by Gender, 2023 to 2033

Figure 116: Western Europe Market Attractiveness by Product Type, 2023 to 2033

Figure 117: Western Europe Market Attractiveness by Distribution Channel, 2023 to 2033

Figure 118: Western Europe Market Attractiveness by Compression Delivery, 2023 to 2033

Figure 119: Western Europe Market Attractiveness by Application, 2023 to 2033

Figure 120: Western Europe Market Attractiveness by Country, 2023 to 2033

Figure 121: Eastern Europe Market Value (US$ Million) by Gender, 2023 to 2033

Figure 122: Eastern Europe Market Value (US$ Million) by Product Type, 2023 to 2033

Figure 123: Eastern Europe Market Value (US$ Million) by Distribution Channel, 2023 to 2033

Figure 124: Eastern Europe Market Value (US$ Million) by Compression Delivery, 2023 to 2033

Figure 125: Eastern Europe Market Value (US$ Million) by Application, 2023 to 2033

Figure 126: Eastern Europe Market Value (US$ Million) by Country, 2023 to 2033

Figure 127: Eastern Europe Market Value (US$ Million) Analysis by Country, 2018 to 2033

Figure 128: Eastern Europe Market Value Share (%) and BPS Analysis by Country, 2023 to 2033

Figure 129: Eastern Europe Market Y-o-Y Growth (%) Projections by Country, 2023 to 2033

Figure 130: Eastern Europe Market Value (US$ Million) Analysis by Gender, 2018 to 2033

Figure 131: Eastern Europe Market Value Share (%) and BPS Analysis by Gender, 2023 to 2033

Figure 132: Eastern Europe Market Y-o-Y Growth (%) Projections by Gender, 2023 to 2033

Figure 133: Eastern Europe Market Value (US$ Million) Analysis by Product Type, 2018 to 2033

Figure 134: Eastern Europe Market Value Share (%) and BPS Analysis by Product Type, 2023 to 2033

Figure 135: Eastern Europe Market Y-o-Y Growth (%) Projections by Product Type, 2023 to 2033

Figure 136: Eastern Europe Market Value (US$ Million) Analysis by Distribution Channel, 2018 to 2033

Figure 137: Eastern Europe Market Value Share (%) and BPS Analysis by Distribution Channel, 2023 to 2033

Figure 138: Eastern Europe Market Y-o-Y Growth (%) Projections by Distribution Channel, 2023 to 2033

Figure 139: Eastern Europe Market Value (US$ Million) Analysis by Compression Delivery, 2018 to 2033

Figure 140: Eastern Europe Market Value Share (%) and BPS Analysis by Compression Delivery, 2023 to 2033

Figure 141: Eastern Europe Market Y-o-Y Growth (%) Projections by Compression Delivery, 2023 to 2033

Figure 142: Eastern Europe Market Value (US$ Million) Analysis by Application, 2018 to 2033

Figure 143: Eastern Europe Market Value Share (%) and BPS Analysis by Application, 2023 to 2033

Figure 144: Eastern Europe Market Y-o-Y Growth (%) Projections by Application, 2023 to 2033

Figure 145: Eastern Europe Market Attractiveness by Gender, 2023 to 2033

Figure 146: Eastern Europe Market Attractiveness by Product Type, 2023 to 2033

Figure 147: Eastern Europe Market Attractiveness by Distribution Channel, 2023 to 2033

Figure 148: Eastern Europe Market Attractiveness by Compression Delivery, 2023 to 2033

Figure 149: Eastern Europe Market Attractiveness by Application, 2023 to 2033

Figure 150: Eastern Europe Market Attractiveness by Country, 2023 to 2033

Figure 151: South Asia and Pacific Market Value (US$ Million) by Gender, 2023 to 2033

Figure 152: South Asia and Pacific Market Value (US$ Million) by Product Type, 2023 to 2033

Figure 153: South Asia and Pacific Market Value (US$ Million) by Distribution Channel, 2023 to 2033

Figure 154: South Asia and Pacific Market Value (US$ Million) by Compression Delivery, 2023 to 2033

Figure 155: South Asia and Pacific Market Value (US$ Million) by Application, 2023 to 2033

Figure 156: South Asia and Pacific Market Value (US$ Million) by Country, 2023 to 2033

Figure 157: South Asia and Pacific Market Value (US$ Million) Analysis by Country, 2018 to 2033

Figure 158: South Asia and Pacific Market Value Share (%) and BPS Analysis by Country, 2023 to 2033

Figure 159: South Asia and Pacific Market Y-o-Y Growth (%) Projections by Country, 2023 to 2033

Figure 160: South Asia and Pacific Market Value (US$ Million) Analysis by Gender, 2018 to 2033

Figure 161: South Asia and Pacific Market Value Share (%) and BPS Analysis by Gender, 2023 to 2033

Figure 162: South Asia and Pacific Market Y-o-Y Growth (%) Projections by Gender, 2023 to 2033

Figure 163: South Asia and Pacific Market Value (US$ Million) Analysis by Product Type, 2018 to 2033

Figure 164: South Asia and Pacific Market Value Share (%) and BPS Analysis by Product Type, 2023 to 2033

Figure 165: South Asia and Pacific Market Y-o-Y Growth (%) Projections by Product Type, 2023 to 2033

Figure 166: South Asia and Pacific Market Value (US$ Million) Analysis by Distribution Channel, 2018 to 2033

Figure 167: South Asia and Pacific Market Value Share (%) and BPS Analysis by Distribution Channel, 2023 to 2033

Figure 168: South Asia and Pacific Market Y-o-Y Growth (%) Projections by Distribution Channel, 2023 to 2033

Figure 169: South Asia and Pacific Market Value (US$ Million) Analysis by Compression Delivery, 2018 to 2033

Figure 170: South Asia and Pacific Market Value Share (%) and BPS Analysis by Compression Delivery, 2023 to 2033

Figure 171: South Asia and Pacific Market Y-o-Y Growth (%) Projections by Compression Delivery, 2023 to 2033

Figure 172: South Asia and Pacific Market Value (US$ Million) Analysis by Application, 2018 to 2033

Figure 173: South Asia and Pacific Market Value Share (%) and BPS Analysis by Application, 2023 to 2033

Figure 174: South Asia and Pacific Market Y-o-Y Growth (%) Projections by Application, 2023 to 2033

Figure 175: South Asia and Pacific Market Attractiveness by Gender, 2023 to 2033

Figure 176: South Asia and Pacific Market Attractiveness by Product Type, 2023 to 2033

Figure 177: South Asia and Pacific Market Attractiveness by Distribution Channel, 2023 to 2033

Figure 178: South Asia and Pacific Market Attractiveness by Compression Delivery, 2023 to 2033

Figure 179: South Asia and Pacific Market Attractiveness by Application, 2023 to 2033

Figure 180: South Asia and Pacific Market Attractiveness by Country, 2023 to 2033

Figure 181: East Asia Market Value (US$ Million) by Gender, 2023 to 2033

Figure 182: East Asia Market Value (US$ Million) by Product Type, 2023 to 2033

Figure 183: East Asia Market Value (US$ Million) by Distribution Channel, 2023 to 2033

Figure 184: East Asia Market Value (US$ Million) by Compression Delivery, 2023 to 2033

Figure 185: East Asia Market Value (US$ Million) by Application, 2023 to 2033

Figure 186: East Asia Market Value (US$ Million) by Country, 2023 to 2033

Figure 187: East Asia Market Value (US$ Million) Analysis by Country, 2018 to 2033

Figure 188: East Asia Market Value Share (%) and BPS Analysis by Country, 2023 to 2033

Figure 189: East Asia Market Y-o-Y Growth (%) Projections by Country, 2023 to 2033

Figure 190: East Asia Market Value (US$ Million) Analysis by Gender, 2018 to 2033

Figure 191: East Asia Market Value Share (%) and BPS Analysis by Gender, 2023 to 2033

Figure 192: East Asia Market Y-o-Y Growth (%) Projections by Gender, 2023 to 2033

Figure 193: East Asia Market Value (US$ Million) Analysis by Product Type, 2018 to 2033

Figure 194: East Asia Market Value Share (%) and BPS Analysis by Product Type, 2023 to 2033

Figure 195: East Asia Market Y-o-Y Growth (%) Projections by Product Type, 2023 to 2033

Figure 196: East Asia Market Value (US$ Million) Analysis by Distribution Channel, 2018 to 2033

Figure 197: East Asia Market Value Share (%) and BPS Analysis by Distribution Channel, 2023 to 2033

Figure 198: East Asia Market Y-o-Y Growth (%) Projections by Distribution Channel, 2023 to 2033

Figure 199: East Asia Market Value (US$ Million) Analysis by Compression Delivery, 2018 to 2033

Figure 200: East Asia Market Value Share (%) and BPS Analysis by Compression Delivery, 2023 to 2033

Figure 201: East Asia Market Y-o-Y Growth (%) Projections by Compression Delivery, 2023 to 2033

Figure 202: East Asia Market Value (US$ Million) Analysis by Application, 2018 to 2033

Figure 203: East Asia Market Value Share (%) and BPS Analysis by Application, 2023 to 2033

Figure 204: East Asia Market Y-o-Y Growth (%) Projections by Application, 2023 to 2033

Figure 205: East Asia Market Attractiveness by Gender, 2023 to 2033

Figure 206: East Asia Market Attractiveness by Product Type, 2023 to 2033

Figure 207: East Asia Market Attractiveness by Distribution Channel, 2023 to 2033

Figure 208: East Asia Market Attractiveness by Compression Delivery, 2023 to 2033

Figure 209: East Asia Market Attractiveness by Application, 2023 to 2033

Figure 210: East Asia Market Attractiveness by Country, 2023 to 2033

Figure 211: Middle East and Africa Market Value (US$ Million) by Gender, 2023 to 2033

Figure 212: Middle East and Africa Market Value (US$ Million) by Product Type, 2023 to 2033

Figure 213: Middle East and Africa Market Value (US$ Million) by Distribution Channel, 2023 to 2033

Figure 214: Middle East and Africa Market Value (US$ Million) by Compression Delivery, 2023 to 2033

Figure 215: Middle East and Africa Market Value (US$ Million) by Application, 2023 to 2033

Figure 216: Middle East and Africa Market Value (US$ Million) by Country, 2023 to 2033

Figure 217: Middle East and Africa Market Value (US$ Million) Analysis by Country, 2018 to 2033

Figure 218: Middle East and Africa Market Value Share (%) and BPS Analysis by Country, 2023 to 2033

Figure 219: Middle East and Africa Market Y-o-Y Growth (%) Projections by Country, 2023 to 2033

Figure 220: Middle East and Africa Market Value (US$ Million) Analysis by Gender, 2018 to 2033

Figure 221: Middle East and Africa Market Value Share (%) and BPS Analysis by Gender, 2023 to 2033

Figure 222: Middle East and Africa Market Y-o-Y Growth (%) Projections by Gender, 2023 to 2033

Figure 223: Middle East and Africa Market Value (US$ Million) Analysis by Product Type, 2018 to 2033

Figure 224: Middle East and Africa Market Value Share (%) and BPS Analysis by Product Type, 2023 to 2033

Figure 225: Middle East and Africa Market Y-o-Y Growth (%) Projections by Product Type, 2023 to 2033

Figure 226: Middle East and Africa Market Value (US$ Million) Analysis by Distribution Channel, 2018 to 2033

Figure 227: Middle East and Africa Market Value Share (%) and BPS Analysis by Distribution Channel, 2023 to 2033

Figure 228: Middle East and Africa Market Y-o-Y Growth (%) Projections by Distribution Channel, 2023 to 2033

Figure 229: Middle East and Africa Market Value (US$ Million) Analysis by Compression Delivery, 2018 to 2033

Figure 230: Middle East and Africa Market Value Share (%) and BPS Analysis by Compression Delivery, 2023 to 2033

Figure 231: Middle East and Africa Market Y-o-Y Growth (%) Projections by Compression Delivery, 2023 to 2033

Figure 232: Middle East and Africa Market Value (US$ Million) Analysis by Application, 2018 to 2033

Figure 233: Middle East and Africa Market Value Share (%) and BPS Analysis by Application, 2023 to 2033

Figure 234: Middle East and Africa Market Y-o-Y Growth (%) Projections by Application, 2023 to 2033

Figure 235: Middle East and Africa Market Attractiveness by Gender, 2023 to 2033

Figure 236: Middle East and Africa Market Attractiveness by Product Type, 2023 to 2033

Figure 237: Middle East and Africa Market Attractiveness by Distribution Channel, 2023 to 2033

Figure 238: Middle East and Africa Market Attractiveness by Compression Delivery, 2023 to 2033

Figure 239: Middle East and Africa Market Attractiveness by Application, 2023 to 2033

Figure 240: Middle East and Africa Market Attractiveness by Country, 2023 to 2033

Recommendations

Healthcare

Compression Therapy Market

Published : July 2022

Healthcare

Compression Garments and Stockings Market

Published : June 2022

Explore Healthcare Insights

View Reports

Compression Garments Market