Reports

- Global Locations -

Headquarters

Future Market Insights, Inc.

Christiana Corporate, 200
Continental Drive, Suite 401,
Newark, Delaware - 19713,
United States

T: +1-845-579-5705

Americas

Future Market Insights, Inc.

616 Corporate Way, Suite 2-9018,
Valley Cottage, NY 10989, United States

T: +1-347-918-3531

MEA

Future Market Insights

1602-6 Jumeirah Bay X2 Tower, Plot No: JLT-PH2-X2A,
Jumeirah Lakes Towers, Dubai,
United Arab Emirates

Europe

Future Market Insights

3rd Floor, 207 Regent Street,
W1B 3HH London
United Kingdom

T: + 44 (0) 20 8123 9659
D: +44 (0) 20 3287 4268

Asia Pacific

Future Market Insights

IndiaLand Global Tech Park, Unit UG-1, Behind Grand HighStreet, Phase 1, Hinjawadi, MH, Pune – 411057, India

Compression Products Market Outlook (2024 to 2034)

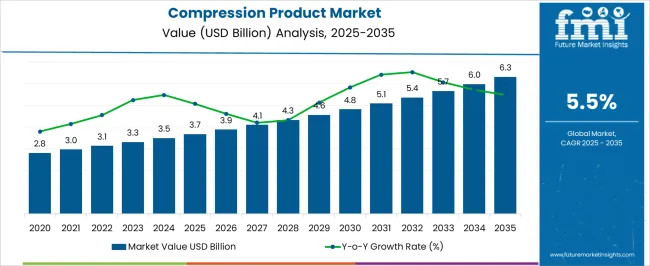
The global compression product market size is projected to surpass a valuation of US$ 6,492 million by 2034. As per the analysis, the compression product market is likely to exhibit a CAGR of 5.8% through 2034, with a current valuation of US$ 3.673.4 million in 2024.

Key Market Highlights

Targeting Corporate Wellness Programs Can Lead to Bulk Sales and Partnerships

Focusing on corporate wellness initiatives offers a strategic opportunity for joint ventures and large-scale sales. Companies can tap into a substantial market by presenting compression products as an essential part of workplace health programs. Tailored products for business customers and informative workshops about the advantages of compression apparel can lead to win-win collaborations that advance worker health and generate significant revenue.

Emergence of Smart Compression Wearable Marks a Paradigm Shift

A paradigm change has occurred with the introduction of smart compression wearables, which incorporate cutting-edge sensor technology and communication capabilities into compression goods. This strategic approach capitalizes on the rising demand for health-centric ICT solutions by providing customers with real-time performance data and tailored health information.

By adding IoT capabilities, companies can present their compression wear as essential parts of the larger digital health and fitness ecosystem rather than merely clothing. This gives them a competitive advantage and allows them to reach a tech-savvy consumer base.

Attributes Details
Compression Product Market Valuation, 2023 US$ 3,477.9 million
Compression Product Market Size in 2024 US$ 3,673.4 million
Compression Product Market Forecast Size by 2034 US$ 6,492 million
Projected CAGR (2024 to 2034) 5.8%
Market Share of Top 5 Countries 53.9%

Don't pay for what you don't need

Customize your report by selecting specific countries or regions and save 30%!

Historical Performance of the Compression Product Market (2019 to 2023) Vs Future Outlook (2024 to 2034)

Attributes Details
Compression Product Market Size (2019) US$ 2,847.1 million
Compression Product Market Size (2023) US$ 3,477.9 million
Compression Product Market CAGR (2019 to 2023) 4.8%

The compression product market size is anticipated to be worth US$ 6,492 million by 2034. Historically, the global compression product market recorded a CAGR of 4.8% from 2019 to 2023.

The aging population of the world, which is particularly susceptible to age-related muscular issues and the prevalence of illnesses like lymphedema, bolsters industry expansion. The global trend toward fitness in modern civilization and people's general concern for their physical and mental health also drive the market's potential worldwide. The increased public awareness is helping the compressed product industry develop a solid and stable foundation.

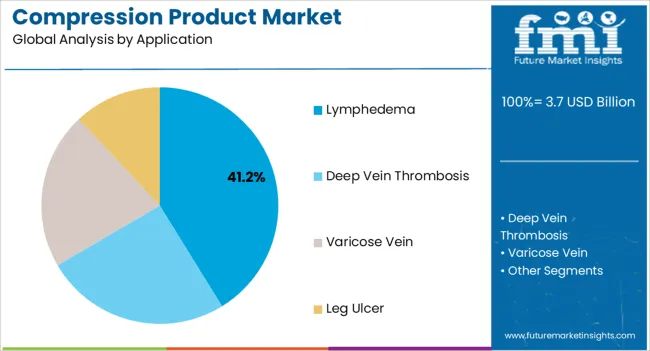
Lymphatic and venous disorders are becoming increasingly prevalent. Variables affecting these conditions' development include varicose veins, pregnancy, past deep vein thrombosis, and immobility. Conditions including chronic venous insufficiency, breast cancer, and procedures can also result in lymphatic issues. As a result, the prevalence of chronic illnesses is predicted to rise, and people are becoming more aware of advanced treatments like compression garments and other items.

The demand for compression products is also being driven in part by increased obesity rates. Obesity has several side effects, one of which is circulation-related foot edema. According to WHO reports, childhood obesity is common in this age range as well. This benefits the industry by increasing the quantity of products produced and distributed.

It is challenging to treat conditions like lymphedema and venous leg ulcers. The expansion of product use as an effective treatment option and product innovation have been identified as two primary compression therapy industry trends. Clinical studies have shown that this treatment can speed up the healing of venous leg ulcers (VLUs) and lower their incidence of recurrence. Additionally, lymphedema is successfully treated. A growing number of distinctive products are being presented to the market due to significant research initiatives in product development by major market competitors.

Opportunities for Businesses Operating in the Global Compression Products Market

  • Creating compression apparel that is adaptable and customized for people with certain physical limitations fills a need-based niche. Through partnerships with medical specialists and the integration of adaptable features, companies can create commodities that improve the lives of people with physical disabilities.
  • A strategic approach to market growth is the implementation of specialized marketing efforts that consider regional preferences, cultural quirks, and particular athletic compression gear market trends. Adapting marketing tactics to successfully connect with a range of consumer bases across geographies improves the authenticity and connection of a brand.
  • Establishing joint ventures with unconventional partners, such as software firms or fashion designers, is a creative way to develop new products and boost brand awareness. Through using the knowledge and customer base of partners from other sectors, companies can develop distinctive, game-changing products that seamlessly combine practicality and design.
  • Integrating compression product data with well-known health and fitness applications provides deliberate synergy between technology and wellness. Businesses can raise the perceived value of their goods by enabling consumers to easily measure and assess the impact of the compression wear industry on their overall well-being.
  • Employing eco-friendly packaging options in sustainability projects shows a dedication to environmental responsibility. Businesses can boost their brand reputation and fit with the beliefs of environmentally aware consumers by using sustainable packaging methods.
Sabyasachi Ghosh
Sabyasachi Ghosh

Principal Consultant

Talk to Analyst

Find your sweet spots for generating winning opportunities in this market.

Factors Restraining the Growth of the Compression Products Market

  • The market for compression products is expected to experience sluggish expansion in developing nations due to a lack of understanding of compression as a therapeutic alternative for the management of lymphatic and venous problems.
  • A significant obstacle to the market's expansion is the expensive cost of these devices, notably the compression pumps. For those who need to regulate the amount of fluid in their legs, encourage lymph drainage, and lessen pain and suffering, leg compression pumps may be of great assistance. Compression pumps are expensive to purchase because of their high production costs.
  • There are several treatment options for chronic venous diseases (including chronic deep vein thrombosis, varicose and spider veins, swelling and pain, and ulcers) , including operations, ablation methods, sclerotherapy, and ligation. These can limit product adoption.
  • Even though compression treatment is frequently the first-line diagnosis for numerous illnesses, plenty of alternative therapies offer advantages over compression therapy, such as fewer or no side effects, reduced discomfort before and after therapy, and a shorter hospital stay. Furthermore, compared to compression therapy, these complementary therapies target the full disease rather than just its symptoms. For example, varicose veins are commonly treated with radiofrequency and laser ablation.

Comparative View of Market Adjacent to Compression Product

This section compares two markets: the Compression Garment Market and the Radial Compression Devices Market. As per the analysis, the expanding geriatric population and their age-related health concerns drive sales across the mentioned markets. As the global elderly population expands, the demand across these markets is bound to rise. The surging prevalence of obesity is another factor bolstering expansion across the markets.

The rise of e-commerce is leading to a surge in demand across these markets. Online platforms offer increased convenience by adopting advanced technologies like AR to launch virtual try-ons and other features. The e-commerce sector’s growth is likely to be a key factor boosting expansion across the mentioned markets.

Compression Product Market:

Attributes Compression Product Market
CAGR (2024 to 2034) 5.8%
Growth Factors
  • Growing awareness of health and wellness.
  • Rising sports and fitness trends.
Future Opportunities Increased sales through e-commerce growth.
Market Trends Increasing demand from the aging population.

Compression Garment Market:

Attributes Compression Garment Market
CAGR (2024 to 2034) 5.2%
Growth Factors
  • Rising developments in garment designs and fabric technology.
  • Increasing adoption by the surging geriatric population.
Future Opportunities Development and growth of the healthcare industry.
Market Trends Increasing cases of obesity.

Radial Compression Devices Market:

Attributes Radial Compression Devices Market
CAGR (2024 to 2034) 8.9%
Growth Factors
  • Surging prevalence of cardiovascular diseases.
  • Rising introduction of products with improved designs.
Future Opportunities Rise in adoption of percutaneous coronary intervention.
Market Trends Expanding geriatric population.

Get the data you need at a Fraction of the cost

Personalize your report by choosing insights you need
and save 40%!

Country Wise Insights

Countries Value CAGR (2024 to 2034)
United States 6.0%
China 5.2%
Canada 5.0%
India 6.2%
Germany 5.0%

Rising Focus on Post-surgical Rehabilitation Drives Sales in the United States

The demand for compression products market in the United States is estimated to rise at a 6.0% CAGR through 2034. The growing emphasis on post-surgical rehabilitation is an important aspect driving the market's expansion. The advantages of compression garments in post-surgical recovery are consistent with the focus placed by the American healthcare system on effective and efficient rehabilitation procedures.

Medical and consumer demand is being driven by the recommendation of compression goods by healthcare professionals and surgeons as essential elements of rehabilitation programs. Compression apparel is positioned as a critical component of the continuum of treatment because of its strategic connection with healthcare practices. For the country's manufacturers of compressed garments, this offers profitable opportunities. This factor is anticipated to generate significant incremental opportunities in the United States and rising online compression product sales.

E-commerce Dominance and Digital Engagement Nurtures Growth in China

The sales of compression products market in China are projected to surge at a 5.2% CAGR through 2034. China's e-commerce supremacy and extensive adoption of digital platforms are critical to market development. Alibaba and JD.com, for example, offer a wide online marketplace for compression equipment. Companies that engage Chinese customers through sophisticated digital marketing techniques, social commerce, and live-streaming thrive in the country's digital economy, driving sales and market reach.

Aging Population and Active Aging Trends Drive Sales in Canada

The compression product market size in Canada is anticipated to develop at a 5.0% CAGR through 2034. The aging population of Canada, as well as a parallel trend of active aging, are significant factors of market development. Compression gear that improves joint health lowers muscle fatigue, and assists in recovery is in high demand as the demographic landscape swings towards older customers who prioritize health and fitness. Companies that properly match their marketing tactics with the active aging narrative capture a rising market niche, contributing to sustained demand.

Rising Middle-Class Aspirations for Health and Fitness Bolster Growth in India

The demand for compression product market in India is estimated to rise at a 6.2% CAGR through 2034. The growing desires of India's emerging middle class for health and fitness are key elements driving market development. As disposable income rises, so does the proclivity to invest in health and wellness items such as compression gear. Companies profiting from this trend intentionally coordinate their marketing efforts to promote compression apparel as a vital component of a contemporary, healthy lifestyle, appealing to the aspirational customer attitude.

Orthopaedic and Rehabilitation Partnerships Drive Sales in Germany

The sales of compression product market in Germany are projected to surge at a 5.0% CAGR through 2034. Partnerships with orthopedic specialists and rehabilitation institutes are a distinct aspect impacting market progress in Germany. Companies that work with healthcare professionals actively market compression gear as an important part of orthopedic care and post-surgery recovery. This strategic connection boosts product credibility and builds confidence among customers looking for medically backed solutions, resulting in long-term market growth. DKOU 2023, the largest medical congress for orthopedics and trauma surgery, was hosted in Germany in October 2023, where more than 12,000 global healthcare professionals participated. Several partnerships are anticipated to arise with this meeting in the near future.

Category Wise Insights

Performance Enhancement in Athletics Surges Demand for Compression Garments

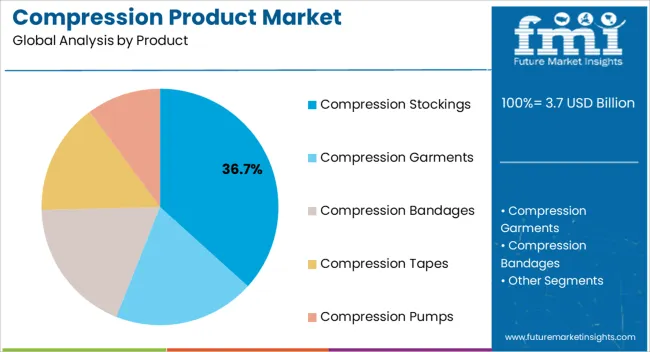
Segment Compression Garments (Product Type)
Value Share (2024) 36.2%

Compression garments are growing increasingly popular among athletes and fitness enthusiasts as a way to improve performance. These clothes are intended to provide total muscular support during physical activity, decrease muscle vibration, and promote blood circulation. Compression garments are becoming increasingly popular as essential activewear because of the growing global interest in sports and fitness.

The rise in popularity of compression garments, particularly in the athleisure industry, can be attributed to the combination of design and practicality. Manufacturers have created fashionable and fashionable compression garment styles in response to consumer desires. Demand is being fueled by the allure of compression clothing trends such as performance gear and style statements, especially for individuals looking for sportswear that can be worn from the gym to regular settings.

Strategic Partnerships with Healthcare Providers Boosts Dominance of Pharmacies

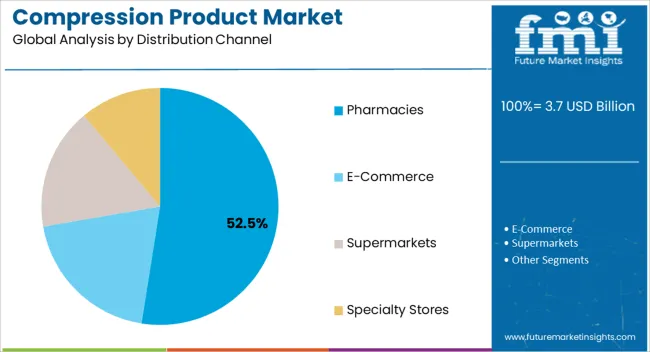
Segment Pharmacies (Distribution Channel)
Value Share (2024) 35.9%

Pharmacies frequently collaborate strategically with hospitals, clinics, and other healthcare organizations. These collaborations can include cooperative healthcare services, pooled educational programs, and coordinated marketing campaigns. By presenting pharmacies as auxiliary parts of the larger healthcare system, these partnerships boost their reputation and draw in customers looking for compression garments and other healthcare solutions. The growth in demand within pharmacies is partly attributed to this strategic positioning.
Competitive Landscape

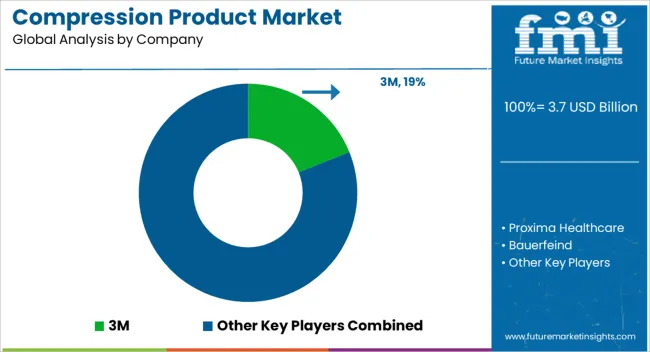
Companies that sell compression products are actively attempting to enhance their positions through the introduction of new products and the approval of both existing and up-and-coming market participants. The product launch and approvals speed up the manufacturer's plan to take advantage of the market share and gain a sizable market share. This market is poised to have a significant influence. It is anticipated to boost sales of compression goods as the key players concentrate on organic expansion by bolstering their product portfolios.

Recent Developments

  • The famous compression sock brand Comrad Socks launched their newest creation, the Infrared Recovery Compression Socks, in October 2023. These socks are a bold move into the future of the compression wear industry, built with enhanced circulation advantages in mind.
  • The latest version of the renowned Normatec series, Normatec 3 by Hyperice, was unveiled in June 2022 by the international high-performance wellness brand Hyperice. It employs dynamic air compression to promote everyday health and aid quicker recovery, better training, and optimal performance.
  • In May 2022, Stryker introduced its EasyFuseTM Dynamic Compression System. Stryker's innovative foot and ankle staple system is made from nitinol, a nickel-titanium alloy metal that is well-known for its strength and shape recovery. Its goals are to deliver robust dynamic-compression implants, lessen surgical complexity, and save waste in the operating theater.

Report Scope as per Compression Product Industry Analysis

Attribute Details
Forecast Period 2024 to 2034
Historical Data Available for 2019 to 2023
Market Analysis US$ Million for Value
Key Regions Covered North America, Latin America, Europe, East Asia, South Asia, Oceania, and Middle East & Africa (MEA).
Key Countries Covered United States, Canada, Brazil, Mexico, Argentina, Rest of Latin America, United Kingdom, Germany, Italy, Russia, Spain, France, BENELUX, Rest of Europe, Japan, China, South Korea, India, Thailand, Indonesia, Malaysia, Australia, New Zealand, Turkey, GCC, South Africa, North Africa and Rest of MEA.
Key Market Segments Covered Product, application, distribution channel, and region
Key Companies Profiled
  • Proxima Healthcare
  • 3M
  • Bauerfeind
  • Macom Enterprises
  • Leonisa
  • LIPOELASTIC
  • Cosmac Healthcare
  • Lohmann and Rauscher
  • Wear Ease
  • Peninsula BioMedical
  • LympheDIVAs
  • Juzo
  • Medico International
  • The Marena Group
  • Smith & Nephew plc
  • Spectrum Healthcare
  • Bio Compression Systems Inc
  • Gottfried Medical Inc.
  • Cardinal Health
Pricing Available upon Request

Key Segments Covered in Compression Products Industry Research

By Product:

  • Compression Garments
  • Compression Stockings
  • Compression Bandages
  • Compression Tapes
  • Compression Pumps

By Application:

  • Lymphedema
  • Deep Vein Thrombosis
  • Varicose Vein
  • Leg Ulcer

By Distribution Channel:

  • Pharmacies
  • E-Commerce
  • Supermarkets
  • Specialty Stores

By Region:

  • North America
  • Latin America
  • Europe
  • East Asia
  • South Asia
  • Oceania
  • Middle East and Africa (MEA)

Frequently Asked Questions

How Big is the Compression Product Market?

The global market is worth US$ 3,673.4 million in 2024.

What is the Sales Forecast for Compression Product Market through 2034?

The market is expected to reach US$ 6,492 million by 2034 at a CAGR of 5.8%.

What are the Trends Driving the Global Compression Product Market?

The growing adoption of compression garments in venous disorder management and product advancements are key trends in this market.

Which Region has the Leading Market Share in the Global Compression Product Market?

The North American region holds a dominant market share of about 35.3% in 2024.

What was the Historic Periods’ CAGR?

From 2019 to 2023, the market for compression products expanded at the rate of 4.8%.

What are the Key Market Statistics for China in the Global Market?

The compression product market in China will expand at a 5.2% CAGR through 2034.

What is the Outlook for Germany in the Global Market?

The compression product market in Germany will expand at a 5.0% CAGR through 2034.

Table of Content

1. Executive Summary

    1.1. Global Market Outlook

    1.2. Demand Side Trends

    1.3. Supply Side Trends

    1.4. Market Round Offs

    1.5. FMI Analysis and Recommendations

2. Market Overview

    2.1. Market Coverage / Taxonomy

    2.2. Market Definition / Scope / Limitations

    2.3. Inclusions/Exclusions

3. Brand Mapping Analysis

    3.1. Price v/s Product

    3.2. Value for Money

    3.3. Top of Mind Compression Products

    3.4. Brand Portfolio-by Key Players

    3.5. Brand Loyalty Mapping

    3.6. Usage Pattern Overview

    3.7. Branded vs Unbranded-Market Mix

4. Distribution Channel Wise Key Brand Positioning

    4.1. Global Top Retailers and their Brand Offerings

        4.1.1. Pharmacies

        4.1.2. E-Commerce

        4.1.3. Supermarkets

        4.1.4. Specialty Stores

    4.2. Retail Pricing Strategies

5. Consumer Buying Behavior Analysis

    5.1. Functionality and Product Demand

        5.1.1. Compression Garments

        5.1.2. Compression Stockings

        5.1.3. Compression Bandages

        5.1.4. Compression Tapes

        5.1.5. Compression Pumps

    5.2. What factors do you consider when deciding to purchase compression products?

    5.3. How important are product certifications when choosing compression products?

    5.4. How important is the brand reputation and recognition when selecting compression products?

    5.5. What marketing channels do you prefer for learning about new products?

    5.6. How often do you purchase new compression products?

        5.6.1. Once or More Every Month

        5.6.2. Once Every 2 months

        5.6.3. Once Every 6 Months

        5.6.4. Once a Year

        5.6.5. Less Than Once A Year

6. Market Trends & Dynamics

    6.1. Per capita spending on compression products

    6.2. Key Trends Impacting the Market

    6.3. Product Innovation / Development Trends

        6.3.1. Latest Trends and Demands

        6.3.2. Latest Innovations and New Launches

    6.4. Future Prospects of Organic Cosmetics Industry

    6.5. Market Dynamics

        6.5.1. Drivers

        6.5.2. Restraints

        6.5.3. Opportunity Analysis

7. Value Added Insights

    7.1. Key Promotional Strategies by Manufacturers

    7.2. Disease Epidemiology by Region

    7.3. Regulatory Approvals

    7.4. Recent Product Launches

    7.5. Value Chain Analysis

    7.6. Product Adoption Analysis

    7.7. PESTEL Analysis

    7.8. PORTER’s Analysis

8. Market Background

    8.1. Macro-Economic Factors

        8.1.1. Global GDP Growth Outlook

        8.1.2. Global Healthcare Expenditure

    8.2. Forecast Factors - Relevance & Impact

        8.2.1. Top Companies Historical Growth

        8.2.2. Growing Elderly Population

        8.2.3. Prevalence of Lymphatic & Venous Disorders

        8.2.4. Innovation of Modern Compression Therapeutics

        8.2.5. Rising Cases of Obesity

        8.2.6. Increasing Sports-Related Injuries

9. Global Market Demand Analysis 2017 to 2022 and Forecast, 2023 to 2033

    9.1. Historical Market Volume (Units) Analysis, 2017 to 2022

    9.2. Current and Future Market Volume (Units) Projections, 2023 to 2033

        9.2.1. Y-o-Y Growth Trend Analysis *Per Capita Consumption

10. Global Market - Pricing Analysis

    10.1. Regional Pricing Analysis By Product

    10.2. Global Average Pricing Analysis Benchmark

    10.3. Pricing Assumptions

11. Global Market Demand (in Value or Size in US$ Million) Analysis 2017 to 2022 and Forecast, 2023 to 2033

    11.1. Historical Market Value (US$ Million) Analysis, 2017 to 2022

    11.2. Current and Future Market Value (US$ Million) Projections, 2023 to 2033

        11.2.1. Y-o-Y Growth Trend Analysis

        11.2.2. Absolute $ Opportunity Analysis

12. Global Market Analysis 2017 to 2022 and Forecast 2023 to 2033, by Product

    12.1. Introduction / Key Findings

    12.2. Historical Market Size (US$ Million) and Volume (Units) Analysis By Product, 2017 to 2022

    12.3. Current and Future Market Size (US$ Million) and Volume (Units) Analysis and Forecast By Product, 2023 to 2033

        12.3.1. Compression Garments

        12.3.2. Compression Stockings

        12.3.3. Compression Bandages

        12.3.4. Compression Tapes

        12.3.5. Compression Pumps

    12.4. Market Attractiveness Analysis By Product

13. Global Market Analysis 2017 to 2022 and Forecast 2023 to 2033, By Application

    13.1. Introduction / Key Findings

    13.2. Historical Market Size (US$ Million) Analysis By Application, 2017 to 2022

    13.3. Current and Future Market Size (US$ Million) Analysis and Forecast By Application, 2023 to 2033

        13.3.1. Lymphedema

        13.3.2. Deep Vein Thrombosis

        13.3.3. Varicose Vein

        13.3.4. Leg Ulcer

    13.4. Market Attractiveness Analysis By Application

14. Global Market Analysis 2017 to 2022 and Forecast 2023 to 2033, By Distribution Channel

    14.1. Introduction / Key Findings

    14.2. Historical Market Size (US$ Million) Analysis By Distribution Channel, 2017 to 2022

    14.3. Current and Future Market Size (US$ Million) Analysis and Forecast By Distribution Channel, 2023 to 2033

        14.3.1. Pharmacies

        14.3.2. E-Commerce

        14.3.3. Supermarkets

        14.3.4. Specialty Stores

    14.4. Market Attractiveness Analysis By Distribution Channel

15. Global Market Analysis 2017 to 2022 and Forecast 2023 to 2033, by Region

    15.1. Introduction

    15.2. Historical Market Size (US$ Million) Analysis By Region, 2017 to 2022

    15.3. Current and Future Market Size (US$ Million) and Volume (Units) Analysis and Forecast By Region, 2023 to 2033

        15.3.1. North America

        15.3.2. Latin America

        15.3.3. Europe

        15.3.4. South Asia

        15.3.5. East Asia

        15.3.6. Oceania

        15.3.7. Middle East & Africa

    15.4. Market Attractiveness Analysis By Region

16. North America Market Analysis 2017 to 2022 and Forecast 2023 to 2033

    16.1. Introduction

    16.2. Historical Market Size (US$ Million) and Volume (Units) Trend Analysis By Market Taxonomy, 2017 to 2022

    16.3. Current and Future Market Size (US$ Million) and Volume (Units) Analysis and Forecast By Market Taxonomy, 2023 to 2033

        16.3.1. By Country

            16.3.1.1. USA

            16.3.1.2. Canada

        16.3.2. By Product

        16.3.3. By Application

        16.3.4. By Distribution Channel

    16.4. Market Attractiveness Analysis

        16.4.1. By Country

        16.4.2. By Modality

        16.4.3. By Application

        16.4.4. By Distribution Channel

    16.5. Market Trends

    16.6. Market Drivers & Restraints – Intensity Mapping

    16.7. Country Level Analysis & Forecast

        16.7.1. USA Market

            16.7.1.1. Introduction

            16.7.1.2. Market Analysis and Forecast by Market Taxonomy

                16.7.1.2.1. By Product Type

                16.7.1.2.2. By Application

                16.7.1.2.3. By Distribution Channel

        16.7.2. Canada Market

            16.7.2.1. Introduction

            16.7.2.2. Market Analysis and Forecast by Market Taxonomy

                16.7.2.2.1. By Product Type

                16.7.2.2.2. By Application

                16.7.2.2.3. By Distribution Channel

17. Latin America Market Analysis 2017 to 2022 and Forecast 2023 to 2033

    17.1. Introduction

    17.2. Historical Market Size (US$ Million) and Volume (Units) Trend Analysis By Market Taxonomy, 2017 to 2022

    17.3. Current and Future Market Size (US$ Million) and Volume (Units) Analysis and Forecast By Market Taxonomy, 2023 to 2033

        17.3.1. By Country

            17.3.1.1. Brazil

            17.3.1.2. Mexico

            17.3.1.3. Argentina

            17.3.1.4. Rest of LATAM

        17.3.2. By Product

        17.3.3. By Application

        17.3.4. By Distribution Channel

    17.4. Market Attractiveness Analysis

        17.4.1. By Country

        17.4.2. By Product

        17.4.3. By Application

        17.4.4. By Distribution Channel

    17.5. Market Trends

    17.6. Market Drivers & Restraints – Intensity Mapping

    17.7. Country Level Analysis & Forecast

        17.7.1. Brazil Market

            17.7.1.1. Introduction

            17.7.1.2. Market Analysis and Forecast by Market Taxonomy

                17.7.1.2.1. By Product Type

                17.7.1.2.2. By Application

                17.7.1.2.3. By Distribution Channel

        17.7.2. Mexico Market

            17.7.2.1. Introduction

            17.7.2.2. Market Analysis and Forecast by Market Taxonomy

                17.7.2.2.1. By Product Type

                17.7.2.2.2. By Application

                17.7.2.2.3. By Distribution Channel

        17.7.3. Argentina Market

            17.7.3.1. Introduction

            17.7.3.2. Market Analysis and Forecast by Market Taxonomy

                17.7.3.2.1. By Product Type

                17.7.3.2.2. By Application

                17.7.3.2.3. By Distribution Channel

18. Europe Market Analysis 2017 to 2022 and Forecast 2023 to 2033

    18.1. Introduction

    18.2. Historical Market Size (US$ Million) and Volume (Units) Trend Analysis By Market Taxonomy, 2017 to 2022

    18.3. Current and Future Market Size (US$ Million) and Volume (Units) Analysis and Forecast By Market Taxonomy, 2023 to 2033

        18.3.1. By Country

            18.3.1.1. UK

            18.3.1.2. Germany

            18.3.1.3. France

            18.3.1.4. Italy

            18.3.1.5. Spain

            18.3.1.6. BENELUX

            18.3.1.7. Russia

            18.3.1.8. Rest of Europe

        18.3.2. By Product

        18.3.3. By Application

        18.3.4. By Distribution Channel

    18.4. Market Attractiveness Analysis

        18.4.1. By Country

        18.4.2. By Product

        18.4.3. By Application

        18.4.4. By Distribution Channel

    18.5. Market Trends

    18.6. Market Drivers & Restraints – Intensity Mapping

    18.7. Country Level Analysis & Forecast

        18.7.1. UK Market

            18.7.1.1. Introduction

            18.7.1.2. Market Analysis and Forecast by Market Taxonomy

                18.7.1.2.1. By Product Type

                18.7.1.2.2. By Application

                18.7.1.2.3. By Distribution Channel

        18.7.2. Germany Market

            18.7.2.1. Introduction

            18.7.2.2. Market Analysis and Forecast by Market Taxonomy

                18.7.2.2.1. By Product Type

                18.7.2.2.2. By Application

                18.7.2.2.3. By Distribution Channel

        18.7.3. France Market

            18.7.3.1. Introduction

            18.7.3.2. Market Analysis and Forecast by Market Taxonomy

                18.7.3.2.1. By Product Type

                18.7.3.2.2. By Application

                18.7.3.2.3. By Distribution Channel

        18.7.4. Spain Market

            18.7.4.1. Introduction

            18.7.4.2. Market Analysis and Forecast by Market Taxonomy

                18.7.4.2.1. By Product Type

                18.7.4.2.2. By Application

                18.7.4.2.3. By Distribution Channel

        18.7.5. Italy Market

            18.7.5.1. Introduction

            18.7.5.2. Market Analysis and Forecast by Market Taxonomy

                18.7.5.2.1. By Product Type

                18.7.5.2.2. By Application

                18.7.5.2.3. By Distribution Channel

        18.7.6. BENELUX Market

            18.7.6.1. Introduction

            18.7.6.2. Market Analysis and Forecast by Market Taxonomy

                18.7.6.2.1. By Product Type

                18.7.6.2.2. By Application

                18.7.6.2.3. By Distribution Channel

        18.7.7. Russia Market

            18.7.7.1. Introduction

            18.7.7.2. Market Analysis and Forecast by Market Taxonomy

                18.7.7.2.1. By Product Type

                18.7.7.2.2. By Application

                18.7.7.2.3. By Distribution Channel

19. East Asia Market Analysis 2017 to 2022 and Forecast 2023 to 2033

    19.1. Introduction

    19.2. Historical Market Size (US$ Million) and Volume (Units) Trend Analysis By Market Taxonomy, 2017 to 2022

    19.3. Current and Future Market Size (US$ Million) and Volume (Units) Analysis and Forecast By Market Taxonomy, 2023 to 2033

        19.3.1. By Country

            19.3.1.1. China

            19.3.1.2. Japan

            19.3.1.3. South Korea

        19.3.2. By Product

        19.3.3. By Application

        19.3.4. By Distribution Channel

    19.4. Market Attractiveness Analysis

        19.4.1. By Country

        19.4.2. By Product

        19.4.3. By Application

        19.4.4. By Distribution Channel

    19.5. Market Trends

    19.6. Market Drivers & Restraints – Intensity Mapping

    19.7. Country Level Analysis & Forecast

        19.7.1. China Market

            19.7.1.1. Introduction

            19.7.1.2. Market Analysis and Forecast by Market Taxonomy

                19.7.1.2.1. By Product Type

                19.7.1.2.2. By Application

                19.7.1.2.3. By Distribution Channel

        19.7.2. Japan Market

            19.7.2.1. Introduction

            19.7.2.2. Market Analysis and Forecast by Market Taxonomy

                19.7.2.2.1. By Product Type

                19.7.2.2.2. By Application

                19.7.2.2.3. By Distribution Channel

        19.7.3. South Korea Market

            19.7.3.1. Introduction

            19.7.3.2. Market Analysis and Forecast by Market Taxonomy

                19.7.3.2.1. By Product Type

                19.7.3.2.2. By Application

                19.7.3.2.3. By Distribution Channel

20. South Asia Market Analysis 2017 to 2022 and Forecast 2023 to 2033

    20.1. Introduction

    20.2. Historical Market Size (US$ Million) and Volume (Units) Trend Analysis By Market Taxonomy, 2017 to 2022

    20.3. Current and Future Market Size (US$ Million) and Volume (Units) Analysis and Forecast By Market Taxonomy, 2023 to 2033

        20.3.1. By Country

            20.3.1.1. India

            20.3.1.2. Indonesia

            20.3.1.3. Thailand

            20.3.1.4. Malaysia

            20.3.1.5. Rest of South Asia

        20.3.2. By Product

        20.3.3. By Application

        20.3.4. By Distribution Channel

    20.4. Market Attractiveness Analysis

        20.4.1. By Country

        20.4.2. By Product

        20.4.3. By Application

        20.4.4. By Distribution Channel

    20.5. Market Trends

    20.6. Market Drivers & Restraints – Intensity Mapping

    20.7. Country Level Analysis & Forecast

        20.7.1. India Market

            20.7.1.1. Introduction

            20.7.1.2. Market Analysis and Forecast by Market Taxonomy

                20.7.1.2.1. By Product Type

                20.7.1.2.2. By Application

                20.7.1.2.3. By Distribution Channel

        20.7.2. Indonesia Market

            20.7.2.1. Introduction

            20.7.2.2. Market Analysis and Forecast by Market Taxonomy

                20.7.2.2.1. By Product Type

                20.7.2.2.2. By Application

                20.7.2.2.3. By Distribution Channel

        20.7.3. Thailand Market

            20.7.3.1. Introduction

            20.7.3.2. Market Analysis and Forecast by Market Taxonomy

                20.7.3.2.1. By Product Type

                20.7.3.2.2. By Application

                20.7.3.2.3. By Distribution Channel

        20.7.4. Malaysia Market

            20.7.4.1. Introduction

            20.7.4.2. Market Analysis and Forecast by Market Taxonomy

                20.7.4.2.1. By Product Type

                20.7.4.2.2. By Application

                20.7.4.2.3. By Distribution Channel

21. Oceania Market Analysis 2017 to 2022 and Forecast 2023 to 2033

    21.1. Introduction

    21.2. Historical Market Size (US$ Million) and Volume (Units) Trend Analysis By Market Taxonomy, 2017 to 2022

    21.3. Current and Future Market Size (US$ Million) and Volume (Units) Analysis and Forecast By Market Taxonomy, 2023 to 2033

        21.3.1. By Country

            21.3.1.1. Australia

            21.3.1.2. New Zealand

        21.3.2. By Product

        21.3.3. By Application

        21.3.4. By Distribution Channel

    21.4. Market Attractiveness Analysis

        21.4.1. By Country

        21.4.2. By Product

        21.4.3. By Application

        21.4.4. By Distribution Channel

    21.5. Market Trends

    21.6. Market Drivers & Restraints – Intensity Mapping

    21.7. Country Level Analysis & Forecast

        21.7.1. Australia Market

            21.7.1.1. Introduction

            21.7.1.2. Market Analysis and Forecast by Market Taxonomy

                21.7.1.2.1. By Product Type

                21.7.1.2.2. By Application

                21.7.1.2.3. By Distribution Channel

        21.7.2. New Zealand Market

            21.7.2.1. Introduction

            21.7.2.2. Market Analysis and Forecast by Market Taxonomy

                21.7.2.2.1. By Product Type

                21.7.2.2.2. By Application

                21.7.2.2.3. By Distribution Channel

22. Middle East & Africa Market Analysis 2017 to 2022 and Forecast 2023 to 2033

    22.1. Introduction

    22.2. Historical Market Size (US$ Million) and Volume (Units) Trend Analysis By Market Taxonomy, 2017 to 2022

    22.3. Current and Future Market Size (US$ Million) and Volume (Units) Analysis and Forecast By Market Taxonomy, 2023 to 2033

        22.3.1. By Country

            22.3.1.1. GCC Countries

            22.3.1.2. Türkiye

            22.3.1.3. South Africa

            22.3.1.4. North Africa

            22.3.1.5. Rest of MEA

        22.3.2. By Product

        22.3.3. By Application

        22.3.4. By Distribution Channel

    22.4. Market Attractiveness Analysis

        22.4.1. By Country

        22.4.2. By Product

        22.4.3. By Application

        22.4.4. By Distribution Channel

    22.5. Market Trends

    22.6. Market Drivers & Restraints – Intensity Mapping

    22.7. Country Level Analysis & Forecast

        22.7.1. GCC Countries Market

            22.7.1.1. Introduction

            22.7.1.2. Market Analysis and Forecast by Market Taxonomy

                22.7.1.2.1. By Product Type

                22.7.1.2.2. By Application

                22.7.1.2.3. By Distribution Channel

        22.7.2. Türkiye Market

            22.7.2.1. Introduction

            22.7.2.2. Market Analysis and Forecast by Market Taxonomy

                22.7.2.2.1. By Product Type

                22.7.2.2.2. By Application

                22.7.2.2.3. By Distribution Channel

        22.7.3. South Africa Market

            22.7.3.1. Introduction

            22.7.3.2. Market Analysis and Forecast by Market Taxonomy

                22.7.3.2.1. By Product Type

                22.7.3.2.2. By Application

                22.7.3.2.3. By Distribution Channel

        22.7.4. North Africa Market

            22.7.4.1. Introduction

            22.7.4.2. Market Analysis and Forecast by Market Taxonomy

                22.7.4.2.1. By Product Type

                22.7.4.2.2. By Application

                22.7.4.2.3. By Distribution Channel

23. Market Structure Analysis

    23.1. Market Analysis by Tier of Companies

    23.2. Market Share Analysis of Top Players

    23.3. Market Presence Analysis

24. Competition Analysis

    24.1. Competition Dashboard

    24.2. Branding and Promotional Strategies, By Key Players

    24.3. Key Development Analysis

    24.4. Competition Deep Dive

        24.4.1. Bio Compression Systems Inc

            24.4.1.1. Overview

            24.4.1.2. Product Portfolio

            24.4.1.3. Key Financials

            24.4.1.4. Sales Footprint

            24.4.1.5. Strategy Overview

                24.4.1.5.1. Marketing Strategy

                24.4.1.5.2. Component Type Strategy

                24.4.1.5.3. Channel Strategy

        24.4.2. Proxima Healthcare

        24.4.3. 3M

        24.4.4. Bauerfeind

        24.4.5. Macom Enterprises

        24.4.6. Leonisa

        24.4.7. LIPOELASTIC

        24.4.8. Cosmac Healthcare

        24.4.9. Lohmann and Rauscher

        24.4.10. Wear Ease

        24.4.11. Peninsula BioMedical

        24.4.12. LympheDIVAs

        24.4.13. Juzo

        24.4.14. Medico International

        24.4.15. The Marena Group

        24.4.16. Smith & Nephew plc

        24.4.17. Spectrum Healthcare

        24.4.18. Gottfried Medical Inc.

        24.4.19. Cardinal Health

25. Assumptions and Acronyms Used

26. Research Methodology

List of Tables

Table 01: Global Market Value (US$ Million) Analysis and Forecast 2017 to 2033, By Product

Table 02: Global Market Volume (Units) Analysis and Forecast 2017 to 2033, By Product

Table 03: Global Market Value (US$ Million) Analysis and Forecast 2017 to 2033, By Application

Table 04: Global Market Value (US$ Million) Analysis and Forecast 2017 to 2033, By Distribution Channel

Table 05: Global Market Value (US$ Million) Analysis and Forecast 2017 to 2033, By Region

Table 06: North America Market Value (US$ Million) Analysis 2017-2022 and Forecast 2023 to 2033, by Country

Table 07: North America Market Value (US$ Million) Analysis and Forecast 2017 to 2033, By Product

Table 08: North America Market Volume (Units) Analysis and Forecast 2017 to 2033, By Product

Table 09: North America Market Value (US$ Million) Analysis and Forecast 2017 to 2033, by Application

Table 10: North America Market Value (US$ Million) Analysis and Forecast 2017 to 2033, By Distribution Channel

Table 11: Latin America Market Value (US$ Million) Analysis 2017-2022 and Forecast 2023 to 2033, by Country

Table 12: Latin America Market Value (US$ Million) Analysis and Forecast 2017 to 2033, By Product

Table 13: Latin America Market Volume (Units) Analysis and Forecast 2017 to 2033, By Product

Table 14: Latin America Market Value (US$ Million) Analysis and Forecast 2017 to 2033, by Application

Table 15: Latin America Market Value (US$ Million) Analysis and Forecast 2017 to 2033, By Distribution Channel

Table 16: Europe Market Value (US$ Million) Analysis 2017-2022 and Forecast 2023 to 2033, by Country

Table 17: Europe Market Value (US$ Million) Analysis and Forecast 2017 to 2033, By Product

Table 18: Europe Market Volume (Units) Analysis and Forecast 2017 to 2033, By Product

Table 19: Europe Market Value (US$ Million) Analysis and Forecast 2017 to 2033, by Application

Table 20: Europe Market Value (US$ Million) Analysis and Forecast 2017 to 2033, By Distribution Channel

Table 21: South Asia Market Value (US$ Million) Analysis 2017-2022 and Forecast 2023 to 2033, by Country

Table 22: South Asia Market Value (US$ Million) Analysis and Forecast 2017 to 2033, By Product

Table 23: South Asia Market Volume (Units) Analysis and Forecast 2017 to 2033, By Product

Table 24: South Asia Market Value (US$ Million) Analysis and Forecast 2017 to 2033, by Application

Table 25: South Asia Market Value (US$ Million) Analysis and Forecast 2017 to 2033, By Distribution Channel

Table 26: East Asia Market Value (US$ Million) Analysis 2017-2022 and Forecast 2023 to 2033, by Country

Table 27: East Asia Market Value (US$ Million) Analysis and Forecast 2017 to 2033, By Product

Table 28: East Asia Market Volume (Units) Analysis and Forecast 2017 to 2033, By Product

Table 29: East Asia Market Value (US$ Million) Analysis and Forecast 2017 to 2033, by Application

Table 30: East Asia Market Value (US$ Million) Analysis and Forecast 2017 to 2033, By Distribution Channel

Table 31: Oceania Market Value (US$ Million) Analysis 2017-2022 and Forecast 2023 to 2033, by Country

Table 32: Oceania Market Value (US$ Million) Analysis and Forecast 2017 to 2033, By Product

Table 33: Oceania Market Volume (Units) Analysis and Forecast 2017 to 2033, By Product

Table 34: Oceania Market Value (US$ Million) Analysis and Forecast 2017 to 2033, by Application

Table 35: Oceania Market Value (US$ Million) Analysis and Forecast 2017 to 2033, By Distribution Channel

Table 36: Middle East and Africa Market Value (US$ Million) Analysis 2017-2022 and Forecast 2023 to 2033, by Country

Table 37: Middle East and Africa Market Value (US$ Million) Analysis and Forecast 2017 to 2033, By Product

Table 38: Middle East and Africa Market Volume (Units) Analysis and Forecast 2017 to 2033, By Product

Table 39: Middle East and Africa Market Value (US$ Million) Analysis and Forecast 2017 to 2033, by Application

Table 40: Middle East and Africa Market Value (US$ Million) Analysis and Forecast 2017 to 2033, By Distribution Channel

List of Charts

Figure 01: Global Market Volume (Units), 2017 to 2022

Figure 02: Global Market Volume (Units) & Y-o-Y Growth (%) Analysis, 2023 to 2033

Figure 03: Market, Pricing Analysis per unit (US$), in 2023

Figure 04: Market, Pricing Forecast per unit (US$), in 2033

Figure 05: Global Market Value (US$ Million) Analysis, 2017 to 2022

Figure 06: Global Market Forecast & Y-o-Y Growth, 2023 to 2033

Figure 07: Global Market Absolute $ Opportunity (US$ Million) Analysis, 2022 to 2033

Figure 08: Global Market Value Share (%) Analysis 2023 and 2033, By Product

Figure 09: Global Market Y-o-Y Growth (%) Analysis 2022 to 2033, By Product

Figure 10: Global Market Attractiveness Analysis 2023 to 2033, By Product

Figure 11: Global Market Value Share (%) Analysis 2023 and 2033, By Application

Figure 12: Global Market Y-o-Y Growth (%) Analysis 2022 to 2033, By Application

Figure 13: Global Market Attractiveness Analysis 2023 to 2033, By Application

Figure 14: Global Market Value Share (%) Analysis 2023 and 2033, By Distribution Channel

Figure 15: Global Market Y-o-Y Growth (%) Analysis 2022 to 2033, By Distribution Channel

Figure 16: Global Market Attractiveness Analysis 2023 to 2033, By Distribution Channel

Figure 17: Global Market Value Share (%) Analysis 2023 and 2033, By Region

Figure 18: Global Market Y-o-Y Growth (%) Analysis 2022 to 2033, By Region

Figure 19: Global Market Attractiveness Analysis 2023 to 2033, By Region

Figure 20: North America Market Value (US$ Million) Analysis, 2017 to 2022

Figure 21: North America Market Value (US$ Million) Forecast, 2023 to 2033

Figure 22: North America Market Value Share, By Product (2023 E)

Figure 23: North America Market Value Share, By Application (2023 E)

Figure 24: North America Market Value Share, By Distribution Channel (2023 E)

Figure 25: North America Market Value Share, by Country (2023 E)

Figure 26: North America Market Attractiveness Analysis By Product, 2023 to 2033

Figure 27: North America Market Attractiveness Analysis By Application, 2023 to 2033

Figure 28: North America Market Attractiveness Analysis By Distribution Channel, 2023 to 2033

Figure 29: North America Market Attractiveness Analysis by Country, 2023 to 2033

Figure 30: U.S. Market Value Proportion Analysis, 2022

Figure 31: Global Vs. U.S. Growth Comparison

Figure 32: U.S. Market Share Analysis (%) By Product, 2022 to 2033

Figure 33: U.S. Market Share Analysis (%) By Application, 2022 to 2033

Figure 34: U.S. Market Share Analysis (%) By Distribution Channel, 2022 to 2033

Figure 35: Canada Market Value Proportion Analysis, 2022

Figure 36: Global Vs. Canada. Growth Comparison

Figure 37: Canada Market Share Analysis (%) By Product, 2022 to 2033

Figure 38: Canada Market Share Analysis (%) By Application, 2022 to 2033

Figure 39: Canada Market Share Analysis (%) By Distribution Channel, 2022 to 2033

Figure 40: Latin America Market Value (US$ Million) Analysis, 2017 to 2022

Figure 41: Latin America Market Value (US$ Million) Forecast, 2023 to 2033

Figure 42: Latin America Market Value Share, By Product (2023 E)

Figure 43: Latin America Market Value Share, By Application (2023 E)

Figure 44: Latin America Market Value Share, By Distribution Channel (2023 E)

Figure 45: Latin America Market Value Share, by Country (2023 E)

Figure 46: Latin America Market Attractiveness Analysis By Product, 2023 to 2033

Figure 47: Latin America Market Attractiveness Analysis By Application, 2023 to 2033

Figure 48: Latin America Market Attractiveness Analysis By Distribution Channel, 2023 to 2033

Figure 49: Latin America Market Attractiveness Analysis by Country, 2023 to 2033

Figure 50: Mexico Market Value Proportion Analysis, 2022

Figure 51: Global Vs Mexico Growth Comparison

Figure 52: Mexico Market Share Analysis (%) By Product, 2022 to 2033

Figure 53: Mexico Market Share Analysis (%) By Application, 2022 to 2033

Figure 54: Mexico Market Share Analysis (%) By Distribution Channel, 2022 to 2033

Figure 55: Brazil Market Value Proportion Analysis, 2022

Figure 56: Global Vs. Brazil. Growth Comparison

Figure 57: Brazil Market Share Analysis (%) By Product, 2022 to 2033

Figure 58: Brazil Market Share Analysis (%) By Application, 2022 to 2033

Figure 59: Brazil Market Share Analysis (%) By Distribution Channel, 2022 to 2033

Figure 60: Argentina Market Value Proportion Analysis, 2022

Figure 61: Global Vs Argentina Growth Comparison

Figure 62: Argentina Market Share Analysis (%) By Product, 2022 to 2033

Figure 63: Argentina Market Share Analysis (%) By Application, 2022 to 2033

Figure 64: Argentina Market Share Analysis (%) By Distribution Channel, 2022 to 2033

Figure 65: Europe Market Value (US$ Million) Analysis, 2017 to 2022

Figure 66: Europe Market Value (US$ Million) Forecast, 2023 to 2033

Figure 67: Europe Market Value Share, By Product (2023 E)

Figure 68: Europe Market Value Share, By Application (2023 E)

Figure 69: Europe Market Value Share, By Distribution Channel (2023 E)

Figure 70: Europe Market Value Share, by Country (2023 E)

Figure 71: Europe Market Attractiveness Analysis By Product, 2023 to 2033

Figure 72: Europe Market Attractiveness Analysis By Application, 2023 to 2033

Figure 73: Europe Market Attractiveness Analysis By Distribution Channel, 2023 to 2033

Figure 74: Europe Market Attractiveness Analysis by Country, 2023 to 2033

Figure 75: UK Market Value Proportion Analysis, 2022

Figure 76: Global Vs. UK Growth Comparison

Figure 77: UK Market Share Analysis (%) By Product, 2022 to 2033

Figure 78: UK Market Share Analysis (%) By Application, 2022 to 2033

Figure 79: UK Market Share Analysis (%) By Distribution Channel, 2022 to 2033

Figure 80: Germany Market Value Proportion Analysis, 2022

Figure 81: Global Vs. Germany Growth Comparison

Figure 82: Germany Market Share Analysis (%) By Product, 2022 to 2033

Figure 83: Germany Market Share Analysis (%) By Application, 2022 to 2033

Figure 84: Germany Market Share Analysis (%) By Distribution Channel, 2022 to 2033

Figure 85: Italy Market Value Proportion Analysis, 2022

Figure 86: Global Vs. Italy Growth Comparison

Figure 87: Italy Market Share Analysis (%) By Product, 2022 to 2033

Figure 88: Italy Market Share Analysis (%) By Application, 2022 to 2033

Figure 89: Italy Market Share Analysis (%) By Distribution Channel, 2022 to 2033

Figure 90: France Market Value Proportion Analysis, 2022

Figure 91: Global Vs France Growth Comparison

Figure 92: France Market Share Analysis (%) By Product, 2022 to 2033

Figure 93: France Market Share Analysis (%) By Application, 2022 to 2033

Figure 94: France Market Share Analysis (%) By Distribution Channel, 2022 to 2033

Figure 95: Spain Market Value Proportion Analysis, 2022

Figure 96: Global Vs Spain Growth Comparison

Figure 97: Spain Market Share Analysis (%) By Product, 2022 to 2033

Figure 98: Spain Market Share Analysis (%) By Application, 2022 to 2033

Figure 99: Spain Market Share Analysis (%) By Distribution Channel, 2022 to 2033

Figure 100: Russia Market Value Proportion Analysis, 2022

Figure 101: Global Vs Russia Growth Comparison

Figure 102: Russia Market Share Analysis (%) By Product, 2022 to 2033

Figure 103: Russia Market Share Analysis (%) By Application, 2022 to 2033

Figure 104: Russia Market Share Analysis (%) By Distribution Channel, 2022 to 2033

Figure 105: BENELUX Market Value Proportion Analysis, 2022

Figure 106: Global Vs BENELUX Growth Comparison

Figure 107: BENELUX Market Share Analysis (%) By Product, 2022 to 2033

Figure 108: BENELUX Market Share Analysis (%) By Application, 2022 to 2033

Figure 109: BENELUX Market Share Analysis (%) By Distribution Channel, 2022 to 2033

Figure 110: East Asia Market Value (US$ Million) Analysis, 2017 to 2022

Figure 111: East Asia Market Value (US$ Million) Forecast, 2023 to 2033

Figure 112: East Asia Market Value Share, By Product (2023 E)

Figure 113: East Asia Market Value Share, By Application (2023 E)

Figure 114: East Asia Market Value Share, By Distribution Channel (2023 E)

Figure 115: East Asia Market Value Share, by Country (2023 E)

Figure 116: East Asia Market Attractiveness Analysis By Product, 2023 to 2033

Figure 117: East Asia Market Attractiveness Analysis By Application, 2023 to 2033

Figure 118: East Asia Market Attractiveness Analysis By Distribution Channel, 2023 to 2033

Figure 119: East Asia Market Attractiveness Analysis by Country, 2023 to 2033

Figure 120: China Market Value Proportion Analysis, 2022

Figure 121: Global Vs. China Growth Comparison

Figure 122: China Market Share Analysis (%) By Product, 2022 to 2033

Figure 123: China Market Share Analysis (%) By Application, 2022 to 2033

Figure 124: China Market Share Analysis (%) By Distribution Channel, 2022 to 2033

Figure 125: Japan Market Value Proportion Analysis, 2022

Figure 126: Global Vs. Japan Growth Comparison

Figure 127: Japan Market Share Analysis (%) By Product, 2022 to 2033

Figure 128: Japan Market Share Analysis (%) By Application, 2022 to 2033

Figure 129: Japan Market Share Analysis (%) By Distribution Channel, 2022 to 2033

Figure 130: South Korea Market Value Proportion Analysis, 2022

Figure 131: Global Vs South Korea Growth Comparison

Figure 132: South Korea Market Share Analysis (%) By Product, 2022 to 2033

Figure 133: South Korea Market Share Analysis (%) By Application, 2022 to 2033

Figure 134: South Korea Market Share Analysis (%) By Distribution Channel, 2022 to 2033

Figure 135: South Asia Market Value (US$ Million) Analysis, 2017 to 2022

Figure 136: South Asia Market Value (US$ Million) Forecast, 2023 to 2033

Figure 137: South Asia Market Value Share, By Product (2023 E)

Figure 138: South Asia Market Value Share, By Application (2023 E)

Figure 139: South Asia Market Value Share, By Distribution Channel (2023 E)

Figure 140: South Asia Market Value Share, by Country (2023 E)

Figure 141: South Asia Market Attractiveness Analysis By Product, 2023 to 2033

Figure 142: South Asia Market Attractiveness Analysis By Application, 2023 to 2033

Figure 143: South Asia Market Attractiveness Analysis By Distribution Channel, 2023 to 2033

Figure 144: South Asia Market Attractiveness Analysis by Country, 2023 to 2033

Figure 145: India Market Value Proportion Analysis, 2022

Figure 146: Global Vs. India Growth Comparison

Figure 147: India Market Share Analysis (%) By Product, 2022 to 2033

Figure 148: India Market Share Analysis (%) By Application, 2022 to 2033

Figure 149: India Market Share Analysis (%) By Distribution Channel, 2022 to 2033

Figure 150: Indonesia Market Value Proportion Analysis, 2022

Figure 151: Global Vs. Indonesia Growth Comparison

Figure 152: Indonesia Market Share Analysis (%) By Product, 2022 to 2033

Figure 153: Indonesia Market Share Analysis (%) By Application, 2022 to 2033

Figure 154: Indonesia Market Share Analysis (%) By Distribution Channel, 2022 to 2033

Figure 155: Malaysia Market Value Proportion Analysis, 2022

Figure 156: Global Vs. Malaysia Growth Comparison

Figure 157: Malaysia Market Share Analysis (%) By Product, 2022 to 2033

Figure 158: Malaysia Market Share Analysis (%) By Application, 2022 to 2033

Figure 159: Malaysia Market Share Analysis (%) By Distribution Channel, 2022 to 2033

Figure 160: Thailand Market Value Proportion Analysis, 2022

Figure 161: Global Vs. Thailand Growth Comparison

Figure 162: Thailand Market Share Analysis (%) By Product, 2022 to 2033

Figure 163: Thailand Market Share Analysis (%) By Application, 2022 to 2033

Figure 164: Thailand Market Share Analysis (%) By Distribution Channel, 2022 to 2033

Figure 165: Oceania Market Value (US$ Million) Analysis, 2017 to 2022

Figure 166: Oceania Market Value (US$ Million) Forecast, 2023 to 2033

Figure 167: Oceania Market Value Share, By Product (2023 E)

Figure 168: Oceania Market Value Share, By Application (2023 E)

Figure 169: Oceania Market Value Share, By Distribution Channel (2023 E)

Figure 170: Oceania Market Value Share, by Country (2023 E)

Figure 171: Oceania Market Attractiveness Analysis By Product, 2023 to 2033

Figure 172: Oceania Market Attractiveness Analysis By Application, 2023 to 2033

Figure 173: Oceania Market Attractiveness Analysis By Distribution Channel, 2023 to 2033

Figure 174: Oceania Market Attractiveness Analysis by Country, 2023 to 2033

Figure 175: Australia Market Value Proportion Analysis, 2022

Figure 176: Global Vs. Australia Growth Comparison

Figure 177: Australia Market Share Analysis (%) By Product, 2022 to 2033

Figure 178: Australia Market Share Analysis (%) By Application, 2022 to 2033

Figure 179: Australia Market Share Analysis (%) By Distribution Channel, 2022 to 2033

Figure 180: New Zealand Market Value Proportion Analysis, 2022

Figure 181: Global Vs New Zealand Growth Comparison

Figure 182: New Zealand Market Share Analysis (%) By Product, 2022 to 2033

Figure 183: New Zealand Market Share Analysis (%) By Application, 2022 to 2033

Figure 184: New Zealand Market Share Analysis (%) By Distribution Channel, 2022 to 2033

Figure 185: Middle East & Africa Market Value (US$ Million) Analysis, 2017 to 2022

Figure 186: Middle East & Africa Market Value (US$ Million) Forecast, 2023 to 2033

Figure 187: Middle East & Africa Market Value Share, By Product (2023 E)

Figure 188: Middle East & Africa Market Value Share, By Application (2023 E)

Figure 189: Middle East & Africa Market Value Share, By Distribution Channel (2023 E)

Figure 190: Middle East & Africa Market Value Share, by Country (2023 E)

Figure 191: Middle East & Africa Market Attractiveness Analysis By Product, 2023 to 2033

Figure 192: Middle East & Africa Market Attractiveness Analysis By Application, 2023 to 2033

Figure 193: Middle East & Africa Market Attractiveness Analysis By Distribution Channel, 2023 to 2033

Figure 194: Middle East & Africa Market Attractiveness Analysis by Country, 2023 to 2033

Figure 195: GCC Countries Market Value Proportion Analysis, 2022

Figure 196: Global Vs GCC Countries Growth Comparison

Figure 197: GCC Countries Market Share Analysis (%) By Product, 2022 to 2033

Figure 198: GCC Countries Market Share Analysis (%) By Application, 2022 to 2033

Figure 199: GCC Countries Market Share Analysis (%) By Distribution Channel, 2022 to 2033

Figure 200: Türkiye Market Value Proportion Analysis, 2022

Figure 201: Global Vs. Türkiye Growth Comparison

Figure 202: Türkiye Market Share Analysis (%) By Product, 2022 to 2033

Figure 203: Türkiye Market Share Analysis (%) By Application, 2022 to 2033

Figure 204: Türkiye Market Share Analysis (%) By Distribution Channel, 2022 to 2033

Figure 205: South Africa Market Value Proportion Analysis, 2022

Figure 206: Global Vs. South Africa Growth Comparison

Figure 207: South Africa Market Share Analysis (%) By Product, 2022 to 2033

Figure 208: South Africa Market Share Analysis (%) By Application, 2022 to 2033

Figure 209: South Africa Market Share Analysis (%) By Distribution Channel, 2022 to 2033

Figure 210: North Africa Market Value Proportion Analysis, 2022

Figure 211: Global Vs North Africa Growth Comparison

Figure 212: North Africa Market Share Analysis (%) By Product, 2022 to 2033

Figure 213: North Africa Market Share Analysis (%) By Application, 2022 to 2033

Figure 214: North Africa Market Share Analysis (%) By Distribution Channel, 2022 to 2033

Recommendations

Healthcare

Compression Garments Market

Published : July 2023

Healthcare

Radial Compression Devices Market

Published : January 2023

Explore Healthcare Insights

View Reports

Compression Product Market