Reports

- Global Locations -

Headquarters

Future Market Insights, Inc.

Christiana Corporate, 200
Continental Drive, Suite 401,
Newark, Delaware - 19713,
United States

T: +1-845-579-5705

Americas

Future Market Insights, Inc.

616 Corporate Way, Suite 2-9018,
Valley Cottage, NY 10989, United States

T: +1-347-918-3531

MEA

Future Market Insights

1602-6 Jumeirah Bay X2 Tower, Plot No: JLT-PH2-X2A,
Jumeirah Lakes Towers, Dubai,
United Arab Emirates

Europe

Future Market Insights

3rd Floor, 207 Regent Street,
W1B 3HH London
United Kingdom

T: + 44 (0) 20 8123 9659
D: +44 (0) 20 3287 4268

Asia Pacific

Future Market Insights

Office No. 401-A, 4th Floor,
VANTAGE 9, S.No. 36/1/1,
Baner, Pune 411045, India

Dehydrated Garlic Market Snapshot (2022 to 2032)

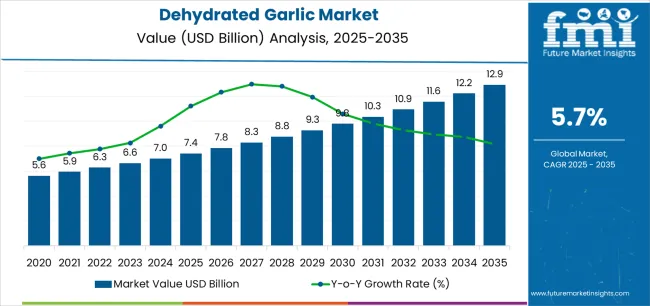
The global dehydrated garlic market size is anticipated to exhibit a considerable CAGR of 5.3% in the forecast period from 2022 to 2032. High demand for ready-to-eat food products among people in both developed and developing countries is likely to augur well for the market.

As per FMI, demand for dehydrated garlic is set to reach US$ 5.2 Billion in 2022 and exhibit steady growth by reaching US$ 10.9 Billion in 2032. The surging usage of dehydrated garlic in the formulation of numerous regional cuisines is expected to bolster the market.

Report Attribute Details
Dehydrated Garlic Market Estimated Base Year Value (2021) US$ 4.8 Billion
Dehydrated Garlic Market Expected Market Value (2022) US$ 5.2 Billion
Dehydrated Garlic Market Anticipated Forecast Value (2032) US$ 10.9 Billion
Dehydrated Garlic Market Projected Growth Rate (2022 to 2032) 5.3% CAGR

Dehydrated garlic is mainly made of raw, fresh garlic after undergoing a large number of dehydration processes. It is gaining immense popularity in various parts of the globe owing to its high antioxidant content.

Increasing sales of dehydrated garlic in the bakery and confectionery industry for the preparation of unique spices required for baking is anticipated to drive the market. The ability of the product to cure numerous diseases, such as heart diseases, high blood pressure, cancer, and high cholesterol is also set to push the market.

As per the World Health Organization (WHO), every year, approximately 17.9 million people die from cardiovascular diseases across the globe and about 85% of all cardiovascular disease-related deaths occur due to strokes and heart attacks. These numbers are estimated to surge at a rapid pace in the future backed by the rising adoption of sedentary lifestyles, thereby augmenting the market.

Don't pay for what you don't need

Customize your report by selecting specific countries or regions and save 30%!

Growing Usage of Dehydrated Garlic for Preparing Sauces to Bolster the Sales

Affordable price preposition, variety, ease of incorporation in local cuisines, improved functionalities, and easy product access are set to remain favorable in promoting the utility of dehydrated garlic in the assessment period. Easy availability of these products through online channels is also expected to provide numerous packaged variants at discounted rates to consumers.

Besides, toasted dehydrated garlic is set to gain impetus in the future owing to its ability to provide a nutty, delicate, and balanced flavor. Thus, it is expected to be formulated by companies in the preparation of pickles, sauces, soups, curries, and stir-fries. It also compliments beans, onions, pork, chili, tomatoes, chicken, seafood, basil, beans, and ginger, which would propel the dehydrated market growth.

High Risk of Digestive Issues May Hamper Dehydrated Garlic Market Demand

One of the major side effects of consuming excessive garlic is a high risk of bleeding, especially among individuals who are either undergoing surgery or taking blood thinners. Garlic contains sulfur compounds that can induce bad breath. In addition to that, high fructan content in garlic can result in stomach pain, gas, and bloating in some people. The above-mentioned cons may obstruct the global dehydrated garlic market size in the upcoming decade.

Nandini Roy Choudhury

Principal Consultant

Talk to Analyst

Find your sweet spots for generating winning opportunities in this market.

Increasing Use of Dehydrated Garlic in Chinese Cuisine to Drive the Asia Pacific Market

Asia Pacific is expected to remain at the forefront by generating the largest dehydrated garlic market share in the evaluation period. Increasing the usage of dehydrated garlic as a main ingredient in the preparation of Chinese dishes is likely to bolster the regional market. Rising awareness among consumers regarding the positive effects of garlic consumption on the lungs, spleen, and stomach is another vital factor that is set to aid growth.

Further, the growing adoption of dehydrated garlic by Chinese herbal practitioners to improve the overall immune system, treat heart diseases, reduce blood triglycerides, and slow platelet clumping is likely to drive the regional market. Many fast food restaurants across India are also focusing on launching new dehydrated garlic-infused sauces and condiments to satiate the high demand from consumers.

Launch of Bold Flavors by Quick-service Chains to Boost North America Dehydrated Garlic Market

High demand for frozen food items in the USA and Canada is projected to fuel the demand for dehydrated garlic across North America as it is used to extend the shelf life of frozen items. Growing familiarity with e-shopping, e-retailing, and smartphones among the millennial population in the region is also anticipated to push sales of the product.

The increasing focus of numerous food and beverage manufacturers on the development of exotic flavors to cater to the high consumer demand across North America is also expected to boost the market.

In June 2022, for instance, Chester’s Chicken, a leading quick-service restaurant chain based in the USA, introduced its new Honey Stung Chicken Bites and Honey Stung Chicken Sandwich on the menu. Honey Stung Chicken contains a blend of honey and garlic flavor to provide bold tastes to consumers. Such innovative product launches by key companies in North America are projected to fuel growth.

Get the data you need at a Fraction of the cost

Personalize your report by choosing insights you need
and save 40%!

Market Competition

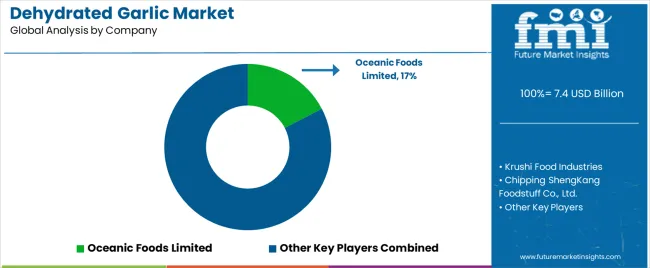
Some of the renowned companies present in the global dehydrated garlic market include Krushi Food Industries, Chiping ShengKang Foodstuff Co., Ltd., Xuzhou Liming Food Co., Ltd., Henan Sunny Foodstuff Co., Ltd., Oceanic Foods Limited, Garlico Industries Ltd., Royal (Jinxiang) Garlic Co., Ltd., B. C. Foods (Shandong) Co. Ltd., V.T. Foods Pvt. Ltd., Daksh Foods Pvt. Ltd., and Handan Green and Healthy Dehydrated Vegetables Food Co. Ltd. among others.

The global market is highly competitive backed by the presence of a large number of local and international players. The market has low entry barriers, which is mainly attributed to the increasing concentration of small and medium enterprises in emerging economies, including India and China.

These companies are increasingly focusing on expanding their product portfolios to attract more consumers. Meanwhile, a few other key players are providing their in-house products at discounted prices and developing organic products to gain a competitive edge.

Report Scope

Report Attribute Details
Growth Rate CAGR of 5.3% from 2022 to 2032
Base Year for Estimation 2021
Historical Data 2015 to 2020
Forecast Period 2022 to 2032
Quantitative Units Revenue in US$ Million and CAGR from 2022 to 2032
Report Coverage Revenue Forecast, Volume Forecast, Company Ranking, Competitive Landscape, Growth Factors, Trends, and Pricing Analysis
Segments Covered
  • Form
  • Variety
  • End Use
  • Region
Regions Covered
  • North America
  • Latin America
  • Western Europe
  • Eastern Europe
  • Asia Pacific Excluding Japan
  • Japan
  • Middle East and Africa
Key Countries Profiled
  • USA
  • Canada
  • Brazil
  • Argentina
  • Germany
  • United Kingdom
  • France
  • Spain
  • Italy
  • Nordics
  • BENELUX
  • Australia & New Zealand
  • China
  • India
  • ASIAN
  • GCC Countries
  • South Africa
Key Companies Profiled
  • Krushi Food Industries
  • Chiping ShengKang Foodstuff Co., Ltd.
  • Xuzhou Liming Food Co., Ltd.
  • Henan Sunny Foodstuff Co., Ltd.
  • Oceanic Foods Limited
  • Garlico Industries Ltd.
  • Royal (Jinxiang) Garlic Co., Ltd.
  • B. C. Foods (Shandong) Co. Ltd.
  • V.T. Foods Pvt. Ltd.
  • Daksh Foods Pvt. Ltd.
  • Handan Green and Healthy Dehydrated Vegetables Food Co. Ltd.
Customization Available Upon Request

Key Segments Profiled in the Dehydrated Garlic Industry Survey

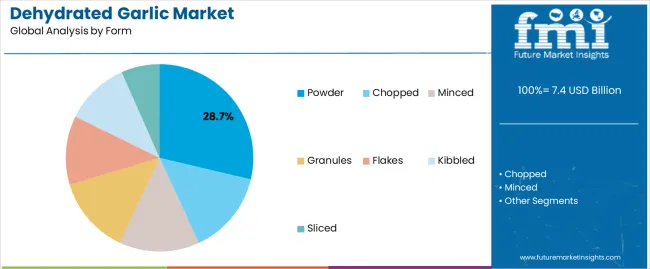
By Form:

  • Granules
  • Flakes
  • Powder
  • Chopped
  • Minced

By Variety:

  • Toasted
  • Fried

By End Use:

  • Food Industry
  • Sauces
  • Soups
  • Salad Dressings
  • Gravies
  • Frozen Foods
  • Snack Foods
  • Meat and Processed Foods
  • Others (Instant Food Products)

By Region:

  • North America
  • Latin America
  • Western Europe
  • Eastern Europe
  • Asia Pacific Excluding Japan
  • Japan
  • Middle East and Africa

Frequently Asked Questions

The global dehydrated garlic market is set to exceed US$ 10.9 Billion in 2032.

Asia Pacific is set to lead the dehydrated garlic market in the forecast period.

Krushi Food Industries, Chiping ShengKang Foodstuff Co., Ltd., Xuzhou Liming Food Co., Ltd., Henan Sunny Foodstuff Co., Ltd., Oceanic Foods Limited, and Garlico Industries Ltd. are some of the renowned companies in the dehydrated garlic market.

Table of Content

1. Executive Summary | Dehydrated Garlic Market

    1.1. Global Market Outlook

    1.2. Demand-side Trends

    1.3. Supply-side Trends

    1.4. Technology Roadmap Analysis

    1.5. Analysis and Recommendations

2. Market Overview

    2.1. Market Coverage / Taxonomy

    2.2. Market Definition / Scope / Limitations

3. Market Background

    3.1. Market Dynamics

        3.1.1. Drivers

        3.1.2. Restraints

        3.1.3. Opportunity

        3.1.4. Trends

    3.2. Scenario Forecast

        3.2.1. Demand in Optimistic Scenario

        3.2.2. Demand in Likely Scenario

        3.2.3. Demand in Conservative Scenario

    3.3. Opportunity Map Analysis

    3.4. Product Life Cycle Analysis

    3.5. Supply Chain Analysis

        3.5.1. Supply Side Participants and their Roles

            3.5.1.1. Producers

            3.5.1.2. Mid-Level Participants (Traders/ Agents/ Brokers)

            3.5.1.3. Wholesalers and Distributors

        3.5.2. Value Added and Value Created at Node in the Supply Chain

        3.5.3. List of Raw Material Suppliers

        3.5.4. List of Existing and Potential Buyers

    3.6. Investment Feasibility Matrix

    3.7. Value Chain Analysis

        3.7.1. Profit Margin Analysis

        3.7.2. Wholesalers and Distributors

        3.7.3. Retailers

    3.8. PESTLE and Porter’s Analysis

    3.9. Regulatory Landscape

        3.9.1. By Key Regions

        3.9.2. By Key Countries

    3.10. Regional Parent Market Outlook

    3.11. Production and Consumption Statistics

    3.12. Import and Export Statistics

4. Global Market Analysis 2017 to 2021 and Forecast, 2022 to 2032

    4.1. Historical Market Size Value (US$ Million) & Volume (Tons) Analysis, 2017 to 2021

    4.2. Current and Future Market Size Value (US$ Million) & Volume (Tons) Projections, 2022 to 2032

        4.2.1. Y-o-Y Growth Trend Analysis

        4.2.2. Absolute $ Opportunity Analysis

5. Global Market Analysis 2017 to 2021 and Forecast 2022 to 2032, By Form

    5.1. Introduction / Key Findings

    5.2. Historical Market Size Value (US$ Million) & Volume (Tons) Analysis By Form, 2017 to 2021

    5.3. Current and Future Market Size Value (US$ Million) & Volume (Tons) Analysis and Forecast By Form, 2022 to 2032

        5.3.1. Granules

        5.3.2. Flakes

        5.3.3. Powder

        5.3.4. Chopped

        5.3.5. Minced

    5.4. Y-o-Y Growth Trend Analysis By Form, 2017 to 2021

    5.5. Absolute $ Opportunity Analysis By Form, 2022 to 2032

6. Global Market Analysis 2017 to 2021 and Forecast 2022 to 2032, By Varieties

    6.1. Introduction / Key Findings

    6.2. Historical Market Size Value (US$ Million) & Volume (Tons) Analysis By Varieties, 2017 to 2021

    6.3. Current and Future Market Size Value (US$ Million) & Volume (Tons) Analysis and Forecast By Varieties, 2022 to 2032

        6.3.1. Toasted

        6.3.2. Fried

    6.4. Y-o-Y Growth Trend Analysis By Varieties, 2017 to 2021

    6.5. Absolute $ Opportunity Analysis By Varieties, 2022 to 2032

7. Global Market Analysis 2017 to 2021 and Forecast 2022 to 2032, By End Use

    7.1. Introduction / Key Findings

    7.2. Historical Market Size Value (US$ Million) & Volume (Tons) Analysis By End Use, 2017 to 2021

    7.3. Current and Future Market Size Value (US$ Million) & Volume (Tons) Analysis and Forecast By End Use, 2022 to 2032

        7.3.1. Food Industry

            7.3.1.1. Sauces

            7.3.1.2. Soups

            7.3.1.3. Salad Dressings

            7.3.1.4. Gravies

        7.3.2. Frozen Foods

        7.3.3. Snack Foods

        7.3.4. Meat and Processed Foods

        7.3.5. Others

    7.4. Y-o-Y Growth Trend Analysis By End Use, 2017 to 2021

    7.5. Absolute $ Opportunity Analysis By End Use, 2022 to 2032

8. Global Market Analysis 2017 to 2021 and Forecast 2022 to 2032, By Region

    8.1. Introduction

    8.2. Historical Market Size Value (US$ Million) & Volume (Tons) Analysis By Region, 2017 to 2021

    8.3. Current Market Size Value (US$ Million) & Volume (Tons) Analysis and Forecast By Region, 2022 to 2032

        8.3.1. North America

        8.3.2. Latin America

        8.3.3. Europe

        8.3.4. Asia Pacific

        8.3.5. Middle East and Africa

    8.4. Market Attractiveness Analysis By Region

9. North America Market Analysis 2017 to 2021 and Forecast 2022 to 2032, By Country

    9.1. Historical Market Size Value (US$ Million) & Volume (Tons) Trend Analysis By Market Taxonomy, 2017 to 2021

    9.2. Market Size Value (US$ Million) & Volume (Tons) Forecast By Market Taxonomy, 2022 to 2032

        9.2.1. By Country

            9.2.1.1. USA

            9.2.1.2. Canada

        9.2.2. By Form

        9.2.3. By Varieties

        9.2.4. By End Use

    9.3. Market Attractiveness Analysis

        9.3.1. By Country

        9.3.2. By Form

        9.3.3. By Varieties

        9.3.4. By End Use

    9.4. Key Takeaways

10. Latin America Market Analysis 2017 to 2021 and Forecast 2022 to 2032, By Country

    10.1. Historical Market Size Value (US$ Million) & Volume (Tons) Trend Analysis By Market Taxonomy, 2017 to 2021

    10.2. Market Size Value (US$ Million) & Volume (Tons) Forecast By Market Taxonomy, 2022 to 2032

        10.2.1. By Country

            10.2.1.1. Brazil

            10.2.1.2. Mexico

            10.2.1.3. Rest of Latin America

        10.2.2. By Form

        10.2.3. By Varieties

        10.2.4. By End Use

    10.3. Market Attractiveness Analysis

        10.3.1. By Country

        10.3.2. By Form

        10.3.3. By Varieties

        10.3.4. By End Use

    10.4. Key Takeaways

11. Europe Market Analysis 2017 to 2021 and Forecast 2022 to 2032, By Country

    11.1. Historical Market Size Value (US$ Million) & Volume (Tons) Trend Analysis By Market Taxonomy, 2017 to 2021

    11.2. Market Size Value (US$ Million) & Volume (Tons) Forecast By Market Taxonomy, 2022 to 2032

        11.2.1. By Country

            11.2.1.1. Germany

            11.2.1.2. United Kingdom

            11.2.1.3. France

            11.2.1.4. Spain

            11.2.1.5. Italy

            11.2.1.6. Rest of Europe

        11.2.2. By Form

        11.2.3. By Varieties

        11.2.4. By End Use

    11.3. Market Attractiveness Analysis

        11.3.1. By Country

        11.3.2. By Form

        11.3.3. By Varieties

        11.3.4. By End Use

    11.4. Key Takeaways

12. Asia Pacific Market Analysis 2017 to 2021 and Forecast 2022 to 2032, By Country

    12.1. Historical Market Size Value (US$ Million) & Volume (Tons) Trend Analysis By Market Taxonomy, 2017 to 2021

    12.2. Market Size Value (US$ Million) & Volume (Tons) Forecast By Market Taxonomy, 2022 to 2032

        12.2.1. By Country

            12.2.1.1. China

            12.2.1.2. Japan

            12.2.1.3. South Korea

            12.2.1.4. Malaysia

            12.2.1.5. Singapore

            12.2.1.6. Australia

            12.2.1.7. New Zealand

            12.2.1.8. Rest of Asia Pacific

        12.2.2. By Form

        12.2.3. By Varieties

        12.2.4. By End Use

    12.3. Market Attractiveness Analysis

        12.3.1. By Country

        12.3.2. By Form

        12.3.3. By Varieties

        12.3.4. By End Use

    12.4. Key Takeaways

13. Middle East and Africa Market Analysis 2017 to 2021 and Forecast 2022 to 2032, By Country

    13.1. Historical Market Size Value (US$ Million) & Volume (Tons) Trend Analysis By Market Taxonomy, 2017 to 2021

    13.2. Market Size Value (US$ Million) & Volume (Tons) Forecast By Market Taxonomy, 2022 to 2032

        13.2.1. By Country

            13.2.1.1. GCC Countries

            13.2.1.2. South Africa

            13.2.1.3. Israel

            13.2.1.4. Rest of Middle East and Africa

        13.2.2. By Form

        13.2.3. By Varieties

        13.2.4. By End Use

    13.3. Market Attractiveness Analysis

        13.3.1. By Country

        13.3.2. By Form

        13.3.3. By Varieties

        13.3.4. By End Use

    13.4. Key Takeaways

14. Key Countries Market Analysis

    14.1. USA

        14.1.1. Pricing Analysis

        14.1.2. Market Share Analysis, 2021

            14.1.2.1. By Form

            14.1.2.2. By Varieties

            14.1.2.3. By End Use

    14.2. Canada

        14.2.1. Pricing Analysis

        14.2.2. Market Share Analysis, 2021

            14.2.2.1. By Form

            14.2.2.2. By Varieties

            14.2.2.3. By End Use

    14.3. Brazil

        14.3.1. Pricing Analysis

        14.3.2. Market Share Analysis, 2021

            14.3.2.1. By Form

            14.3.2.2. By Varieties

            14.3.2.3. By End Use

    14.4. Mexico

        14.4.1. Pricing Analysis

        14.4.2. Market Share Analysis, 2021

            14.4.2.1. By Form

            14.4.2.2. By Varieties

            14.4.2.3. By End Use

    14.5. Germany

        14.5.1. Pricing Analysis

        14.5.2. Market Share Analysis, 2021

            14.5.2.1. By Form

            14.5.2.2. By Varieties

            14.5.2.3. By End Use

    14.6. United Kingdom

        14.6.1. Pricing Analysis

        14.6.2. Market Share Analysis, 2021

            14.6.2.1. By Form

            14.6.2.2. By Varieties

            14.6.2.3. By End Use

    14.7. France

        14.7.1. Pricing Analysis

        14.7.2. Market Share Analysis, 2021

            14.7.2.1. By Form

            14.7.2.2. By Varieties

            14.7.2.3. By End Use

    14.8. Spain

        14.8.1. Pricing Analysis

        14.8.2. Market Share Analysis, 2021

            14.8.2.1. By Form

            14.8.2.2. By Varieties

            14.8.2.3. By End Use

    14.9. Italy

        14.9.1. Pricing Analysis

        14.9.2. Market Share Analysis, 2021

            14.9.2.1. By Form

            14.9.2.2. By Varieties

            14.9.2.3. By End Use

    14.10. China

        14.10.1. Pricing Analysis

        14.10.2. Market Share Analysis, 2021

            14.10.2.1. By Form

            14.10.2.2. By Varieties

            14.10.2.3. By End Use

    14.11. Japan

        14.11.1. Pricing Analysis

        14.11.2. Market Share Analysis, 2021

            14.11.2.1. By Form

            14.11.2.2. By Varieties

            14.11.2.3. By End Use

    14.12. South Korea

        14.12.1. Pricing Analysis

        14.12.2. Market Share Analysis, 2021

            14.12.2.1. By Form

            14.12.2.2. By Varieties

            14.12.2.3. By End Use

    14.13. Malaysia

        14.13.1. Pricing Analysis

        14.13.2. Market Share Analysis, 2021

            14.13.2.1. By Form

            14.13.2.2. By Varieties

            14.13.2.3. By End Use

    14.14. Singapore

        14.14.1. Pricing Analysis

        14.14.2. Market Share Analysis, 2021

            14.14.2.1. By Form

            14.14.2.2. By Varieties

            14.14.2.3. By End Use

    14.15. Australia

        14.15.1. Pricing Analysis

        14.15.2. Market Share Analysis, 2021

            14.15.2.1. By Form

            14.15.2.2. By Varieties

            14.15.2.3. By End Use

    14.16. New Zealand

        14.16.1. Pricing Analysis

        14.16.2. Market Share Analysis, 2021

            14.16.2.1. By Form

            14.16.2.2. By Varieties

            14.16.2.3. By End Use

    14.17. GCC Countries

        14.17.1. Pricing Analysis

        14.17.2. Market Share Analysis, 2021

            14.17.2.1. By Form

            14.17.2.2. By Varieties

            14.17.2.3. By End Use

    14.18. South Africa

        14.18.1. Pricing Analysis

        14.18.2. Market Share Analysis, 2021

            14.18.2.1. By Form

            14.18.2.2. By Varieties

            14.18.2.3. By End Use

    14.19. Israel

        14.19.1. Pricing Analysis

        14.19.2. Market Share Analysis, 2021

            14.19.2.1. By Form

            14.19.2.2. By Varieties

            14.19.2.3. By End Use

15. Market Structure Analysis

    15.1. Competition Dashboard

    15.2. Competition Benchmarking

    15.3. Market Share Analysis of Top Players

        15.3.1. By Regional

        15.3.2. By Form

        15.3.3. By Varieties

        15.3.4. By End Use

16. Competition Analysis

    16.1. Competition Deep Dive

        16.1.1. Chiping ShengKang Foodstuff

            16.1.1.1. Overview

            16.1.1.2. Product Portfolio

            16.1.1.3. Profitability by Market Segments

            16.1.1.4. Sales Footprint

            16.1.1.5. Strategy Overview

                16.1.1.5.1. Marketing Strategy

                16.1.1.5.2. Product Strategy

                16.1.1.5.3. Channel Strategy

        16.1.2. Henan Sunny Foodstuff

            16.1.2.1. Overview

            16.1.2.2. Product Portfolio

            16.1.2.3. Profitability by Market Segments

            16.1.2.4. Sales Footprint

            16.1.2.5. Strategy Overview

                16.1.2.5.1. Marketing Strategy

                16.1.2.5.2. Product Strategy

                16.1.2.5.3. Channel Strategy

        16.1.3. B.C. Foods

            16.1.3.1. Overview

            16.1.3.2. Product Portfolio

            16.1.3.3. Profitability by Market Segments

            16.1.3.4. Sales Footprint

            16.1.3.5. Strategy Overview

                16.1.3.5.1. Marketing Strategy

                16.1.3.5.2. Product Strategy

                16.1.3.5.3. Channel Strategy

        16.1.4. Daksh Foods Pvt. Ltd

            16.1.4.1. Overview

            16.1.4.2. Product Portfolio

            16.1.4.3. Profitability by Market Segments

            16.1.4.4. Sales Footprint

            16.1.4.5. Strategy Overview

                16.1.4.5.1. Marketing Strategy

                16.1.4.5.2. Product Strategy

                16.1.4.5.3. Channel Strategy

        16.1.5. Handan Green

            16.1.5.1. Overview

            16.1.5.2. Product Portfolio

            16.1.5.3. Profitability by Market Segments

            16.1.5.4. Sales Footprint

            16.1.5.5. Strategy Overview

                16.1.5.5.1. Marketing Strategy

                16.1.5.5.2. Product Strategy

                16.1.5.5.3. Channel Strategy

        16.1.6. Oceanic Foods Limited

            16.1.6.1. Overview

            16.1.6.2. Product Portfolio

            16.1.6.3. Profitability by Market Segments

            16.1.6.4. Sales Footprint

            16.1.6.5. Strategy Overview

                16.1.6.5.1. Marketing Strategy

                16.1.6.5.2. Product Strategy

                16.1.6.5.3. Channel Strategy

        16.1.7. Krushi Food Industries

            16.1.7.1. Overview

            16.1.7.2. Product Portfolio

            16.1.7.3. Profitability by Market Segments

            16.1.7.4. Sales Footprint

            16.1.7.5. Strategy Overview

                16.1.7.5.1. Marketing Strategy

                16.1.7.5.2. Product Strategy

                16.1.7.5.3. Channel Strategy

        16.1.8. V.T. Foods Pvt. Ltd

            16.1.8.1. Overview

            16.1.8.2. Product Portfolio

            16.1.8.3. Profitability by Market Segments

            16.1.8.4. Sales Footprint

            16.1.8.5. Strategy Overview

                16.1.8.5.1. Marketing Strategy

                16.1.8.5.2. Product Strategy

                16.1.8.5.3. Channel Strategy

        16.1.9. Xuzhou Liming Food

            16.1.9.1. Overview

            16.1.9.2. Product Portfolio

            16.1.9.3. Profitability by Market Segments

            16.1.9.4. Sales Footprint

            16.1.9.5. Strategy Overview

                16.1.9.5.1. Marketing Strategy

                16.1.9.5.2. Product Strategy

                16.1.9.5.3. Channel Strategy

        16.1.10. Royal (Jinxiang) Garlic Co

            16.1.10.1. Overview

            16.1.10.2. Product Portfolio

            16.1.10.3. Profitability by Market Segments

            16.1.10.4. Sales Footprint

            16.1.10.5. Strategy Overview

                16.1.10.5.1. Marketing Strategy

                16.1.10.5.2. Product Strategy

                16.1.10.5.3. Channel Strategy

17. Assumptions & Acronyms Used

18. Research Methodology

Don't pay for what you don't need

Customize your report by selecting specific countries or regions and save 30%!

List of Tables

Table 1: Global Market Value (US$ Million) Forecast by Region, 2017 to 2032

Table 2: Global Market Volume (Tons) Forecast by Region, 2017 to 2032

Table 3: Global Market Value (US$ Million) Forecast by Form, 2017 to 2032

Table 4: Global Market Volume (Tons) Forecast by Form, 2017 to 2032

Table 5: Global Market Value (US$ Million) Forecast by Varieties, 2017 to 2032

Table 6: Global Market Volume (Tons) Forecast by Varieties, 2017 to 2032

Table 7: Global Market Value (US$ Million) Forecast by End Use, 2017 to 2032

Table 8: Global Market Volume (Tons) Forecast by End Use, 2017 to 2032

Table 9: North America Market Value (US$ Million) Forecast by Country, 2017 to 2032

Table 10: North America Market Volume (Tons) Forecast by Country, 2017 to 2032

Table 11: North America Market Value (US$ Million) Forecast by Form, 2017 to 2032

Table 12: North America Market Volume (Tons) Forecast by Form, 2017 to 2032

Table 13: North America Market Value (US$ Million) Forecast by Varieties, 2017 to 2032

Table 14: North America Market Volume (Tons) Forecast by Varieties, 2017 to 2032

Table 15: North America Market Value (US$ Million) Forecast by End Use, 2017 to 2032

Table 16: North America Market Volume (Tons) Forecast by End Use, 2017 to 2032

Table 17: Latin America Market Value (US$ Million) Forecast by Country, 2017 to 2032

Table 18: Latin America Market Volume (Tons) Forecast by Country, 2017 to 2032

Table 19: Latin America Market Value (US$ Million) Forecast by Form, 2017 to 2032

Table 20: Latin America Market Volume (Tons) Forecast by Form, 2017 to 2032

Table 21: Latin America Market Value (US$ Million) Forecast by Varieties, 2017 to 2032

Table 22: Latin America Market Volume (Tons) Forecast by Varieties, 2017 to 2032

Table 23: Latin America Market Value (US$ Million) Forecast by End Use, 2017 to 2032

Table 24: Latin America Market Volume (Tons) Forecast by End Use, 2017 to 2032

Table 25: Europe Market Value (US$ Million) Forecast by Country, 2017 to 2032

Table 26: Europe Market Volume (Tons) Forecast by Country, 2017 to 2032

Table 27: Europe Market Value (US$ Million) Forecast by Form, 2017 to 2032

Table 28: Europe Market Volume (Tons) Forecast by Form, 2017 to 2032

Table 29: Europe Market Value (US$ Million) Forecast by Varieties, 2017 to 2032

Table 30: Europe Market Volume (Tons) Forecast by Varieties, 2017 to 2032

Table 31: Europe Market Value (US$ Million) Forecast by End Use, 2017 to 2032

Table 32: Europe Market Volume (Tons) Forecast by End Use, 2017 to 2032

Table 33: Asia Pacific Market Value (US$ Million) Forecast by Country, 2017 to 2032

Table 34: Asia Pacific Market Volume (Tons) Forecast by Country, 2017 to 2032

Table 35: Asia Pacific Market Value (US$ Million) Forecast by Form, 2017 to 2032

Table 36: Asia Pacific Market Volume (Tons) Forecast by Form, 2017 to 2032

Table 37: Asia Pacific Market Value (US$ Million) Forecast by Varieties, 2017 to 2032

Table 38: Asia Pacific Market Volume (Tons) Forecast by Varieties, 2017 to 2032

Table 39: Asia Pacific Market Value (US$ Million) Forecast by End Use, 2017 to 2032

Table 40: Asia Pacific Market Volume (Tons) Forecast by End Use, 2017 to 2032

Table 41: Middle East and Africa Market Value (US$ Million) Forecast by Country, 2017 to 2032

Table 42: Middle East and Africa Market Volume (Tons) Forecast by Country, 2017 to 2032

Table 43: Middle East and Africa Market Value (US$ Million) Forecast by Form, 2017 to 2032

Table 44: Middle East and Africa Market Volume (Tons) Forecast by Form, 2017 to 2032

Table 45: Middle East and Africa Market Value (US$ Million) Forecast by Varieties, 2017 to 2032

Table 46: Middle East and Africa Market Volume (Tons) Forecast by Varieties, 2017 to 2032

Table 47: Middle East and Africa Market Value (US$ Million) Forecast by End Use, 2017 to 2032

Table 48: Middle East and Africa Market Volume (Tons) Forecast by End Use, 2017 to 2032
Nandini Roy Choudhury

Principal Consultant

Talk to Analyst

Find your sweet spots for generating winning opportunities in this market.

List of Charts

Figure 1: Global Market Value (US$ Million) by Form, 2022 to 2032

Figure 2: Global Market Value (US$ Million) by Varieties, 2022 to 2032

Figure 3: Global Market Value (US$ Million) by End Use, 2022 to 2032

Figure 4: Global Market Value (US$ Million) by Region, 2022 to 2032

Figure 5: Global Market Value (US$ Million) Analysis by Region, 2017 to 2032

Figure 6: Global Market Volume (Tons) Analysis by Region, 2017 to 2032

Figure 7: Global Market Value Share (%) and BPS Analysis by Region, 2022 to 2032

Figure 8: Global Market Y-o-Y Growth (%) Projections by Region, 2022 to 2032

Figure 9: Global Market Value (US$ Million) Analysis by Form, 2017 to 2032

Figure 10: Global Market Volume (Tons) Analysis by Form, 2017 to 2032

Figure 11: Global Market Value Share (%) and BPS Analysis by Form, 2022 to 2032

Figure 12: Global Market Y-o-Y Growth (%) Projections by Form, 2022 to 2032

Figure 13: Global Market Value (US$ Million) Analysis by Varieties, 2017 to 2032

Figure 14: Global Market Volume (Tons) Analysis by Varieties, 2017 to 2032

Figure 15: Global Market Value Share (%) and BPS Analysis by Varieties, 2022 to 2032

Figure 16: Global Market Y-o-Y Growth (%) Projections by Varieties, 2022 to 2032

Figure 17: Global Market Value (US$ Million) Analysis by End Use, 2017 to 2032

Figure 18: Global Market Volume (Tons) Analysis by End Use, 2017 to 2032

Figure 19: Global Market Value Share (%) and BPS Analysis by End Use, 2022 to 2032

Figure 20: Global Market Y-o-Y Growth (%) Projections by End Use, 2022 to 2032

Figure 21: Global Market Attractiveness by Form, 2022 to 2032

Figure 22: Global Market Attractiveness by Varieties, 2022 to 2032

Figure 23: Global Market Attractiveness by End Use, 2022 to 2032

Figure 24: Global Market Attractiveness by Region, 2022 to 2032

Figure 25: North America Market Value (US$ Million) by Form, 2022 to 2032

Figure 26: North America Market Value (US$ Million) by Varieties, 2022 to 2032

Figure 27: North America Market Value (US$ Million) by End Use, 2022 to 2032

Figure 28: North America Market Value (US$ Million) by Country, 2022 to 2032

Figure 29: North America Market Value (US$ Million) Analysis by Country, 2017 to 2032

Figure 30: North America Market Volume (Tons) Analysis by Country, 2017 to 2032

Figure 31: North America Market Value Share (%) and BPS Analysis by Country, 2022 to 2032

Figure 32: North America Market Y-o-Y Growth (%) Projections by Country, 2022 to 2032

Figure 33: North America Market Value (US$ Million) Analysis by Form, 2017 to 2032

Figure 34: North America Market Volume (Tons) Analysis by Form, 2017 to 2032

Figure 35: North America Market Value Share (%) and BPS Analysis by Form, 2022 to 2032

Figure 36: North America Market Y-o-Y Growth (%) Projections by Form, 2022 to 2032

Figure 37: North America Market Value (US$ Million) Analysis by Varieties, 2017 to 2032

Figure 38: North America Market Volume (Tons) Analysis by Varieties, 2017 to 2032

Figure 39: North America Market Value Share (%) and BPS Analysis by Varieties, 2022 to 2032

Figure 40: North America Market Y-o-Y Growth (%) Projections by Varieties, 2022 to 2032

Figure 41: North America Market Value (US$ Million) Analysis by End Use, 2017 to 2032

Figure 42: North America Market Volume (Tons) Analysis by End Use, 2017 to 2032

Figure 43: North America Market Value Share (%) and BPS Analysis by End Use, 2022 to 2032

Figure 44: North America Market Y-o-Y Growth (%) Projections by End Use, 2022 to 2032

Figure 45: North America Market Attractiveness by Form, 2022 to 2032

Figure 46: North America Market Attractiveness by Varieties, 2022 to 2032

Figure 47: North America Market Attractiveness by End Use, 2022 to 2032

Figure 48: North America Market Attractiveness by Country, 2022 to 2032

Figure 49: Latin America Market Value (US$ Million) by Form, 2022 to 2032

Figure 50: Latin America Market Value (US$ Million) by Varieties, 2022 to 2032

Figure 51: Latin America Market Value (US$ Million) by End Use, 2022 to 2032

Figure 52: Latin America Market Value (US$ Million) by Country, 2022 to 2032

Figure 53: Latin America Market Value (US$ Million) Analysis by Country, 2017 to 2032

Figure 54: Latin America Market Volume (Tons) Analysis by Country, 2017 to 2032

Figure 55: Latin America Market Value Share (%) and BPS Analysis by Country, 2022 to 2032

Figure 56: Latin America Market Y-o-Y Growth (%) Projections by Country, 2022 to 2032

Figure 57: Latin America Market Value (US$ Million) Analysis by Form, 2017 to 2032

Figure 58: Latin America Market Volume (Tons) Analysis by Form, 2017 to 2032

Figure 59: Latin America Market Value Share (%) and BPS Analysis by Form, 2022 to 2032

Figure 60: Latin America Market Y-o-Y Growth (%) Projections by Form, 2022 to 2032

Figure 61: Latin America Market Value (US$ Million) Analysis by Varieties, 2017 to 2032

Figure 62: Latin America Market Volume (Tons) Analysis by Varieties, 2017 to 2032

Figure 63: Latin America Market Value Share (%) and BPS Analysis by Varieties, 2022 to 2032

Figure 64: Latin America Market Y-o-Y Growth (%) Projections by Varieties, 2022 to 2032

Figure 65: Latin America Market Value (US$ Million) Analysis by End Use, 2017 to 2032

Figure 66: Latin America Market Volume (Tons) Analysis by End Use, 2017 to 2032

Figure 67: Latin America Market Value Share (%) and BPS Analysis by End Use, 2022 to 2032

Figure 68: Latin America Market Y-o-Y Growth (%) Projections by End Use, 2022 to 2032

Figure 69: Latin America Market Attractiveness by Form, 2022 to 2032

Figure 70: Latin America Market Attractiveness by Varieties, 2022 to 2032

Figure 71: Latin America Market Attractiveness by End Use, 2022 to 2032

Figure 72: Latin America Market Attractiveness by Country, 2022 to 2032

Figure 73: Europe Market Value (US$ Million) by Form, 2022 to 2032

Figure 74: Europe Market Value (US$ Million) by Varieties, 2022 to 2032

Figure 75: Europe Market Value (US$ Million) by End Use, 2022 to 2032

Figure 76: Europe Market Value (US$ Million) by Country, 2022 to 2032

Figure 77: Europe Market Value (US$ Million) Analysis by Country, 2017 to 2032

Figure 78: Europe Market Volume (Tons) Analysis by Country, 2017 to 2032

Figure 79: Europe Market Value Share (%) and BPS Analysis by Country, 2022 to 2032

Figure 80: Europe Market Y-o-Y Growth (%) Projections by Country, 2022 to 2032

Figure 81: Europe Market Value (US$ Million) Analysis by Form, 2017 to 2032

Figure 82: Europe Market Volume (Tons) Analysis by Form, 2017 to 2032

Figure 83: Europe Market Value Share (%) and BPS Analysis by Form, 2022 to 2032

Figure 84: Europe Market Y-o-Y Growth (%) Projections by Form, 2022 to 2032

Figure 85: Europe Market Value (US$ Million) Analysis by Varieties, 2017 to 2032

Figure 86: Europe Market Volume (Tons) Analysis by Varieties, 2017 to 2032

Figure 87: Europe Market Value Share (%) and BPS Analysis by Varieties, 2022 to 2032

Figure 88: Europe Market Y-o-Y Growth (%) Projections by Varieties, 2022 to 2032

Figure 89: Europe Market Value (US$ Million) Analysis by End Use, 2017 to 2032

Figure 90: Europe Market Volume (Tons) Analysis by End Use, 2017 to 2032

Figure 91: Europe Market Value Share (%) and BPS Analysis by End Use, 2022 to 2032

Figure 92: Europe Market Y-o-Y Growth (%) Projections by End Use, 2022 to 2032

Figure 93: Europe Market Attractiveness by Form, 2022 to 2032

Figure 94: Europe Market Attractiveness by Varieties, 2022 to 2032

Figure 95: Europe Market Attractiveness by End Use, 2022 to 2032

Figure 96: Europe Market Attractiveness by Country, 2022 to 2032

Figure 97: Asia Pacific Market Value (US$ Million) by Form, 2022 to 2032

Figure 98: Asia Pacific Market Value (US$ Million) by Varieties, 2022 to 2032

Figure 99: Asia Pacific Market Value (US$ Million) by End Use, 2022 to 2032

Figure 100: Asia Pacific Market Value (US$ Million) by Country, 2022 to 2032

Figure 101: Asia Pacific Market Value (US$ Million) Analysis by Country, 2017 to 2032

Figure 102: Asia Pacific Market Volume (Tons) Analysis by Country, 2017 to 2032

Figure 103: Asia Pacific Market Value Share (%) and BPS Analysis by Country, 2022 to 2032

Figure 104: Asia Pacific Market Y-o-Y Growth (%) Projections by Country, 2022 to 2032

Figure 105: Asia Pacific Market Value (US$ Million) Analysis by Form, 2017 to 2032

Figure 106: Asia Pacific Market Volume (Tons) Analysis by Form, 2017 to 2032

Figure 107: Asia Pacific Market Value Share (%) and BPS Analysis by Form, 2022 to 2032

Figure 108: Asia Pacific Market Y-o-Y Growth (%) Projections by Form, 2022 to 2032

Figure 109: Asia Pacific Market Value (US$ Million) Analysis by Varieties, 2017 to 2032

Figure 110: Asia Pacific Market Volume (Tons) Analysis by Varieties, 2017 to 2032

Figure 111: Asia Pacific Market Value Share (%) and BPS Analysis by Varieties, 2022 to 2032

Figure 112: Asia Pacific Market Y-o-Y Growth (%) Projections by Varieties, 2022 to 2032

Figure 113: Asia Pacific Market Value (US$ Million) Analysis by End Use, 2017 to 2032

Figure 114: Asia Pacific Market Volume (Tons) Analysis by End Use, 2017 to 2032

Figure 115: Asia Pacific Market Value Share (%) and BPS Analysis by End Use, 2022 to 2032

Figure 116: Asia Pacific Market Y-o-Y Growth (%) Projections by End Use, 2022 to 2032

Figure 117: Asia Pacific Market Attractiveness by Form, 2022 to 2032

Figure 118: Asia Pacific Market Attractiveness by Varieties, 2022 to 2032

Figure 119: Asia Pacific Market Attractiveness by End Use, 2022 to 2032

Figure 120: Asia Pacific Market Attractiveness by Country, 2022 to 2032

Figure 121: Middle East and Africa Market Value (US$ Million) by Form, 2022 to 2032

Figure 122: Middle East and Africa Market Value (US$ Million) by Varieties, 2022 to 2032

Figure 123: Middle East and Africa Market Value (US$ Million) by End Use, 2022 to 2032

Figure 124: Middle East and Africa Market Value (US$ Million) by Country, 2022 to 2032

Figure 125: Middle East and Africa Market Value (US$ Million) Analysis by Country, 2017 to 2032

Figure 126: Middle East and Africa Market Volume (Tons) Analysis by Country, 2017 to 2032

Figure 127: Middle East and Africa Market Value Share (%) and BPS Analysis by Country, 2022 to 2032

Figure 128: Middle East and Africa Market Y-o-Y Growth (%) Projections by Country, 2022 to 2032

Figure 129: Middle East and Africa Market Value (US$ Million) Analysis by Form, 2017 to 2032

Figure 130: Middle East and Africa Market Volume (Tons) Analysis by Form, 2017 to 2032

Figure 131: Middle East and Africa Market Value Share (%) and BPS Analysis by Form, 2022 to 2032

Figure 132: Middle East and Africa Market Y-o-Y Growth (%) Projections by Form, 2022 to 2032

Figure 133: Middle East and Africa Market Value (US$ Million) Analysis by Varieties, 2017 to 2032

Figure 134: Middle East and Africa Market Volume (Tons) Analysis by Varieties, 2017 to 2032

Figure 135: Middle East and Africa Market Value Share (%) and BPS Analysis by Varieties, 2022 to 2032

Figure 136: Middle East and Africa Market Y-o-Y Growth (%) Projections by Varieties, 2022 to 2032

Figure 137: Middle East and Africa Market Value (US$ Million) Analysis by End Use, 2017 to 2032

Figure 138: Middle East and Africa Market Volume (Tons) Analysis by End Use, 2017 to 2032

Figure 139: Middle East and Africa Market Value Share (%) and BPS Analysis by End Use, 2022 to 2032

Figure 140: Middle East and Africa Market Y-o-Y Growth (%) Projections by End Use, 2022 to 2032

Figure 141: Middle East and Africa Market Attractiveness by Form, 2022 to 2032

Figure 142: Middle East and Africa Market Attractiveness by Varieties, 2022 to 2032

Figure 143: Middle East and Africa Market Attractiveness by End Use, 2022 to 2032

Figure 144: Middle East and Africa Market Attractiveness by Country, 2022 to 2032

Recommendations

Food and Beverage

Dehydrated Onions Market

Published : May 2023

Food and Beverage

Dehydrated Pet Food Market

Published : May 2023

Food and Beverage

Dehydrated Vegetables Market

Published : April 2023

Food and Beverage

Dehydrated Meat Product Market

Published : October 2022

Explore Food and Beverage Insights

View Reports