Dehydrated Onions Market Size and Share Forecast Outlook 2025 to 2035

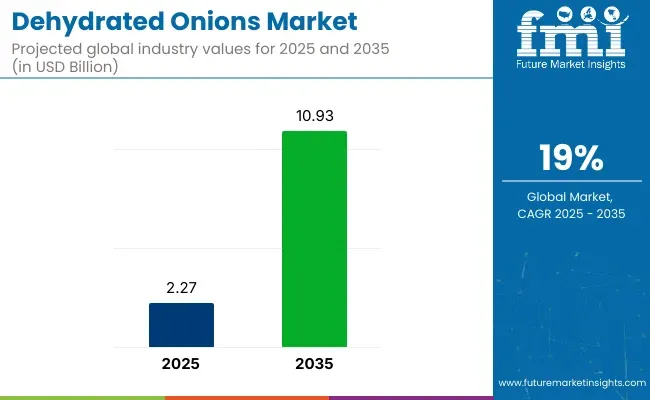
The dehydrated onions market is valued at USD 2.27 billion in 2025 and is poised to surge to USD 10.93 billion by 2035, reflecting a strong CAGR of 19% over the forecast period. India is positioned as the most lucrative market, owing to its robust agricultural infrastructure, cost-competitive supply chain, and significant share in global onion exports.
Meanwhile, China is expected to emerge as the fastest-growing market, driven by urbanization, evolving dietary preferences, and rising demand for convenient, nutritious meal components.

The market’s expansion is being driven by the growing demand for ready-to-eat and processed food products. Dehydrated onions, recognized for their extended shelf life, strong aroma, and concentrated flavor, are widely used in snacks, soups, sauces, seasoning blends, and meat dishes.

Their convenience and ease of storage make them ideal for institutional kitchens, restaurants, and food processors. The acceleration in fast food consumption, growing interest in low-calorie, plant-based options, and the rapid growth of online retail are further fueling demand. However, challenges such as raw material price volatility, seasonal dependence, and inconsistent product quality across suppliers are expected to slightly temper growth potential.

Looking ahead, the market is expected to witness stable yet diversified growth across both organic and conventional segments. Increasing health consciousness is spurring demand for organic dehydrated onions, while conventional types continue to hold a prominent volume share.

Technological improvements in spray drying and microwave drying are enhancing efficiency, reducing moisture levels more effectively, and preserving flavor. Simultaneously, a shift toward clean-label products, sustainable sourcing, and transparent labeling practices is reshaping product innovation and marketing strategies.

Dehydrated Onions Market

Metric Value
Estimated Size (2025E) USD 2.27 billion
Projected Value (2035F) USD 10.93 billion
Value-based CAGR (2025 to 2035) 19%

As B2C channels expand and e-commerce matures, dehydrated onions are poised to become a mainstay ingredient in global processed foods, catering to both retail and industrial consumers. Manufacturers are heavily investing in research and development to launch enhanced quality of products.

Analyzing Dehydrated Onions Market by Top Investment Segments

The dehydrated onions market is segmented based on nature, form, variety, technology, end use, distribution channel, and region. By nature, the market comprises organic and conventional onions. In terms of form, key segments include flakes, granules, powder, chopped, minced, sliced, and kibbled. By variety, the market is divided into white, red, pink, and hybrid onions.

In the technology category, the market includes spray drying, air drying, vacuum drying, microwave drying, freeze drying, and others (ready-to-mix meal kits, powdered soup blends, seasoning packets). Based on end use, the market spans food processing (ready meals, snacks & savory, dressing & sauces, infant food, soups, and others), food service providers, and retail/households.

By distribution channel, the market is segmented into B2B and B2C, further broken into hyper/supermarkets, convenience stores, specialty stores, traditional grocery retailers, and online retailers. Regionally, the market covers North America, Latin America, Europe, Asia Pacific, and Middle East & Africa.

By Nature, Organic Dehydrated Onions Segment is Likely to be the Fastest Growing

The organic sub-segment is projected to experience the fastest growth over the forecast period, driven by increasing consumer demand for clean-label, pesticide-free food products. This segment is expected to witness a CAGR of 8.3% between 2025 and 2035, signaling a clear long-term investment opportunity.

Rising health consciousness and regulatory support for organic farming are shifting consumer and industry preferences away from conventional alternatives. While conventional dehydrated onions currently leading the market in terms of volume due to cost efficiency and broader availability, their growth is expected to decline as premiumization and quality differentiation reshape consumer buying patterns. Organic dehydrated onions are becoming mainstream in urban markets and are being increasingly incorporated into premium snack foods, sauces, and health-oriented ready meals.

Nature Segment CAGR (2025 to 2035)
Organic 8.3%

By Variety, White Onions Are Expected to Lead with Maximum Adoption

White onions are anticipated to prominent the dehydrated onions market, capturing the largest market share and registering a CAGR of 6.3% during the forecast period from 2025 to 2035. Their mild, slightly sweet flavor and consistent texture make them highly suitable for dehydration and food processing. White onions are widely used in processed products such as soups, sauces, dressings, seasoning blends, and ready-to-eat meals, owing to their flavor profile and long shelf life after dehydration.

Their versatility, availability, and ease of integration into mass-scale production systems make them the preferred choice among manufacturers and institutional food service providers. In contrast, red onions and hybrid varieties are projected to experience moderate growth, driven by their distinctive taste and aesthetic appeal in regional cuisines and specialty products.

However, challenges such as higher perishability, less flavor stability post-dehydration, and higher cost of processing limit their suitability for broader commercial use, thereby further strengthening the market position of white onions.

Variety Segment CAGR (2025 to 2035)
White Onion 6.3%

By Form, Granules Are Likely to Be the Fastest Growing

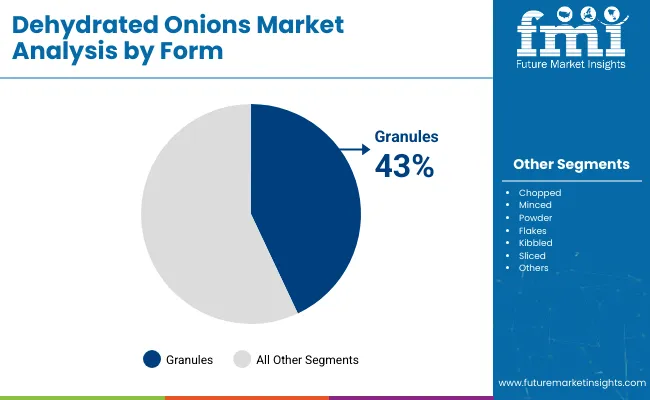
Granules are expected to achieve a CAGR of 7.4% during 2025 to 2035 and account for 43% share, contributing significantly to value growth in the form segment. The form-wise segmentation of the dehydrated onions market includes flakes, granules, powder, chopped, sliced, minced, kibbled, and others.

Among these, granules are projected to be the fastest-growing segment, owing to their superior ease of use, extended shelf life, and versatility in food applications. Granules blend seamlessly into soups, spice mixes, sauces, and ready-to-eat meals, making them a preferred choice for both industrial processors and household users.

While flakes and powder continue to maintain strong demand in traditional applications like seasonings and snacks, their growth is likely to be outpaced by granules due to increased automation in food manufacturing and the preference for uniformity in texture and rehydration properties. Chopped and sliced forms will witness moderate growth, primarily limited to niche culinary use-cases.

Dehydrated Onions Market By Form

Form Segment Share (2025)
Granules 43%

By End Use, Food Processing Segment to Account for Over 67% Market Share in 2025

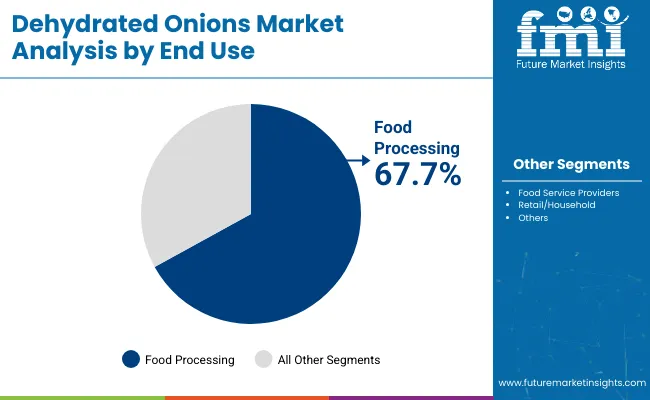
The food processing segment is expected to hold the largest market share in the dehydrated onions industry, accounting for 67.7% in 2025. This segment is driven by the widespread use of dehydrated onions in processed food products such as instant noodles, frozen meals, spice mixes, and canned soups.

Their long shelf life, concentrated flavor, and ease of storage make them ideal for mass production environments. Ready meals, soups, and snacks & savory segments will continue to grow steadily, supported by rising demand for convenience food. Retail/household consumption is also increasing, especially through e-commerce platforms offering small-pack formats.

Meanwhile, food service providers such as quick-service restaurants and institutional kitchens represent a growing share due to the need for time-efficient, flavor-consistent ingredients. Other segments like dressing & sauces, infant food, and others will maintain niche roles, with modest growth driven by product diversification and functional food trends.

Dehydrated Onions Market By End Use

End Use Segment Market Share (2025)
Food Processing 67.7%

By Technology, Spray Drying is Expected to Be the Fastest Growing Segment

Spray drying is poised to be the fastest-growing method from 2025 to 2035 and is forecasted to grow at a CAGR of 7.9% over the forecast period. This technique offers significant advantages such as rapid moisture removal, retention of flavor and nutrients, and uniform particle size, which are critical for industrial food applications.

Spray drying also supports large-scale, continuous production, making it highly efficient and cost-effective for bulk suppliers. While air drying and vacuum drying remain prevalent due to lower initial setup costs, their slower processing time and inconsistent results limit scalability.

Freeze drying, although premium in output quality, incurs high operational costs, restricting its use to specialized applications. Microwave drying and other emerging technologies may gain traction, but are currently constrained by technological and cost barriers.

Technology Segment CAGR (2025 to 2035)
Spray Drying 7.9%

By Distribution Channel, B2C Emerges as a Key Revenue Driver in the Dehydrated Onions Market

The B2C distribution segment is expected to grow at a CAGR of 8.5% between 2025 and 2035. While online retailers are the fastest-growing sub-channel, the B2C (Business-to-Consumer) segment as a whole is anticipated to remain a highly lucrative contributor to the dehydrated onions market between 2025 and 2035.

With growing urbanization, increased health consciousness, and demand for on-the-go cooking solutions, consumers are turning to B2C channels including supermarkets, specialty stores, and e-commerce for convenient access to dehydrated products. The B2C segment benefits from higher per-unit margins, product differentiation, and the growing popularity of premium, organic, and clean-label foods.

Consumers in urban and semi-urban areas are particularly drawn to these options as part of healthier meal planning. Moreover, retail brands are investing in shelf-ready packaging and QR code-based traceability features to enhance consumer trust and engagement. Loyalty programs, bundled promotions, and subscription-based delivery models are further strengthening repeat purchase behavior in the B2C space.

Distribution Channel CAGR (2025 to 2035)
B2C 8.5%

What is Primarily Driving the Market for Dehydrated Onions?

Increase in Demand for Convenience Food Affecting Growth

Customers are seeking convenience food increasingly to complement their hectic lifestyle. The demand for convenience food is driven by a busy lifestyle and aging population. Customers prioritize ease of use, packaging, nutritional value, safety, variety, and product appeal when purchasing convenience foods.

Some of the most favored vegetables in dehydrated formats include onions, broccoli, potatoes, and tomatoes, which have wide availability and are easy-to-cook. Dehydration technology can be used to process most vegetables, preserving nutritional content in addition to texture and flavor.

Manufacturers are focusing on producing dehydrated vegetables to gain a better market share to meet the high demand. The rapid growth of the food service industry in various developing markets is also expected to fuel demand.

Expanding Processed Foods Sector to Fuel the Market Expansion

Demanding work culture in cities has resulted in difficulties for consumers to spend time cooking food at home. Consumers have been driven to choose ready-to-eat meals or other convenience food options.

The increasing number of working women, globally, is also driving the global dehydrated onion market. According to the United States Department of Labor, there were 128.2 million working women in the United States in 2015, which is expected to reach 164.8 million by 2026.

Creating substantial growth potential for dehydrated vegetable products due to fast-paced lifestyles, consumers are looking for quick, inexpensive, and delectable food products. The need for dehydrated products is growing especially in tier-1 cities.

Market Competition

Food manufacturing companies are proactively implementing research and development and technology advances in response to the growing demand for healthier food by consumers. Many food companies are working to reduce the quantity of salt, sugar, and sodium in their products.

The key players in this market include:

  • Olam International
  • Jain Farm Fresh Foods Ltd
  • Daksh Foods Pvt. Ltd.
  • Jiyan Food Ingredients
  • Natural Dehydrated Vegetables Pvt. Ltd.
  • Real Dehydrates Pvt. Ltd.
  • Earth Expo Company
  • Kisan Foods
  • Harmony House Foods, Inc. Company
  • Silva International Inc. Company
  • Green Rootz
  • BC Foods Inc.
  • Suszarnia Warzyw Jaworski Sp. J.
  • Pardes Dehydration Company
  • Murtuza Foods Pvt. Ltd.
  • Darshan Foods Pvt. Ltd.
  • Garon Dehydrates Private Limited
  • Rocky Mountain Spice Company
  • R. J. Van Drunen & Sons, Inc.
  • German Foods

Some of the products being launched by the key players are:

  • In August 2017, ITC, one of India's foremost multi-business enterprise, announced its entry into the dehydrated vegetables market, providing consumers with healthy food.
  • In July 2020, BC Foods announced the acquisition of an onion and garlic dehydration facility from Darshan Foods in Gujarat, India, with the objective of meeting its geographical expansion needs.
  • In January 2021, Anuha Foods launched a new range of ready to cook products under its gluten free and dehydrated food product ranges under the Zilli’s brand including dehydrated onion flakes.
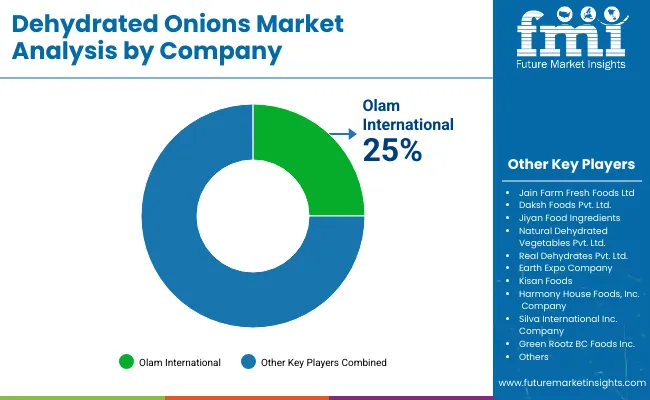
  • Food firm Olde Thompson was purchased by Olam International from Kainos Capital in 2021 for USD 950.00 million. The firm will be able to expand internationally in the spice market thanks to this acquisition. It increases OFI's private label possibilities and makes it possible for the company to offer customers a wide variety of robust, authentic, natural tastes and flavors with end-to-end sustainability as well as traceability.

Report Coverage for Global Dehydrated Onions Market

Report Attributes Details
Current Total Market Size (2025) USD 2.27 billion
Projected Market Size (2035) USD 10.93 billion
CAGR (2025 to 2035) 19%
Base Year for Estimation 2024
Historical Period 2020 to 2024
Projections Period 2025 to 2035
Report Analyzed on Parameters Revenue in USD billion, Volume in Metric Tons
By Nature(segment) Organic, Conventional
By Variety White Onion, Red Onion, Pink Onion, Hybrid
By Form Chopped, Minced, Granules, Powder, Flakes, Kibbled, Sliced
By End Use Food Processing, Dressing & Sauces, Ready Meals, Snacks & Savory, Infant Food, Soups, Others, Food Service Providers, Retail/Household
By Technology Air Drying, Vacuum Drying, Freeze Drying, Microwave Drying, Spray Drying, Others
Distribution Channels B2B, B2C, Hyper/Super Markets, Convenience Stores, Specialty Stores, Traditional Grocery Retailers, Online Retailers
Regions Covered North America, Europe, Asia-Pacific, Latin America, Middle East & Africa
Key Players Olam International, Jain Farm Fresh Foods Ltd, Daksh Foods Pvt. Ltd., Jiyan Food Ingredients, Natural Dehydrated Vegetables Pvt. Ltd., Real Dehydrates Pvt. Ltd., Earth Expo Company, Kisan Foods, Harmony House Foods, Inc., Silva International Inc., Green Rootz, BC Foods Inc., Suszarnia Warzyw Jaworski Sp. J., Pardes Dehydration Company, Murtuza Foods Pvt. Ltd., Darshan Foods Pvt. Ltd., Garon Dehydrates Private Limited, Rocky Mountain Spice Company, R. J. Van Drunen & Sons, Inc., German Foods

Key Segments Profiled in the Global Dehydrated Onions Market

By Nature:

  • Organic
  • Conventional

By Variety:

  • White Onion
  • Red Onion
  • Pink Onion
  • Hybrid

By Form:

  • Chopped
  • Minced
  • Granules
  • Powder
  • Flakes
  • Kibbled
  • Sliced

By End Use:

  • Food Processing
    • Dressing & Sauces
    • Ready Meals
    • Snacks & Savory
    • Infant Food
    • Soups
    • Others
  • Food Service Providers
  • Retail/Household

By Technology:

  • Air Drying
  • Vacuum Drying
  • Freeze Drying
  • Microwave Drying
  • Spray Drying
  • Others

By Distribution Channel:

  • B2B
  • B2C
    • Hyper/Super Markets
    • Convenience Stores
    • Specialty Stores
    • Traditional Grocery Retailers
    • Online Retailers

By Region:

  • North America
  • Latin America
  • Europe
  • Asia Pacific
  • Middle East and Africa

Table of Content

  • 1. Executive Summary
  • 2. Market Overview
  • 3. Market Background
  • 4. Global Market Analysis 2020 to 2024 and Forecast, 2025 to 2035
  • 5. Global Market Analysis 2020 to 2024 and Forecast 2025 to 2035, By Nature
    • 5.1. Organic
    • 5.2. Conventional
  • 6. Global Market Analysis 2020 to 2024 and Forecast 2025 to 2035, By Variety
    • 6.1. White Onion
    • 6.2. Red Onion
    • 6.3. Pink Onion
    • 6.4. Hybrid
  • 7. Global Market Analysis 2020 to 2024 and Forecast 2025 to 2035, By Form
    • 7.1. Chopped
    • 7.2. Minced
    • 7.3. Granules
    • 7.4. Powder
    • 7.5. Flakes
    • 7.6. Kibbled
    • 7.7. Sliced
  • 8. Global Market Analysis 2020 to 2024 and Forecast 2025 to 2035, By End Use
    • 8.1. Food Processing
      • 8.1.1. Dressing & Sauces
      • 8.1.2. Ready Meals
      • 8.1.3. Snacks & Savory
      • 8.1.4. Infant Food
      • 8.1.5. Soups
      • 8.1.6. Others
    • 8.2. Food Service Providers
    • 8.3. Retail/Household
  • 9. Global Market Analysis 2020 to 2024 and Forecast 2025 to 2035, By Technology
    • 9.1. Air Drying
    • 9.2. Vacuum Drying
    • 9.3. Freeze Drying
    • 9.4. Microwave Drying
    • 9.5. Spray Drying
    • 9.6. Others
  • 10. Global Market Analysis 2020 to 2024 and Forecast 2025 to 2035, By Distribution
    • 10.1. B2B
    • 10.2. B2C
      • 10.2.1. Hyper/Super Markets
      • 10.2.2. Convenience Stores
      • 10.2.3. Specialty Stores
      • 10.2.4. Traditional Grocery Retailers
      • 10.2.5. Online Retailers
  • 11. Global Market Analysis 2020 to 2024 and Forecast 2025 to 2035, By Region
    • 11.1. North America
    • 11.2. Latin America
    • 11.3. Europe
    • 11.4. Asia Pacific
    • 11.5. MEA
  • 12. North America Market Analysis 2020 to 2024 and Forecast 2025 to 2035, By Country
  • 13. Latin America Market Analysis 2020 to 2024 and Forecast 2025 to 2035, By Country
  • 14. Europe Market Analysis 2020 to 2024 and Forecast 2025 to 2035, By Country
  • 15. Asia Pacific Market Analysis 2020 to 2024 and Forecast 2025 to 2035, By Country
  • 16. MEA Market Analysis 2020 to 2024 and Forecast 2025 to 2035, By Country
  • 17. Key Countries Market Analysis
  • 18. Market Structure Analysis
  • 19. Competition Analysis
    • 19.1. Olam International
    • 19.2. Jain Farm Fresh Foods Ltd
    • 19.3. Daksh Foods Pvt. Ltd.
    • 19.4. Jiyan Food Ingredients
    • 19.5. Natural Dehydrated Vegetables Pvt. Ltd.
    • 19.6. Real Dehydrates Pvt. Ltd.
    • 19.7. Earth Expo Company
    • 19.8. Kisan Foods
    • 19.9. Harmony House Foods, Inc.
    • 19.10. Silva International Inc.
    • 19.11. Green Rootz
    • 19.12. BC Foods Inc.
    • 19.13. Suszarnia Warzyw Jaworski Sp. J.
    • 19.14. Pardes Dehydration Company
    • 19.15. Murtuza Foods Pvt. Ltd.
    • 19.16. Darshan Foods Pvt. Ltd.
    • 19.17. Garon Dehydrates Private Limited
    • 19.18. Rocky Mountain Spice Company
    • 19.19. R. J. Van Drunen & Sons, Inc.
    • 19.20. German Foods
  • 20. Assumptions & Acronyms Used
  • 21. Research Methodology

List of Tables

Table 1: Global Market Value (US$ Million) Forecast by Region, 2018 to 2033

Table 2: Global Market Volume (MT) Forecast by Region, 2018 to 2033

Table 3: Global Market Value (US$ Million) Forecast by Nature, 2018 to 2033

Table 4: Global Market Volume (MT) Forecast by Nature, 2018 to 2033

Table 5: Global Market Value (US$ Million) Forecast by Variety, 2018 to 2033

Table 6: Global Market Volume (MT) Forecast by Variety, 2018 to 2033

Table 7: Global Market Value (US$ Million) Forecast by Form, 2018 to 2033

Table 8: Global Market Volume (MT) Forecast by Form, 2018 to 2033

Table 9: Global Market Value (US$ Million) Forecast by End Use, 2018 to 2033

Table 10: Global Market Volume (MT) Forecast by End Use, 2018 to 2033

Table 11: Global Market Value (US$ Million) Forecast by Technology, 2018 to 2033

Table 12: Global Market Volume (MT) Forecast by Technology, 2018 to 2033

Table 13: Global Market Value (US$ Million) Forecast by Distribution Channel, 2018 to 2033

Table 14: Global Market Volume (MT) Forecast by Distribution Channel, 2018 to 2033

Table 15: North America Market Value (US$ Million) Forecast by Country, 2018 to 2033

Table 16: North America Market Volume (MT) Forecast by Country, 2018 to 2033

Table 17: North America Market Value (US$ Million) Forecast by Nature, 2018 to 2033

Table 18: North America Market Volume (MT) Forecast by Nature, 2018 to 2033

Table 19: North America Market Value (US$ Million) Forecast by Variety, 2018 to 2033

Table 20: North America Market Volume (MT) Forecast by Variety, 2018 to 2033

Table 21: North America Market Value (US$ Million) Forecast by Form, 2018 to 2033

Table 22: North America Market Volume (MT) Forecast by Form, 2018 to 2033

Table 23: North America Market Value (US$ Million) Forecast by End Use, 2018 to 2033

Table 24: North America Market Volume (MT) Forecast by End Use, 2018 to 2033

Table 25: North America Market Value (US$ Million) Forecast by Technology, 2018 to 2033

Table 26: North America Market Volume (MT) Forecast by Technology, 2018 to 2033

Table 27: North America Market Value (US$ Million) Forecast by Distribution Channel, 2018 to 2033

Table 28: North America Market Volume (MT) Forecast by Distribution Channel, 2018 to 2033

Table 29: Latin America Market Value (US$ Million) Forecast by Country, 2018 to 2033

Table 30: Latin America Market Volume (MT) Forecast by Country, 2018 to 2033

Table 31: Latin America Market Value (US$ Million) Forecast by Nature, 2018 to 2033

Table 32: Latin America Market Volume (MT) Forecast by Nature, 2018 to 2033

Table 33: Latin America Market Value (US$ Million) Forecast by Variety, 2018 to 2033

Table 34: Latin America Market Volume (MT) Forecast by Variety, 2018 to 2033

Table 35: Latin America Market Value (US$ Million) Forecast by Form, 2018 to 2033

Table 36: Latin America Market Volume (MT) Forecast by Form, 2018 to 2033

Table 37: Latin America Market Value (US$ Million) Forecast by End Use, 2018 to 2033

Table 38: Latin America Market Volume (MT) Forecast by End Use, 2018 to 2033

Table 39: Latin America Market Value (US$ Million) Forecast by Technology, 2018 to 2033

Table 40: Latin America Market Volume (MT) Forecast by Technology, 2018 to 2033

Table 41: Latin America Market Value (US$ Million) Forecast by Distribution Channel, 2018 to 2033

Table 42: Latin America Market Volume (MT) Forecast by Distribution Channel, 2018 to 2033

Table 43: Europe Market Value (US$ Million) Forecast by Country, 2018 to 2033

Table 44: Europe Market Volume (MT) Forecast by Country, 2018 to 2033

Table 45: Europe Market Value (US$ Million) Forecast by Nature, 2018 to 2033

Table 46: Europe Market Volume (MT) Forecast by Nature, 2018 to 2033

Table 47: Europe Market Value (US$ Million) Forecast by Variety, 2018 to 2033

Table 48: Europe Market Volume (MT) Forecast by Variety, 2018 to 2033

Table 49: Europe Market Value (US$ Million) Forecast by Form, 2018 to 2033

Table 50: Europe Market Volume (MT) Forecast by Form, 2018 to 2033

Table 51: Europe Market Value (US$ Million) Forecast by End Use, 2018 to 2033

Table 52: Europe Market Volume (MT) Forecast by End Use, 2018 to 2033

Table 53: Europe Market Value (US$ Million) Forecast by Technology, 2018 to 2033

Table 54: Europe Market Volume (MT) Forecast by Technology, 2018 to 2033

Table 55: Europe Market Value (US$ Million) Forecast by Distribution Channel, 2018 to 2033

Table 56: Europe Market Volume (MT) Forecast by Distribution Channel, 2018 to 2033

Table 57: Asia Pacific Market Value (US$ Million) Forecast by Country, 2018 to 2033

Table 58: Asia Pacific Market Volume (MT) Forecast by Country, 2018 to 2033

Table 59: Asia Pacific Market Value (US$ Million) Forecast by Nature, 2018 to 2033

Table 60: Asia Pacific Market Volume (MT) Forecast by Nature, 2018 to 2033

Table 61: Asia Pacific Market Value (US$ Million) Forecast by Variety, 2018 to 2033

Table 62: Asia Pacific Market Volume (MT) Forecast by Variety, 2018 to 2033

Table 63: Asia Pacific Market Value (US$ Million) Forecast by Form, 2018 to 2033

Table 64: Asia Pacific Market Volume (MT) Forecast by Form, 2018 to 2033

Table 65: Asia Pacific Market Value (US$ Million) Forecast by End Use, 2018 to 2033

Table 66: Asia Pacific Market Volume (MT) Forecast by End Use, 2018 to 2033

Table 67: Asia Pacific Market Value (US$ Million) Forecast by Technology, 2018 to 2033

Table 68: Asia Pacific Market Volume (MT) Forecast by Technology, 2018 to 2033

Table 69: Asia Pacific Market Value (US$ Million) Forecast by Distribution Channel, 2018 to 2033

Table 70: Asia Pacific Market Volume (MT) Forecast by Distribution Channel, 2018 to 2033

Table 71: MEA Market Value (US$ Million) Forecast by Country, 2018 to 2033

Table 72: MEA Market Volume (MT) Forecast by Country, 2018 to 2033

Table 73: MEA Market Value (US$ Million) Forecast by Nature, 2018 to 2033

Table 74: MEA Market Volume (MT) Forecast by Nature, 2018 to 2033

Table 75: MEA Market Value (US$ Million) Forecast by Variety, 2018 to 2033

Table 76: MEA Market Volume (MT) Forecast by Variety, 2018 to 2033

Table 77: MEA Market Value (US$ Million) Forecast by Form, 2018 to 2033

Table 78: MEA Market Volume (MT) Forecast by Form, 2018 to 2033

Table 79: MEA Market Value (US$ Million) Forecast by End Use, 2018 to 2033

Table 80: MEA Market Volume (MT) Forecast by End Use, 2018 to 2033

Table 81: MEA Market Value (US$ Million) Forecast by Technology, 2018 to 2033

Table 82: MEA Market Volume (MT) Forecast by Technology, 2018 to 2033

Table 83: MEA Market Value (US$ Million) Forecast by Distribution Channel, 2018 to 2033

Table 84: MEA Market Volume (MT) Forecast by Distribution Channel, 2018 to 2033

List of Figures

Figure 1: Global Market Value (US$ Million) by Nature, 2023 to 2033

Figure 2: Global Market Value (US$ Million) by Variety, 2023 to 2033

Figure 3: Global Market Value (US$ Million) by Form, 2023 to 2033

Figure 4: Global Market Value (US$ Million) by End Use, 2023 to 2033

Figure 5: Global Market Value (US$ Million) by Technology, 2023 to 2033

Figure 6: Global Market Value (US$ Million) by Distribution Channel, 2023 to 2033

Figure 7: Global Market Value (US$ Million) by Region, 2023 to 2033

Figure 8: Global Market Value (US$ Million) Analysis by Region, 2018 to 2033

Figure 9: Global Market Volume (MT) Analysis by Region, 2018 to 2033

Figure 10: Global Market Value Share (%) and BPS Analysis by Region, 2023 to 2033

Figure 11: Global Market Y-o-Y Growth (%) Projections by Region, 2023 to 2033

Figure 12: Global Market Value (US$ Million) Analysis by Nature, 2018 to 2033

Figure 13: Global Market Volume (MT) Analysis by Nature, 2018 to 2033

Figure 14: Global Market Value Share (%) and BPS Analysis by Nature, 2023 to 2033

Figure 15: Global Market Y-o-Y Growth (%) Projections by Nature, 2023 to 2033

Figure 16: Global Market Value (US$ Million) Analysis by Variety, 2018 to 2033

Figure 17: Global Market Volume (MT) Analysis by Variety, 2018 to 2033

Figure 18: Global Market Value Share (%) and BPS Analysis by Variety, 2023 to 2033

Figure 19: Global Market Y-o-Y Growth (%) Projections by Variety, 2023 to 2033

Figure 20: Global Market Value (US$ Million) Analysis by Form, 2018 to 2033

Figure 21: Global Market Volume (MT) Analysis by Form, 2018 to 2033

Figure 22: Global Market Value Share (%) and BPS Analysis by Form, 2023 to 2033

Figure 23: Global Market Y-o-Y Growth (%) Projections by Form, 2023 to 2033

Figure 24: Global Market Value (US$ Million) Analysis by End Use, 2018 to 2033

Figure 25: Global Market Volume (MT) Analysis by End Use, 2018 to 2033

Figure 26: Global Market Value Share (%) and BPS Analysis by End Use, 2023 to 2033

Figure 27: Global Market Y-o-Y Growth (%) Projections by End Use, 2023 to 2033

Figure 28: Global Market Value (US$ Million) Analysis by Technology, 2018 to 2033

Figure 29: Global Market Volume (MT) Analysis by Technology, 2018 to 2033

Figure 30: Global Market Value Share (%) and BPS Analysis by Technology, 2023 to 2033

Figure 31: Global Market Y-o-Y Growth (%) Projections by Technology, 2023 to 2033

Figure 32: Global Market Value (US$ Million) Analysis by Distribution Channel, 2018 to 2033

Figure 33: Global Market Volume (MT) Analysis by Distribution Channel, 2018 to 2033

Figure 34: Global Market Value Share (%) and BPS Analysis by Distribution Channel, 2023 to 2033

Figure 35: Global Market Y-o-Y Growth (%) Projections by Distribution Channel, 2023 to 2033

Figure 36: Global Market Attractiveness by Nature, 2023 to 2033

Figure 37: Global Market Attractiveness by Variety, 2023 to 2033

Figure 38: Global Market Attractiveness by Form, 2023 to 2033

Figure 39: Global Market Attractiveness by End Use, 2023 to 2033

Figure 40: Global Market Attractiveness by Technology, 2023 to 2033

Figure 41: Global Market Attractiveness by Distribution Channel, 2023 to 2033

Figure 42: Global Market Attractiveness by Region, 2023 to 2033

Figure 43: North America Market Value (US$ Million) by Nature, 2023 to 2033

Figure 44: North America Market Value (US$ Million) by Variety, 2023 to 2033

Figure 45: North America Market Value (US$ Million) by Form, 2023 to 2033

Figure 46: North America Market Value (US$ Million) by End Use, 2023 to 2033

Figure 47: North America Market Value (US$ Million) by Technology, 2023 to 2033

Figure 48: North America Market Value (US$ Million) by Distribution Channel, 2023 to 2033

Figure 49: North America Market Value (US$ Million) by Country, 2023 to 2033

Figure 50: North America Market Value (US$ Million) Analysis by Country, 2018 to 2033

Figure 51: North America Market Volume (MT) Analysis by Country, 2018 to 2033

Figure 52: North America Market Value Share (%) and BPS Analysis by Country, 2023 to 2033

Figure 53: North America Market Y-o-Y Growth (%) Projections by Country, 2023 to 2033

Figure 54: North America Market Value (US$ Million) Analysis by Nature, 2018 to 2033

Figure 55: North America Market Volume (MT) Analysis by Nature, 2018 to 2033

Figure 56: North America Market Value Share (%) and BPS Analysis by Nature, 2023 to 2033

Figure 57: North America Market Y-o-Y Growth (%) Projections by Nature, 2023 to 2033

Figure 58: North America Market Value (US$ Million) Analysis by Variety, 2018 to 2033

Figure 59: North America Market Volume (MT) Analysis by Variety, 2018 to 2033

Figure 60: North America Market Value Share (%) and BPS Analysis by Variety, 2023 to 2033

Figure 61: North America Market Y-o-Y Growth (%) Projections by Variety, 2023 to 2033

Figure 62: North America Market Value (US$ Million) Analysis by Form, 2018 to 2033

Figure 63: North America Market Volume (MT) Analysis by Form, 2018 to 2033

Figure 64: North America Market Value Share (%) and BPS Analysis by Form, 2023 to 2033

Figure 65: North America Market Y-o-Y Growth (%) Projections by Form, 2023 to 2033

Figure 66: North America Market Value (US$ Million) Analysis by End Use, 2018 to 2033

Figure 67: North America Market Volume (MT) Analysis by End Use, 2018 to 2033

Figure 68: North America Market Value Share (%) and BPS Analysis by End Use, 2023 to 2033

Figure 69: North America Market Y-o-Y Growth (%) Projections by End Use, 2023 to 2033

Figure 70: North America Market Value (US$ Million) Analysis by Technology, 2018 to 2033

Figure 71: North America Market Volume (MT) Analysis by Technology, 2018 to 2033

Figure 72: North America Market Value Share (%) and BPS Analysis by Technology, 2023 to 2033

Figure 73: North America Market Y-o-Y Growth (%) Projections by Technology, 2023 to 2033

Figure 74: North America Market Value (US$ Million) Analysis by Distribution Channel, 2018 to 2033

Figure 75: North America Market Volume (MT) Analysis by Distribution Channel, 2018 to 2033

Figure 76: North America Market Value Share (%) and BPS Analysis by Distribution Channel, 2023 to 2033

Figure 77: North America Market Y-o-Y Growth (%) Projections by Distribution Channel, 2023 to 2033

Figure 78: North America Market Attractiveness by Nature, 2023 to 2033

Figure 79: North America Market Attractiveness by Variety, 2023 to 2033

Figure 80: North America Market Attractiveness by Form, 2023 to 2033

Figure 81: North America Market Attractiveness by End Use, 2023 to 2033

Figure 82: North America Market Attractiveness by Technology, 2023 to 2033

Figure 83: North America Market Attractiveness by Distribution Channel, 2023 to 2033

Figure 84: North America Market Attractiveness by Country, 2023 to 2033

Figure 85: Latin America Market Value (US$ Million) by Nature, 2023 to 2033

Figure 86: Latin America Market Value (US$ Million) by Variety, 2023 to 2033

Figure 87: Latin America Market Value (US$ Million) by Form, 2023 to 2033

Figure 88: Latin America Market Value (US$ Million) by End Use, 2023 to 2033

Figure 89: Latin America Market Value (US$ Million) by Technology, 2023 to 2033

Figure 90: Latin America Market Value (US$ Million) by Distribution Channel, 2023 to 2033

Figure 91: Latin America Market Value (US$ Million) by Country, 2023 to 2033

Figure 92: Latin America Market Value (US$ Million) Analysis by Country, 2018 to 2033

Figure 93: Latin America Market Volume (MT) Analysis by Country, 2018 to 2033

Figure 94: Latin America Market Value Share (%) and BPS Analysis by Country, 2023 to 2033

Figure 95: Latin America Market Y-o-Y Growth (%) Projections by Country, 2023 to 2033

Figure 96: Latin America Market Value (US$ Million) Analysis by Nature, 2018 to 2033

Figure 97: Latin America Market Volume (MT) Analysis by Nature, 2018 to 2033

Figure 98: Latin America Market Value Share (%) and BPS Analysis by Nature, 2023 to 2033

Figure 99: Latin America Market Y-o-Y Growth (%) Projections by Nature, 2023 to 2033

Figure 100: Latin America Market Value (US$ Million) Analysis by Variety, 2018 to 2033

Figure 101: Latin America Market Volume (MT) Analysis by Variety, 2018 to 2033

Figure 102: Latin America Market Value Share (%) and BPS Analysis by Variety, 2023 to 2033

Figure 103: Latin America Market Y-o-Y Growth (%) Projections by Variety, 2023 to 2033

Figure 104: Latin America Market Value (US$ Million) Analysis by Form, 2018 to 2033

Figure 105: Latin America Market Volume (MT) Analysis by Form, 2018 to 2033

Figure 106: Latin America Market Value Share (%) and BPS Analysis by Form, 2023 to 2033

Figure 107: Latin America Market Y-o-Y Growth (%) Projections by Form, 2023 to 2033

Figure 108: Latin America Market Value (US$ Million) Analysis by End Use, 2018 to 2033

Figure 109: Latin America Market Volume (MT) Analysis by End Use, 2018 to 2033

Figure 110: Latin America Market Value Share (%) and BPS Analysis by End Use, 2023 to 2033

Figure 111: Latin America Market Y-o-Y Growth (%) Projections by End Use, 2023 to 2033

Figure 112: Latin America Market Value (US$ Million) Analysis by Technology, 2018 to 2033

Figure 113: Latin America Market Volume (MT) Analysis by Technology, 2018 to 2033

Figure 114: Latin America Market Value Share (%) and BPS Analysis by Technology, 2023 to 2033

Figure 115: Latin America Market Y-o-Y Growth (%) Projections by Technology, 2023 to 2033

Figure 116: Latin America Market Value (US$ Million) Analysis by Distribution Channel, 2018 to 2033

Figure 117: Latin America Market Volume (MT) Analysis by Distribution Channel, 2018 to 2033

Figure 118: Latin America Market Value Share (%) and BPS Analysis by Distribution Channel, 2023 to 2033

Figure 119: Latin America Market Y-o-Y Growth (%) Projections by Distribution Channel, 2023 to 2033

Figure 120: Latin America Market Attractiveness by Nature, 2023 to 2033

Figure 121: Latin America Market Attractiveness by Variety, 2023 to 2033

Figure 122: Latin America Market Attractiveness by Form, 2023 to 2033

Figure 123: Latin America Market Attractiveness by End Use, 2023 to 2033

Figure 124: Latin America Market Attractiveness by Technology, 2023 to 2033

Figure 125: Latin America Market Attractiveness by Distribution Channel, 2023 to 2033

Figure 126: Latin America Market Attractiveness by Country, 2023 to 2033

Figure 127: Europe Market Value (US$ Million) by Nature, 2023 to 2033

Figure 128: Europe Market Value (US$ Million) by Variety, 2023 to 2033

Figure 129: Europe Market Value (US$ Million) by Form, 2023 to 2033

Figure 130: Europe Market Value (US$ Million) by End Use, 2023 to 2033

Figure 131: Europe Market Value (US$ Million) by Technology, 2023 to 2033

Figure 132: Europe Market Value (US$ Million) by Distribution Channel, 2023 to 2033

Figure 133: Europe Market Value (US$ Million) by Country, 2023 to 2033

Figure 134: Europe Market Value (US$ Million) Analysis by Country, 2018 to 2033

Figure 135: Europe Market Volume (MT) Analysis by Country, 2018 to 2033

Figure 136: Europe Market Value Share (%) and BPS Analysis by Country, 2023 to 2033

Figure 137: Europe Market Y-o-Y Growth (%) Projections by Country, 2023 to 2033

Figure 138: Europe Market Value (US$ Million) Analysis by Nature, 2018 to 2033

Figure 139: Europe Market Volume (MT) Analysis by Nature, 2018 to 2033

Figure 140: Europe Market Value Share (%) and BPS Analysis by Nature, 2023 to 2033

Figure 141: Europe Market Y-o-Y Growth (%) Projections by Nature, 2023 to 2033

Figure 142: Europe Market Value (US$ Million) Analysis by Variety, 2018 to 2033

Figure 143: Europe Market Volume (MT) Analysis by Variety, 2018 to 2033

Figure 144: Europe Market Value Share (%) and BPS Analysis by Variety, 2023 to 2033

Figure 145: Europe Market Y-o-Y Growth (%) Projections by Variety, 2023 to 2033

Figure 146: Europe Market Value (US$ Million) Analysis by Form, 2018 to 2033

Figure 147: Europe Market Volume (MT) Analysis by Form, 2018 to 2033

Figure 148: Europe Market Value Share (%) and BPS Analysis by Form, 2023 to 2033

Figure 149: Europe Market Y-o-Y Growth (%) Projections by Form, 2023 to 2033

Figure 150: Europe Market Value (US$ Million) Analysis by End Use, 2018 to 2033

Figure 151: Europe Market Volume (MT) Analysis by End Use, 2018 to 2033

Figure 152: Europe Market Value Share (%) and BPS Analysis by End Use, 2023 to 2033

Figure 153: Europe Market Y-o-Y Growth (%) Projections by End Use, 2023 to 2033

Figure 154: Europe Market Value (US$ Million) Analysis by Technology, 2018 to 2033

Figure 155: Europe Market Volume (MT) Analysis by Technology, 2018 to 2033

Figure 156: Europe Market Value Share (%) and BPS Analysis by Technology, 2023 to 2033

Figure 157: Europe Market Y-o-Y Growth (%) Projections by Technology, 2023 to 2033

Figure 158: Europe Market Value (US$ Million) Analysis by Distribution Channel, 2018 to 2033

Figure 159: Europe Market Volume (MT) Analysis by Distribution Channel, 2018 to 2033

Figure 160: Europe Market Value Share (%) and BPS Analysis by Distribution Channel, 2023 to 2033

Figure 161: Europe Market Y-o-Y Growth (%) Projections by Distribution Channel, 2023 to 2033

Figure 162: Europe Market Attractiveness by Nature, 2023 to 2033

Figure 163: Europe Market Attractiveness by Variety, 2023 to 2033

Figure 164: Europe Market Attractiveness by Form, 2023 to 2033

Figure 165: Europe Market Attractiveness by End Use, 2023 to 2033

Figure 166: Europe Market Attractiveness by Technology, 2023 to 2033

Figure 167: Europe Market Attractiveness by Distribution Channel, 2023 to 2033

Figure 168: Europe Market Attractiveness by Country, 2023 to 2033

Figure 169: Asia Pacific Market Value (US$ Million) by Nature, 2023 to 2033

Figure 170: Asia Pacific Market Value (US$ Million) by Variety, 2023 to 2033

Figure 171: Asia Pacific Market Value (US$ Million) by Form, 2023 to 2033

Figure 172: Asia Pacific Market Value (US$ Million) by End Use, 2023 to 2033

Figure 173: Asia Pacific Market Value (US$ Million) by Technology, 2023 to 2033

Figure 174: Asia Pacific Market Value (US$ Million) by Distribution Channel, 2023 to 2033

Figure 175: Asia Pacific Market Value (US$ Million) by Country, 2023 to 2033

Figure 176: Asia Pacific Market Value (US$ Million) Analysis by Country, 2018 to 2033

Figure 177: Asia Pacific Market Volume (MT) Analysis by Country, 2018 to 2033

Figure 178: Asia Pacific Market Value Share (%) and BPS Analysis by Country, 2023 to 2033

Figure 179: Asia Pacific Market Y-o-Y Growth (%) Projections by Country, 2023 to 2033

Figure 180: Asia Pacific Market Value (US$ Million) Analysis by Nature, 2018 to 2033

Figure 181: Asia Pacific Market Volume (MT) Analysis by Nature, 2018 to 2033

Figure 182: Asia Pacific Market Value Share (%) and BPS Analysis by Nature, 2023 to 2033

Figure 183: Asia Pacific Market Y-o-Y Growth (%) Projections by Nature, 2023 to 2033

Figure 184: Asia Pacific Market Value (US$ Million) Analysis by Variety, 2018 to 2033

Figure 185: Asia Pacific Market Volume (MT) Analysis by Variety, 2018 to 2033

Figure 186: Asia Pacific Market Value Share (%) and BPS Analysis by Variety, 2023 to 2033

Figure 187: Asia Pacific Market Y-o-Y Growth (%) Projections by Variety, 2023 to 2033

Figure 188: Asia Pacific Market Value (US$ Million) Analysis by Form, 2018 to 2033

Figure 189: Asia Pacific Market Volume (MT) Analysis by Form, 2018 to 2033

Figure 190: Asia Pacific Market Value Share (%) and BPS Analysis by Form, 2023 to 2033

Figure 191: Asia Pacific Market Y-o-Y Growth (%) Projections by Form, 2023 to 2033

Figure 192: Asia Pacific Market Value (US$ Million) Analysis by End Use, 2018 to 2033

Figure 193: Asia Pacific Market Volume (MT) Analysis by End Use, 2018 to 2033

Figure 194: Asia Pacific Market Value Share (%) and BPS Analysis by End Use, 2023 to 2033

Figure 195: Asia Pacific Market Y-o-Y Growth (%) Projections by End Use, 2023 to 2033

Figure 196: Asia Pacific Market Value (US$ Million) Analysis by Technology, 2018 to 2033

Figure 197: Asia Pacific Market Volume (MT) Analysis by Technology, 2018 to 2033

Figure 198: Asia Pacific Market Value Share (%) and BPS Analysis by Technology, 2023 to 2033

Figure 199: Asia Pacific Market Y-o-Y Growth (%) Projections by Technology, 2023 to 2033

Figure 200: Asia Pacific Market Value (US$ Million) Analysis by Distribution Channel, 2018 to 2033

Figure 201: Asia Pacific Market Volume (MT) Analysis by Distribution Channel, 2018 to 2033

Figure 202: Asia Pacific Market Value Share (%) and BPS Analysis by Distribution Channel, 2023 to 2033

Figure 203: Asia Pacific Market Y-o-Y Growth (%) Projections by Distribution Channel, 2023 to 2033

Figure 204: Asia Pacific Market Attractiveness by Nature, 2023 to 2033

Figure 205: Asia Pacific Market Attractiveness by Variety, 2023 to 2033

Figure 206: Asia Pacific Market Attractiveness by Form, 2023 to 2033

Figure 207: Asia Pacific Market Attractiveness by End Use, 2023 to 2033

Figure 208: Asia Pacific Market Attractiveness by Technology, 2023 to 2033

Figure 209: Asia Pacific Market Attractiveness by Distribution Channel, 2023 to 2033

Figure 210: Asia Pacific Market Attractiveness by Country, 2023 to 2033

Figure 211: MEA Market Value (US$ Million) by Nature, 2023 to 2033

Figure 212: MEA Market Value (US$ Million) by Variety, 2023 to 2033

Figure 213: MEA Market Value (US$ Million) by Form, 2023 to 2033

Figure 214: MEA Market Value (US$ Million) by End Use, 2023 to 2033

Figure 215: MEA Market Value (US$ Million) by Technology, 2023 to 2033

Figure 216: MEA Market Value (US$ Million) by Distribution Channel, 2023 to 2033

Figure 217: MEA Market Value (US$ Million) by Country, 2023 to 2033

Figure 218: MEA Market Value (US$ Million) Analysis by Country, 2018 to 2033

Figure 219: MEA Market Volume (MT) Analysis by Country, 2018 to 2033

Figure 220: MEA Market Value Share (%) and BPS Analysis by Country, 2023 to 2033

Figure 221: MEA Market Y-o-Y Growth (%) Projections by Country, 2023 to 2033

Figure 222: MEA Market Value (US$ Million) Analysis by Nature, 2018 to 2033

Figure 223: MEA Market Volume (MT) Analysis by Nature, 2018 to 2033

Figure 224: MEA Market Value Share (%) and BPS Analysis by Nature, 2023 to 2033

Figure 225: MEA Market Y-o-Y Growth (%) Projections by Nature, 2023 to 2033

Figure 226: MEA Market Value (US$ Million) Analysis by Variety, 2018 to 2033

Figure 227: MEA Market Volume (MT) Analysis by Variety, 2018 to 2033

Figure 228: MEA Market Value Share (%) and BPS Analysis by Variety, 2023 to 2033

Figure 229: MEA Market Y-o-Y Growth (%) Projections by Variety, 2023 to 2033

Figure 230: MEA Market Value (US$ Million) Analysis by Form, 2018 to 2033

Figure 231: MEA Market Volume (MT) Analysis by Form, 2018 to 2033

Figure 232: MEA Market Value Share (%) and BPS Analysis by Form, 2023 to 2033

Figure 233: MEA Market Y-o-Y Growth (%) Projections by Form, 2023 to 2033

Figure 234: MEA Market Value (US$ Million) Analysis by End Use, 2018 to 2033

Figure 235: MEA Market Volume (MT) Analysis by End Use, 2018 to 2033

Figure 236: MEA Market Value Share (%) and BPS Analysis by End Use, 2023 to 2033

Figure 237: MEA Market Y-o-Y Growth (%) Projections by End Use, 2023 to 2033

Figure 238: MEA Market Value (US$ Million) Analysis by Technology, 2018 to 2033

Figure 239: MEA Market Volume (MT) Analysis by Technology, 2018 to 2033

Figure 240: MEA Market Value Share (%) and BPS Analysis by Technology, 2023 to 2033

Figure 241: MEA Market Y-o-Y Growth (%) Projections by Technology, 2023 to 2033

Figure 242: MEA Market Value (US$ Million) Analysis by Distribution Channel, 2018 to 2033

Figure 243: MEA Market Volume (MT) Analysis by Distribution Channel, 2018 to 2033

Figure 244: MEA Market Value Share (%) and BPS Analysis by Distribution Channel, 2023 to 2033

Figure 245: MEA Market Y-o-Y Growth (%) Projections by Distribution Channel, 2023 to 2033

Figure 246: MEA Market Attractiveness by Nature, 2023 to 2033

Figure 247: MEA Market Attractiveness by Variety, 2023 to 2033

Figure 248: MEA Market Attractiveness by Form, 2023 to 2033

Figure 249: MEA Market Attractiveness by End Use, 2023 to 2033

Figure 250: MEA Market Attractiveness by Technology, 2023 to 2033

Figure 251: MEA Market Attractiveness by Distribution Channel, 2023 to 2033

Figure 252: MEA Market Attractiveness by Country, 2023 to 2033

Frequently Asked Questions

What is the projected size of the dehydrated onions market by 2035?

The dehydrated onions market is expected to grow from USD 2.27 billion in 2025 to USD 10.93 billion by 2035, at a CAGR of 19%.

Which segment is expected to lead the dehydrated onions market by end use?

Food processing is projected to hold the largest share, accounting for 67.7% of the dehydrated onions market in 2025.

How fast is the organic dehydrated onions segment expected to grow?

The organic segment is forecasted to grow at a CAGR of 8.3% from 2025 to 2035, driven by rising demand for clean-label foods.

Which country is expected to grow the fastest in the dehydrated onions market?

China is expected to be the fastest-growing country with a CAGR of 14.5% during the forecast period.

What is the leading dehydration technology in the market?

Spray drying is the fastest-growing technology, anticipated to grow at a CAGR of 7.9% from 2025 to 2035.

Explore Similar Insights

Future Market Insights

Dehydrated Onions Market