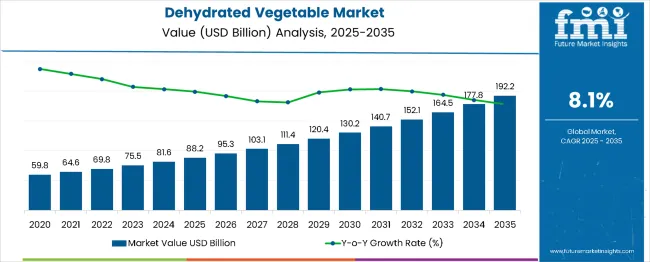
The global dehydrated vegetable market is valued at USD 88.2 billion in 2025 and is slated to reach USD 192.2 billion by 2035, recording an absolute increase of USD 103.9 billion over the forecast period. This translates into a total growth of 117.8%, with the market forecast to expand at a compound annual growth rate (CAGR) of 8.1% between 2025 and 2035.
Dehydrated Vegetable Market Key Takeaways
| Metric | Value |
|---|---|
| Estimated Value in (2025E) | USD 88.2 billion |
| Forecast Value in (2035F) | USD 192.2 billion |
| Forecast CAGR (2025 to 2035) | 8.1% |
The overall market size is expected to grow by nearly 2.18X during the same period, supported by increasing demand for convenience foods, growing adoption of processed ingredients in food manufacturing, and rising consumer preference for shelf-stable products across diverse culinary applications.
Between 2025 and 2030, the dehydrated vegetable market is projected to expand from USD 88.2 billion to USD 131.2 billion, resulting in a value increase of USD 43.0 billion, which represents 41.4% of the total forecast growth for the decade.
This phase of development will be shaped by increasing food processing industry expansion, rising adoption of advanced dehydration technologies, and growing demand for natural preservative-free ingredients in ready-to-eat meals and packaged foods. Food manufacturers are expanding their dehydrated vegetable sourcing capabilities to address the growing demand for convenient cooking solutions and extended shelf-life products.
From 2030 to 2035, the market is forecast to grow from USD 131.2 billion to USD 192.2 billion, adding another USD 60.9 billion, which constitutes 58.6% of the overall ten-year expansion. This period is expected to be characterized by the expansion of freeze-drying and spray-drying technologies, the integration of smart packaging solutions for moisture control, and the development of premium organic and specialty dehydrated vegetable products.
The growing adoption of plant-based diets and clean-label food formulations will drive demand for dehydrated vegetables with enhanced nutritional profiles and minimal processing additives.
Between 2020 and 2025, the dehydrated vegetable market experienced robust growth, driven by increasing consumer demand for convenient cooking solutions and growing recognition of dehydrated vegetables as nutritious alternatives to fresh produce with extended shelf life. The market developed as food manufacturers recognized the potential for dehydrated vegetables to enhance product formulations while reducing spoilage and transportation costs.
Technological advancement in dehydration processes and packaging methods began emphasizing the critical importance of maintaining nutritional value and flavor integrity in processed vegetable products.
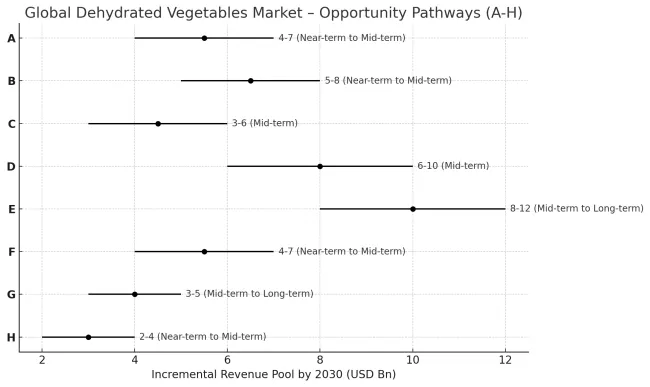
The dehydrated vegetables market is poised for rapid growth and transformation. As consumers across both developed and emerging markets seek foods that are shelf-stable, convenient, nutritious, and clean-label, dehydrated vegetables are gaining prominence not just as substitutes for fresh produce but as strategic ingredients in processed foods, snacks, soups, seasoning blends, and more.
Rising incomes and urbanization in Asia-Pacific, Latin America, Africa amplify demand, while manufacturers are picking up on innovations in drying technologies and supply-chain improvements.
Pathways like organic/clean label, premium dehydration, and sustainability-led differentiation promise strong margin uplift, especially in mature markets. Geographic expansion and localisation will capture volume, particularly where fresh supply is intermittent or cold chain is weak. Regulatory pressures around food safety, labelling, food waste reduction, and food security give structural support.
Pathway G - Sustainability & ESG Premiums. Reducing water, energy use in drying, valorizing waste, packaging, renewable energy, supporting regenerative farming-all create differentiation and possibly policy / incentive support. Pool: USD 3-5 billion.
Market expansion is being supported by the increasing global demand for convenience foods and the corresponding need for shelf-stable ingredients that can maintain nutritional value and flavor while extending product shelf life across various food applications.
Modern food manufacturers are increasingly focused on implementing ingredient solutions that can reduce preparation time, minimize food waste, and provide consistent quality in processed food products. Dehydrated vegetables' proven ability to deliver nutritional benefits, extended storage capabilities, and versatile culinary applications make them essential ingredients for contemporary food processing and meal preparation solutions.
The growing emphasis on food security and supply chain resilience is driving demand for dehydrated vegetables that can support emergency food supplies, reduce transportation costs, and enable year-round availability of seasonal produce. Food processors' preference for ingredients that combine nutritional value with operational efficiency and cost-effectiveness is creating opportunities for innovative dehydrated vegetable implementations.
The rising influence of health-conscious consumer trends and clean label demands is also contributing to increased adoption of dehydrated vegetables that can provide natural ingredient solutions without artificial preservatives or additives.
The market is segmented by product type, end use, distribution channel, and region. By product type, the market is divided into onions, potatoes, carrots, broccoli, and others. Based on end use, the market is categorized into food manufacturers, foodservice, and retail. By distribution channel, the market includes hypermarkets/supermarkets, convenience stores, specialty stores, and online retail. Regionally, the market is divided into North America, Europe, East Asia, South Asia & Pacific, Latin America, and the Middle East & Africa.
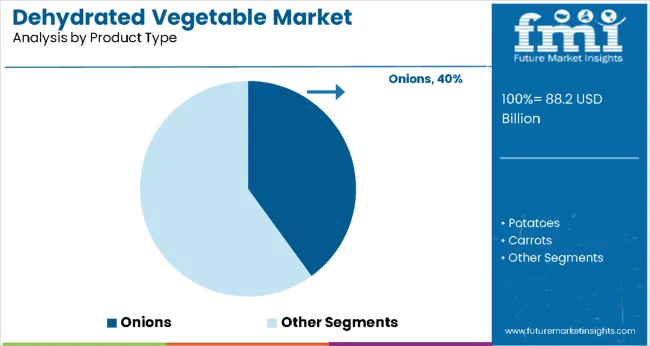
The onions segment is projected to account for 40.0% of the dehydrated vegetable market in 2025, reaffirming its position as the leading product category. Food processors increasingly utilize dehydrated onions for their superior flavor concentration, extended shelf life, and convenience in food preparation applications across soups, sauces, seasonings, and ready-to-eat meals.
Dehydrated onion technology's advanced processing capabilities and consistent quality output directly address the industrial requirements for reliable flavor enhancement and operational efficiency in large-scale food production.
This product segment forms the foundation of modern food processing operations, as it represents the ingredient with the greatest versatility and established market demand across multiple food categories and culinary applications. Processor investments in enhanced dehydration technologies and quality control systems continue to strengthen adoption among food manufacturers.
With food companies prioritizing consistent flavor profiles and extended shelf life, dehydrated onions align with both operational efficiency objectives and consumer taste preferences, making them the central component of comprehensive food ingredient strategies.
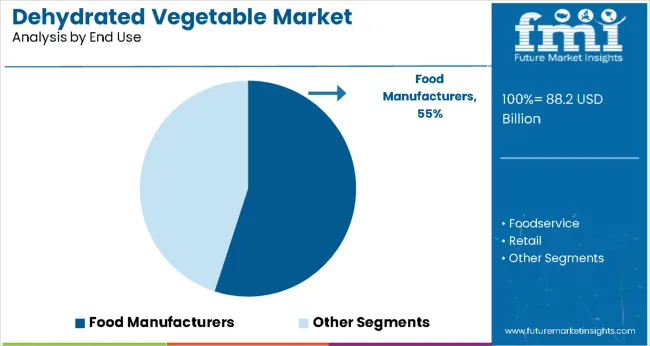
Food manufacturers are projected to represent 55.0% of dehydrated vegetable demand in 2025, underscoring their critical role as the primary industrial consumers of processed vegetable ingredients for packaged food production. Food processing companies prefer dehydrated vegetables for their cost-effectiveness, consistent quality, and ability to enhance product formulations while reducing preparation time and ingredient handling complexity. Positioned as essential ingredients for modern food manufacturing, dehydrated vegetables offer both operational advantages and quality benefits.
The segment is supported by continuous innovation in food product development and the growing availability of specialized dehydration technologies that enable premium ingredient production with enhanced nutritional retention. Additionally, food manufacturers are investing in supply chain optimization to support large-volume ingredient procurement and quality assurance.
As convenience food demand becomes more prevalent and processing efficiency requirements increase, food manufacturers will continue to dominate the end-user market while supporting advanced ingredient utilization and product innovation strategies.
The dehydrated vegetable market is advancing rapidly due to increasing consumer demand for convenience foods and growing adoption of processed ingredients that provide extended shelf life and nutritional retention across diverse food applications.
However, the market faces challenges, including seasonal raw material availability, quality standardization across different suppliers, and the need for advanced dehydration equipment investments. Innovation in freeze-drying technologies and smart packaging solutions continues to influence product development and market expansion patterns.
Expansion of Advanced Dehydration Technologies
The growing adoption of freeze-drying and vacuum dehydration technologies is enabling food processors to produce premium dehydrated vegetables with superior nutritional retention, enhanced flavor profiles, and extended shelf life capabilities.
Advanced dehydration systems provide improved product quality while allowing more efficient processing and consistent output across various vegetable types and applications. Manufacturers are increasingly recognizing the competitive advantages of advanced dehydration capabilities for product differentiation and premium market positioning.
Integration of Smart Packaging and Quality Control Systems
Modern dehydrated vegetable producers are incorporating intelligent packaging technologies and automated quality monitoring systems to enhance product freshness, extend shelf life, and ensure consistent quality delivery to end users.
These technologies improve supply chain efficiency while enabling new applications, including portion-controlled packaging and moisture-sensitive product protection. Advanced packaging integration also allows processors to support premium product positioning and consumer convenience beyond traditional bulk ingredient supply.
| Country | CAGR (2025 to 2035) |
|---|---|
| India | 10.1% |
| China | 9.0% |
| USA | 7.2% |
| Brazil | 6.8% |
| Spain | 6.5% |
| Germany | 6.0% |
| Japan | 5.5% |
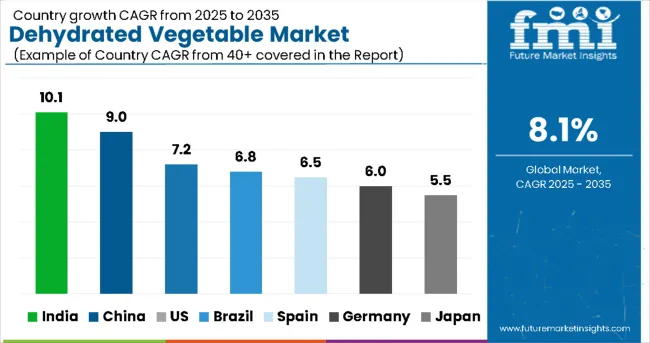
The dehydrated vegetable market is experiencing strong growth globally, with India leading at a 10.1% CAGR through 2035, driven by the expanding food processing industry, growing export capabilities, and significant investment in agricultural processing infrastructure development. China follows at 9.0%, supported by large-scale vegetable production, advanced dehydration facilities, and growing domestic demand for processed foods.
The USA shows growth at 7.2%, emphasizing technological innovation and premium product development. Brazil records 6.8%, focusing on agricultural processing expansion and export market development. Spain demonstrates 6.5% growth, prioritizing Mediterranean vegetable processing and European market supply.
Germany exhibits 6.0% growth, emphasizing advanced processing technologies and quality food ingredient supply. Japan shows 5.5% growth, supported by premium food processing and culinary application innovation.
The report covers an in-depth analysis of 40+ countries; seven top-performing countries are highlighted below.
Revenue from dehydrated vegetables in India is projected to exhibit exceptional growth with a CAGR of 10.1% through 2035, driven by expanding food processing infrastructure and rapidly growing export capabilities supported by government agricultural modernization initiatives.
The country's abundant vegetable production and increasing investment in dehydration technology are creating substantial demand for advanced processing solutions. Major food processing companies and agricultural cooperatives are establishing comprehensive dehydration capabilities to serve both domestic and international markets.
Government support for agricultural value addition and food processing infrastructure development is driving demand for advanced dehydration technologies throughout major vegetable-growing regions and processing centers.
Strong agricultural sector growth and an expanding network of food processing facilities are supporting the rapid adoption of dehydration technologies among processors seeking enhanced value addition and export competitiveness.
Revenue from dehydrated vegetables in China is expanding at a CAGR of 9.0%, supported by the country's large-scale vegetable production capacity, advanced processing facilities, and increasing domestic demand for convenience foods and processed ingredients.
The country's comprehensive agricultural supply chain and growing food processing industry are driving demand for sophisticated dehydration capabilities. International technology providers and domestic processors are establishing extensive production and distribution capabilities to address the growing demand for dehydrated vegetable products.
Rising food processing industry development and expanding urban food consumption patterns are creating opportunities for dehydrated vegetable adoption across food manufacturers, restaurant chains, and retail distributors in major metropolitan areas.
Growing government focus on food security and agricultural modernization is driving adoption of processing technologies among agricultural enterprises seeking enhanced product value and market reach expansion.
Revenue from dehydrated vegetables in the USA is expanding at a CAGR of 7.2%, supported by the country's advanced food processing industry, strong emphasis on technological innovation, and robust demand for convenience foods among health-conscious consumers.
The nation's mature food processing sector and high consumption of ready-to-eat products are driving sophisticated dehydration capabilities throughout the supply chain. Leading manufacturers and technology providers are investing extensively in premium product development and advanced processing methods to serve both domestic and export markets.
Rising consumer preference for clean-label products and minimal processing is creating demand for advanced freeze-drying and spray-drying technologies among food manufacturers seeking enhanced nutritional retention and flavor preservation.
Strong purchasing power and growing awareness about processed food quality are supporting adoption of organic and preservative-free dehydrated vegetables across retail and food service sectors in major metropolitan areas.
Revenue from dehydrated vegetables in Brazil is growing at a CAGR of 6.8%, driven by expanding agricultural processing infrastructure, increasing health-conscious consumption patterns, and growing investment in export market development.
The country's abundant agricultural resources and modernization of processing facilities are supporting demand for advanced dehydration technologies across major production regions. Food processors and agricultural cooperatives are establishing comprehensive capabilities to serve both domestic urban centers and international export markets.
Government initiatives promoting food processing sector development and agricultural value addition are driving adoption of modern drying technologies including vacuum drying, freeze drying, and spray drying methods.
Rising demand for convenient and nutritious food options in urban areas is supporting market expansion, while robust agricultural sector growth provides reliable raw material supply for processing facilities throughout the country.
Revenue from dehydrated vegetables in Spain is expanding at a CAGR of 6.5%, supported by the country's strong Mediterranean agricultural tradition, advanced processing capabilities, and strategic position for European market supply.
Spain's established culinary heritage and diverse agricultural production are driving demand for specialized dehydration technologies focusing on traditional ingredients and premium product development. Manufacturers are investing in comprehensive processing facilities to serve both domestic and international markets with authentic Mediterranean vegetable products.
Traditional air-drying and sun-drying methods combined with modern processing technologies are creating opportunities for premium dehydrated vegetable production emphasizing natural flavor preservation and cultural authenticity.
Growing emphasis on sustainability and local sourcing is driving adoption of traceability systems and transparent supply chain practices among processors seeking enhanced consumer trust and export competitiveness.
Revenue from dehydrated vegetables in Germany is growing at a CAGR of 6.0%, driven by the country's advanced food processing industry, emphasis on high-quality ingredient supply, and strong consumer demand for convenient yet nutritious food options.
Germany's mature food manufacturing sector and technological expertise are supporting investment in sophisticated dehydration capabilities throughout major processing centers. Industry leaders are establishing comprehensive quality management systems to serve both domestic and export markets with premium dehydrated vegetable products.
Innovations in drying technologies including enhanced freeze-drying techniques and energy-efficient processing methods are creating demand for superior nutritional retention and better texture preservation among quality-focused manufacturers.
Growing health consciousness and rising demand for clean-label products are driving adoption of organic and minimally processed dehydrated vegetables across retail and food service applications throughout the country.
Revenue from dehydrated vegetables in Japan is expanding at a CAGR of 5.5%, supported by the country's focus on premium food processing, advanced culinary applications, and strong consumer preference for high-quality convenience products.
Japan's sophisticated food manufacturing industry and emphasis on nutritional retention are driving demand for advanced processing technologies including freeze-drying and vacuum drying methods. Leading processors are investing in specialized capabilities to serve commercial food production, food service operations, and retail segments with premium dehydrated vegetable offerings.
Regional specialization in volcanic soil-grown vegetables and unique flavor profiles is creating opportunities for premium positioning and distinctive product development throughout major processing regions.
Strong emphasis on traditional cooking methods combined with modern convenience requirements is driving adoption of dehydration technologies that preserve authentic flavors while meeting contemporary food preparation needs.
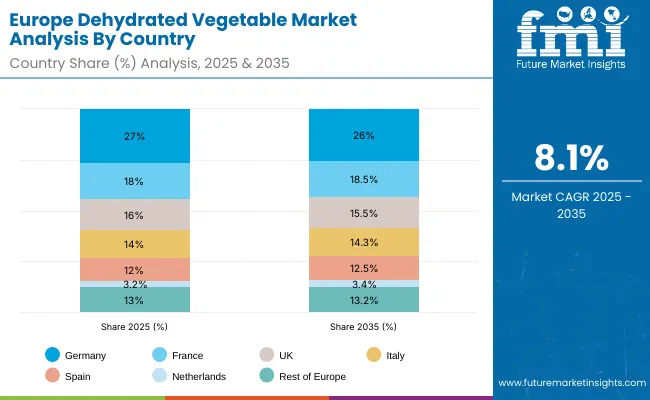
The dehydrated vegetables market in Europe is projected to grow from USD 19.4 billion in 2025 to USD 42.0 billion by 2035, registering a CAGR of 8.1% over the forecast period. Germany is expected to maintain its leadership position with a 27.0% market share in 2025, declining slightly to 26.0% by 2035, supported by its strong processed food industry, advanced freeze-dry facilities, and comprehensive food ingredient supply network serving major European markets.
France follows with an 18.0% share in 2025, projected to reach 18.5% by 2035, driven by robust demand for dehydrated vegetables in soup manufacturing, sauce production, and baby food ingredients, combined with established culinary traditions incorporating dried vegetables.
The United Kingdom holds a 16.0% share in 2025, expected to decrease to 15.5% by 2035, supported by strong convenience food demand but facing challenges from post-Brexit supply chain adjustments and competitive pressures from continental suppliers. Italy commands a 14.0% share in 2025, projected to reach 14.3% by 2035, while Spain accounts for 12.0% in 2025, expected to reach 12.5% by 2035.
The Netherlands maintains a 3.2% share in 2025, growing to 3.4% by 2035. The Rest of Europe region, including Nordic countries, Eastern Europe, Portugal, Belgium, Switzerland, and Austria, is anticipated to gain momentum, expanding its collective share from 13.0% to 13.2% by 2035, attributed to increasing adoption of convenience foods in Nordic countries and growing food processing activities across Eastern European markets implementing modernization programs.
The dehydrated vegetable market is characterized by competition among established food processing companies, specialized dehydration technology providers, and integrated agricultural processors. Companies are investing in advanced dehydration technology research, supply chain optimization, quality control systems, and comprehensive product portfolios to deliver consistent, high-quality, and cost-effective dehydrated vegetable solutions. Innovation in freeze-drying processes, packaging technologies, and organic product development is central to strengthening market position and competitive advantage.
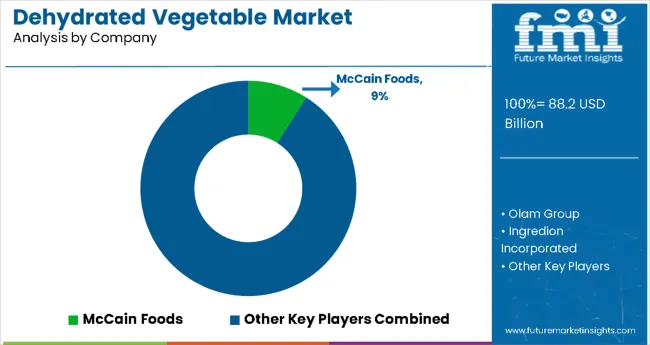
McCain Foods leads the market with a strong market share, offering comprehensive frozen and dehydrated vegetable solutions with a focus on foodservice applications and retail distribution. Olam Group provides specialized agricultural processing capabilities with an emphasis on global supply chain management and ingredient sourcing.
Ingredion Incorporated delivers innovative food ingredient solutions with a focus on functional properties and application versatility. Lamb Weston specializes in potato processing and dehydrated vegetable products for foodservice markets. J.R. Simplot Company focuses on agricultural processing and integrated supply chain operations. Dak Foods / BCFoods offers specialized dehydrated vegetable products with emphasis on Asian markets and culinary applications.
Pathway H - Regulatory & Policy Tailwinds. Policies around food security, reduction of food loss, nutrition labeling, subsidies or incentives for preservation technology will accelerate adoption. Additional revenue: USD 2-4 billion.
| Items | Values |
|---|---|
| Quantitative Units (2025) | USD 88.2 Billion |
| Product Type | Onions, Potatoes, Carrots, Broccoli, Others |
| End Use | Food Manufacturers, Foodservice, Retail |
| Distribution Channel | Hypermarkets/Supermarkets, Convenience Stores, Specialty Stores, Online Retail |
| Regions Covered | North America, Europe, East Asia, South Asia & Pacific, Latin America, Middle East & Africa |
| Countries Covered | United States, Canada, United Kingdom, Germany, France, China, Japan, South Korea, India, Brazil, Australia and 40+ countries |
| Key Companies Profiled | McCain Foods, Olam Group, Ingredion Incorporated, Lamb Weston, J.R. Simplot Company, and Dak Foods / BCFoods |
| Additional Attributes | Dollar sales by product type and end use category, regional demand trends, competitive landscape, technological advancements in dehydration systems, packaging innovation, organic product development, and supply chain optimization |
North America
Europe
East Asia
South Asia & Pacific
Latin America
Middle East & Africa
The global Dehydrated Vegetable industry is estimated at a value of USD 88.2 billion in 2025.
Sales of Dehydrated Vegetable increased at 7.2% CAGR between 2020 and 2024.
Fresno Cooperative Raisin Growers Inc., Olam International, Dole Food Company, Naturex S.A., Symrise AG, Mercer Foods, LLC are some of the leading players in this industry.
The South Asia domain is projected to hold a revenue share of 29% over the forecast period.
North America holds 32% share of the global demand space for Dehydrated Vegetable.


Full Research Suite comprises of:
Market outlook & trends analysis
Interviews & case studies
Strategic recommendations
Vendor profiles & capabilities analysis
5-year forecasts
8 regions and 60+ country-level data splits
Market segment data splits
12 months of continuous data updates
DELIVERED AS:
PDF EXCEL ONLINE
Korea Dehydrated Vegetable Market Analysis by Product Type, Form, Nature, End Use, Technology, Distribution Channel, and Region Through 2035
Demand for Dehydrated Vegetables in EU Size and Share Forecast Outlook 2025 to 2035
Western Europe Dehydrated Vegetables Market Analysis by Product Type, Form, Nature, End Use, Technology, Distribution Channel, and Country Through 2025 to 2035
Demand of Dehydrated Vegetables in Japan Size, Share, and Forecast Outlook 2025 to 2035
Dehydrated Onions Market Analysis - Size, Share, and Forecast Outlook 2025 to 2035
Dehydrated Culture Media Market Analysis - Size, Share, and Forecast 2025 to 2035
Dehydrated Pet Food Market Insights – Premium Nutrition & Market Trends 2025 to 2035
Competitive Overview of Dehydrated Onions Market Share
Market Share Insights of Dehydrated Meat Products Providers
Dehydrated Meat Product Market Growth & Demand Forecast 2025-2035
Dehydrated Garlic Market Trends - Hard Neck, Soft Neck & Powder
Dehydrated Skin Product Market Growth – Trends & Forecast 2024-2034
UK Dehydrated Onions Market Report – Trends, Demand & Outlook 2025–2035
USA Dehydrated Onions Market Insights – Size, Trends & Forecast 2025-2035
ASEAN Dehydrated Onions Market Trends – Size, Demand & Forecast 2025-2035
Europe Dehydrated Onions Market Analysis – Growth, Trends & Forecast 2025-2035
Australia Dehydrated Onions Market Trends – Size, Demand & Forecast 2025–2035
Demand for Dehydrated Onions in EU Size and Share Forecast Outlook 2025 to 2035
Latin America Dehydrated Onions Market Outlook – Demand, Share & Forecast 2025-2035
Vegetable Glycerin Market Size and Share Forecast Outlook 2025 to 2035

Thank you!
You will receive an email from our Business Development Manager. Please be sure to check your SPAM/JUNK folder too.
Chat With
MaRIA