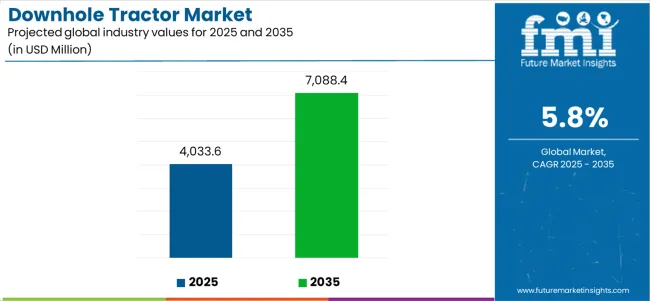
The global downhole tractor market is projected to reach USD 7,088.4 million by 2035, recording an absolute increase of USD 3,054.8 million over the forecast period. The market is valued at USD 4,033.6 million in 2025 and is set to rise at a CAGR of 5.8% during the assessment period. The overall market size is expected to grow by nearly 1.8 times during the same period, supported by increasing demand for deepwater and ultra-deepwater oil field exploration, rising investments in shale gas and tight oil extraction projects, and expanding adoption of advanced well intervention technologies globally. As per Future Market Insights, certified by ESOMAR for credibility in analytics and foresight, high initial investment costs and complex maintenance requirements may pose challenges to market expansion.
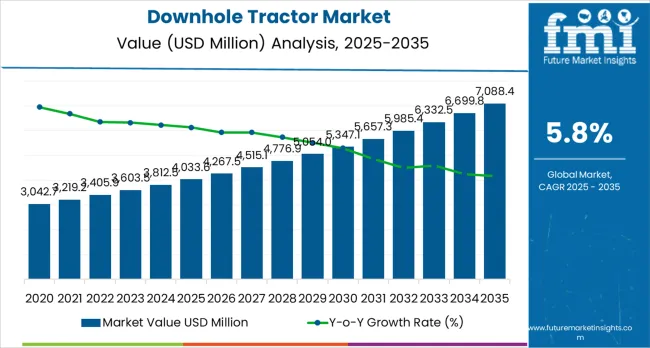
Between 2025 and 2030, the downhole tractor market is projected to expand from USD 4,033.6 million to USD 5,354.2 million, resulting in a value increase of USD 1,320.6 million, which represents 43.2% of the total forecast growth for the decade. This phase of development will be shaped by rising demand for enhanced oil recovery from mature fields, product innovation in multi-drive tractor systems with advanced automation capabilities, as well as expanding integration with real-time data acquisition and monitoring technologies. Companies are establishing competitive positions through investment in autonomous downhole tractor platforms, high-force traction development, and strategic market expansion across offshore drilling, unconventional resource extraction, and geothermal applications.
From 2030 to 2035, the market is forecast to grow from USD 5,354.2 million to USD 7,088.4 million, adding another USD 1,734.2 million, which constitutes 56.8% of the overall ten-year expansion. This period is expected to be characterized by the expansion of specialized tractor systems, including advanced high-force formulations and intelligent control solutions tailored for extreme downhole environments, strategic collaborations between equipment manufacturers and oil service companies, and an enhanced focus on operational efficiency and environmental compliance. The growing emphasis on digitalization in oil and gas operations and autonomous well intervention technologies will drive demand for advanced, high-performance downhole tractor solutions across diverse drilling applications.
| Metric | Value |
|---|---|
| Market Value (2025) | USD 4,033.6 million |
| Market Forecast Value (2035) | USD 7,088.4 million |
| Forecast CAGR (2025 to 2035) | 5.8% |
The downhole tractor market grows by enabling operators to achieve superior well intervention efficiency and tool conveyance capabilities in complex wellbore geometries, ranging from horizontal drilling projects to ultra-deepwater exploration sites. Oil and gas companies face mounting pressure to maximize production from existing wells and access challenging reserves, with advanced tractor solutions typically providing enhanced tool reach and operational reliability compared to conventional conveyance methods, making multi-drive tractors essential for competitive drilling operations. The energy industry's need for efficient well intervention creates demand for advanced tractor solutions that can minimize operational downtime, enhance equipment performance, and ensure reliable tool deployment across diverse downhole conditions. Government initiatives promoting domestic energy production and technological advancement drive adoption in oil and gas exploration, geothermal development, and unconventional resource extraction applications, where operational performance has a direct impact on production efficiency and cost-effectiveness. High equipment costs and the complexity of achieving consistent performance across different geological formations may limit adoption rates among smaller operators and developing regions with limited technical expertise.
The market is segmented by configuration, application, force, and region. By configuration, the market is divided into 2-drive, 3-drive, and 4-drive systems. Based on application, the market is categorized into onshore and offshore operations. By force range, the market includes up to 250 lbf, 250 to 500 lbf, 500 to 1,000 lbf, 1,000 to 2,000 lbf, and 2,000 to 3,500 lbf categories. Regionally, the market is divided into North America, Latin America, Western Europe, Eastern Europe, East Asia, South Asia Pacific, and Middle East &Africa.
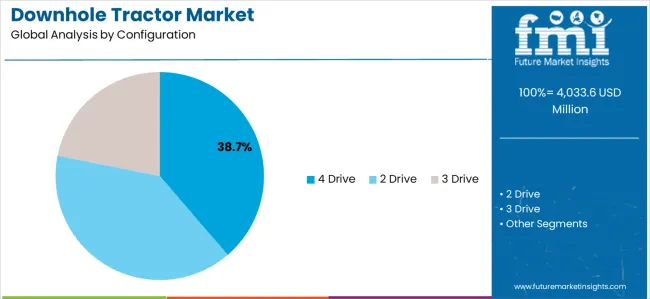
The 4-drive segment represents the dominant force in the downhole tractor market, capturing approximately 38.7% of total market share in 2025. This advanced configuration category encompasses systems featuring superior traction control characteristics, including enhanced load distribution capabilities and optimized stability performance that enable superior operational reliability and enhanced tool conveyance characteristics. The 4-drive segment's market leadership stems from its exceptional performance capabilities in complex wellbore environments, with tractors capable of handling long horizontal sections and extreme geological formations while maintaining consistent traction and operational control across diverse downhole conditions.
The 3-drive segment maintains substantial market share, serving operators who require balanced performance solutions for medium-complexity applications. These systems offer reliable traction for general-purpose well intervention while providing sufficient capability to meet standard performance requirements in deviated wells and moderate-reach drilling applications.
Key technological advantages driving the 4-drive segment include:
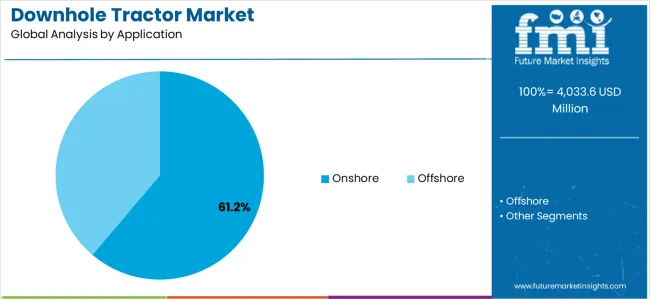
Onshore applications dominate the downhole tractor market with approximately 61.2% market share in 2025, reflecting the critical role of land-based drilling operations in serving unconventional resource extraction and mature field enhancement initiatives. The onshore segment's market leadership is reinforced by increasing shale oil and gas exploration, standardized operational procedures, and rising demand for cost-effective well intervention solutions that directly correlate with operational flexibility and production optimization requirements.
The offshore segment represents significant market opportunity, capturing substantial market share through specialized requirements for deepwater drilling operations, subsea well interventions, and high-pressure high-temperature applications. This segment benefits from growing investments in ultra-deepwater exploration that meet stringent reliability, performance, and safety requirements in demanding marine environments.
Key market dynamics supporting application growth include:
The market is driven by three concrete demand factors tied to energy production and drilling optimization outcomes. First, global energy demand growth and unconventional resource development create increasing demand for advanced well intervention solutions, with complex wellbore geometries in shale formations and deepwater reservoirs requiring specialized tractor technologies for maximum operational efficiency. Second, enhanced oil recovery initiatives and mature field optimization drive the adoption of superior tractor technologies, with operators seeking improved tool conveyance capabilities and operational reliability enhancement. Third, technological advancements in automation and real-time monitoring enable more effective and intelligent tractor solutions that reduce non-productive time while improving long-term performance and cost-effectiveness.
Market restraints include high initial investment costs that can impact project economics and profitability margins, particularly during periods of oil price volatility affecting capital expenditure budgets for advanced equipment. Technical complexity in system integration and maintenance requirements poses another significant challenge, as achieving consistent performance standards across different geological formations and operational conditions requires specialized expertise and quality control systems, potentially causing project delays and increased operational costs. Supply chain dependencies and component availability create additional challenges for manufacturers, demanding ongoing investment in production capabilities and compliance with varying regional operational standards.
Key trends indicate accelerated adoption in emerging markets, particularly in unconventional resource regions and deepwater exploration areas, where rapid technological advancement and operational efficiency requirements drive comprehensive well intervention system development. Technology advancement trends toward artificial intelligence integration with enhanced predictive analytics, autonomous operation capabilities, and multi-functional equipment solutions enable next-generation product development that addresses multiple performance requirements simultaneously. The market thesis could face disruption if alternative well intervention technologies or significant changes in drilling practices minimize reliance on traditional tractor-based conveyance solutions.
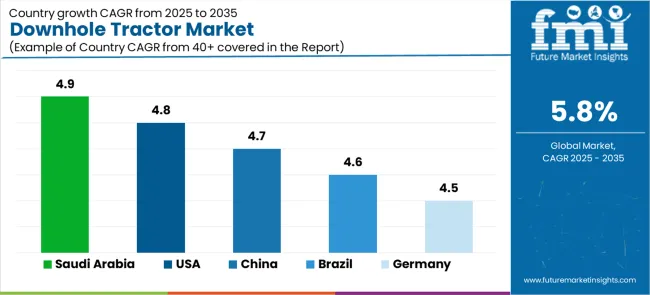
| Country | CAGR (2025-2035) |
|---|---|
| Saudi Arabia | 4.9% |
| United States | 4.8% |
| China | 4.7% |
| Brazil | 4.6% |
| Germany | 4.5% |
The downhole tractor market is gaining momentum worldwide, with Saudi Arabia taking the lead thanks to massive oil field development programs and government-backed energy sector modernization initiatives. Close behind, the United States benefits from growing shale oil exploration and technological leadership in drilling innovation, positioning itself as a strategic growth hub in the North American region. China shows steady advancement, where integration of advanced drilling technologies strengthens its role in the East Asian energy production supply chains. Brazil is focusing on offshore exploration development and deepwater drilling projects, signaling an ambition to capitalize on growing opportunities in Latin American energy markets. Meanwhile, Germany stands out for its precision engineering excellence in drilling equipment applications, recording consistent progress in industrial technology advancement. Together, Saudi Arabia and the United States anchor the global expansion story, while the rest build stability and diversity into the market's growth path.
The report covers an in-depth analysis of 40+ countries, the top-performing countries are highlighted below.
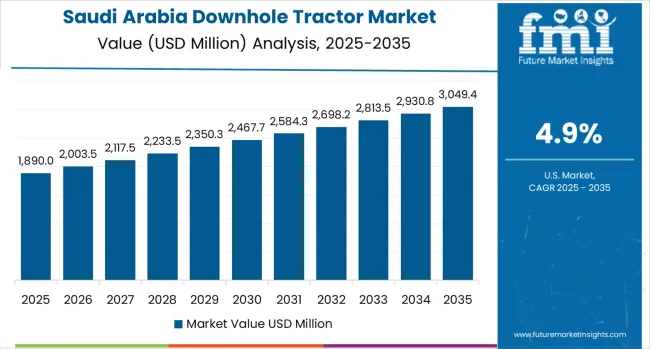
Saudi Arabia demonstrates the strongest growth potential in the Downhole Tractor Market with a CAGR of 4.9% through 2035. The country's leadership position stems from massive oil field development projects, government-backed Vision 2030 initiatives, and aggressive production capacity enhancement targets, driving the adoption of advanced well intervention systems. Growth is concentrated in major oil-producing regions, including Eastern Province, Riyadh, Makkah, and Al-Qassim, where Saudi Aramco and international service companies are implementing advanced tractor solutions for enhanced production performance and operational competitiveness. Distribution channels through established oilfield service providers and direct manufacturer relationships expand deployment across mature field enhancement projects and new drilling operations. The country's energy leadership strategy provides policy support for advanced technology development, including high-performance equipment system adoption.
Key market factors:
In Texas, North Dakota, Pennsylvania, and Oklahoma, the adoption of downhole tractor systems is accelerating across shale formations and unconventional drilling operations, driven by energy independence targets and government pro-domestic energy policies. The market demonstrates strong growth momentum with a CAGR of 4.8% through 2035, linked to comprehensive shale development expansion and increasing focus on drilling efficiency solutions. American operators are implementing advanced tractor systems and automation platforms to enhance operational performance while meeting growing demand for oil and gas production in domestic and international markets. The country's technological leadership programs create continued demand for high-performance intervention solutions, while increasing emphasis on operational efficiency drives adoption of advanced materials and automation technologies.
China's advanced energy industry demonstrates sophisticated implementation of downhole tractor systems, with documented case studies showing efficiency improvements in unconventional drilling applications through optimized well intervention solutions. The country's industrial infrastructure in major energy centers, including Shandong, Heilongjiang, Xinjiang, and Sichuan, showcases integration of advanced tractor technologies with existing drilling systems, leveraging expertise in precision manufacturing and engineering capabilities. Chinese operators emphasize cost-effectiveness and operational efficiency, creating demand for high-performance tractor solutions that support national energy security initiatives and regulatory requirements. The market maintains steady growth through focus on technological advancement and production optimization, with a CAGR of 4.7% through 2035.
Key development areas:
Brazil's market expansion is driven by diverse offshore drilling demand, including deepwater exploration in Santos Basin and Campos Basin regions, subsea development in Espírito Santo and Rio de Janeiro areas, and comprehensive petroleum development across multiple offshore fields. The country demonstrates promising growth potential with a CAGR of 4.6% through 2035, supported by national petroleum programs and regional offshore development initiatives. Brazilian operators face implementation challenges related to deepwater technical requirements and equipment logistics, requiring advanced tractor solutions and international partnership support. Growing pre-salt production targets and offshore drilling competitiveness requirements create compelling business cases for tractor system adoption, particularly in deepwater regions where performance optimization has a direct impact on production economics.
Market characteristics:
Germany's market leads in advanced engineering applications based on integration with next-generation drilling technologies and sophisticated precision manufacturing applications for enhanced performance characteristics. The country shows solid potential with a CAGR of 4.5% through 2035, driven by industrial modernization programs and advanced manufacturing initiatives across major engineering regions, including Bavaria, Baden-Württemberg, North Rhine-Westphalia, and Lower Saxony. German manufacturers are adopting advanced tractor systems for technology development and precision engineering applications, particularly in regions with industrial mandates and advanced manufacturing facilities requiring superior product differentiation. Technology deployment channels through established equipment distributors and direct manufacturer relationships expand coverage across industrial research facilities and international project applications.
Leading market segments:
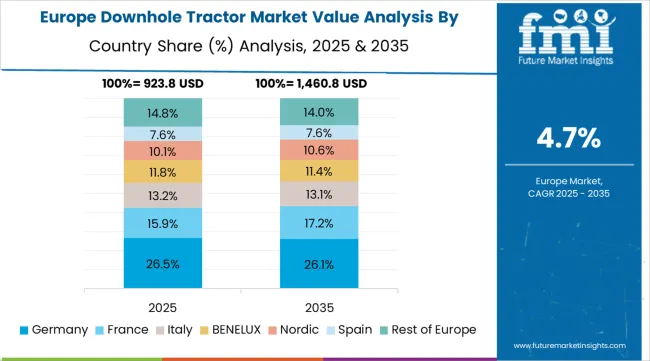
The downhole tractor market in Europe is projected to grow from USD 285.4 million in 2025 to USD 422.8 million by 2035, registering a CAGR of 4% over the forecast period. Germany is expected to maintain its leadership position with a 35.2% market share in 2025, declining slightly to 34.8% by 2035, supported by its extensive precision engineering infrastructure and major industrial technology centers, including Bavaria, Baden-Württemberg, and North Rhine-Westphalia manufacturing facilities.
United Kingdom follows with a 22.1% share in 2025, projected to reach 22.4% by 2035, driven by comprehensive North Sea operations modernization programs and advanced offshore drilling initiatives implementing tractor technologies. Norway holds a 18.3% share in 2025, expected to maintain 18.1% by 2035 through ongoing offshore field development and subsea technology advancement. Netherlands commands a 12.4% share, while France accounts for 8.2% in 2025. The Rest of Europe region is anticipated to gain momentum, expanding its collective share from 3.8% to 4.4% by 2035, attributed to increasing tractor adoption in Eastern European countries and emerging offshore development projects implementing advanced equipment programs.
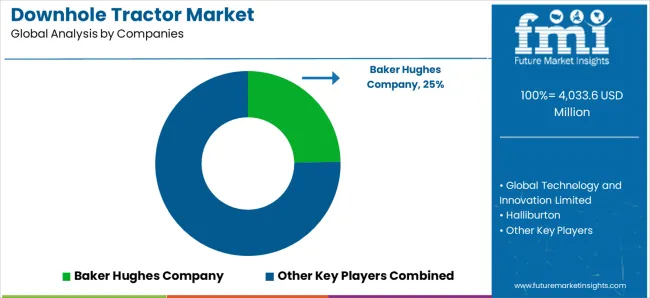
The downhole tractor market features approximately 10-12 meaningful players with moderate to high concentration, where the top three companies control roughly 50-55% of global market share through established technology platforms and extensive oilfield service relationships. Competition centers on technological innovation, operational reliability, and comprehensive service capabilities rather than price competition alone.
Market leaders include Schlumberger Limited, Halliburton, and Baker Hughes Company, which maintain competitive advantages through comprehensive well intervention solution portfolios, global service networks, and deep expertise in the oil and gas equipment sectors, creating high switching costs for customers. These companies leverage research and development capabilities and ongoing technical support relationships to defend market positions while expanding into adjacent drilling automation and intelligent well intervention applications.
Challengers encompass Weatherford International plc, Welltec A/S, and NOV Inc., which compete through specialized engineering solutions and strong regional presence in key drilling markets. Technology specialists, including Global Technology and Innovation Limited, Hunting Energy Services, and Neo Oiltools, focus on specific tractor configurations or vertical applications, offering differentiated capabilities in force delivery, automation integration, and specialized performance characteristics.
Regional players and emerging equipment providers create competitive pressure through cost-effective solutions and rapid customization capabilities, particularly in high-growth markets including North America, Middle East, and offshore regions, where local presence provides advantages in customer service and operational support. Market dynamics favor companies that combine advanced tractor technologies with comprehensive technical support offerings that address the complete equipment lifecycle from design development through ongoing operational optimization.
Downhole tractors represent specialized well intervention equipment that enable operators to achieve superior tool conveyance efficiency and operational reliability compared to conventional systems, delivering enhanced wellbore access capabilities and reduced operational risks with advanced automation features in demanding drilling applications. With the market projected to grow from USD 4,033.6 million in 2025 to USD 7,088.4 million by 2035 at a 5.8% CAGR, these tractor systems offer compelling advantages - enhanced operational efficiency, customizable force configurations, and reliable performance - making them essential for oil and gas exploration, geothermal development, and well intervention operations seeking alternatives to inefficient conveyance systems that compromise performance through inadequate tool deployment. Scaling market adoption and technological advancement requires coordinated action across energy policy, drilling standards development, equipment manufacturers, service industries, and drilling technology investment capital.
| Item | Value |
|---|---|
| Quantitative Units | USD 4,033.6 million |
| Configuration | 2 Drive, 3 Drive, 4 Drive |
| Application | Onshore, Offshore |
| Force | Up to 250 lbf, 250 to 500 lbf, 500 to 1,000 lbf, 1,000 to 2,000 lbf, 2,000 to 3,500 lbf |
| Regions Covered | North America, Latin America, Western Europe, Eastern Europe, East Asia, South Asia Pacific, Middle East &Africa |
| Country Covered | Saudi Arabia, United States, China, Brazil, Germany, and 40+ countries |
| Key Companies Profiled | Baker Hughes Company, Schlumberger Limited, Halliburton, Weatherford International plc, Welltec A/S, Global Technology and Innovation Limited, Hunting Energy Services, Neo Oiltools |
| Additional Attributes | Dollar sales by configuration and force categories, regional adoption trends across North America, Middle East &Africa, and East Asia, competitive landscape with equipment providers and service integrators, drilling operation requirements and specifications, integration with oil and gas exploration and well intervention systems, innovations in tractor technology and automation systems. |
The global downhole tractor market is estimated to be valued at USD 4,033.6 million in 2025.
The market size for the downhole tractor market is projected to reach USD 7,088.4 million by 2035.
The downhole tractor market is expected to grow at a 5.8% CAGR between 2025 and 2035.
The key product types in downhole tractor market are 4 drive, 2 drive and 3 drive.
In terms of application, onshore segment to command 61.2% share in the downhole tractor market in 2025.


Our Research Products

The "Full Research Suite" delivers actionable market intel, deep dives on markets or technologies, so clients act faster, cut risk, and unlock growth.

The Leaderboard benchmarks and ranks top vendors, classifying them as Established Leaders, Leading Challengers, or Disruptors & Challengers.

Locates where complements amplify value and substitutes erode it, forecasting net impact by horizon

We deliver granular, decision-grade intel: market sizing, 5-year forecasts, pricing, adoption, usage, revenue, and operational KPIs—plus competitor tracking, regulation, and value chains—across 60 countries broadly.

Spot the shifts before they hit your P&L. We track inflection points, adoption curves, pricing moves, and ecosystem plays to show where demand is heading, why it is changing, and what to do next across high-growth markets and disruptive tech

Real-time reads of user behavior. We track shifting priorities, perceptions of today’s and next-gen services, and provider experience, then pace how fast tech moves from trial to adoption, blending buyer, consumer, and channel inputs with social signals (#WhySwitch, #UX).

Partner with our analyst team to build a custom report designed around your business priorities. From analysing market trends to assessing competitors or crafting bespoke datasets, we tailor insights to your needs.
Supplier Intelligence
Discovery & Profiling
Capacity & Footprint
Performance & Risk
Compliance & Governance
Commercial Readiness
Who Supplies Whom
Scorecards & Shortlists
Playbooks & Docs
Category Intelligence
Definition & Scope
Demand & Use Cases
Cost Drivers
Market Structure
Supply Chain Map
Trade & Policy
Operating Norms
Deliverables
Buyer Intelligence
Account Basics
Spend & Scope
Procurement Model
Vendor Requirements
Terms & Policies
Entry Strategy
Pain Points & Triggers
Outputs
Pricing Analysis
Benchmarks
Trends
Should-Cost
Indexation
Landed Cost
Commercial Terms
Deliverables
Brand Analysis
Positioning & Value Prop
Share & Presence
Customer Evidence
Go-to-Market
Digital & Reputation
Compliance & Trust
KPIs & Gaps
Outputs
Full Research Suite comprises of:
Market outlook & trends analysis
Interviews & case studies
Strategic recommendations
Vendor profiles & capabilities analysis
5-year forecasts
8 regions and 60+ country-level data splits
Market segment data splits
12 months of continuous data updates
DELIVERED AS:
PDF EXCEL ONLINE
Market Share Insights for Downhole Tractor Providers
Wheel Tractor Scrapers Market Size and Share Forecast Outlook 2025 to 2035
Fume Extractor Market Size and Share Forecast Outlook 2025 to 2035
Dust Extractor Market Growth – Trends & Forecast 2025 to 2035
Orchard Tractors Market Size and Share Forecast Outlook 2025 to 2035
Bone Distractors Market
Surgical Retractors Market Size and Share Forecast Outlook 2025 to 2035
Cervical Retractors Market
Agricultural Tractors Market Analysis - Size, Share, and Forecast Outlook 2025 to 2035
DualMode Automated Tow Tractor Market Size and Share Forecast Outlook 2025 to 2035
Tourism Independent Contractor Model Market Size and Share Forecast Outlook 2025 to 2035
Postoperative Panniculus Retractor Market Trends - Growth & Forecast 2025 to 2035

Thank you!
You will receive an email from our Business Development Manager. Please be sure to check your SPAM/JUNK folder too.
Chat With
MaRIA