

- Market Size (2026)
- USD 1120.7 Mn
- Forecast (2036)
- USD 2103.7 Mn
- CAGR (2026 to 2036)
- 6.5%
How big is the drive filter modules market size?
USD 1,120.7 million in 2026 and USD 2,103.7 million by 2036 at a 6.5% CAGR.
Sales of drive filter modules are estimated to rise at 6.5% CAGR through 2036, increasing valuation from USD 1,120.7 million in 2026 to USD 2,103.7 million by 2036. Reviewing variable frequency drives and motion control centers now requires careful attention toward conducted-noise control alongside solid commissioning records. Increasing equipment adoption globally reinforces such filter evaluations across automated programs. International Federation of Robotics reported in its September 2025 release stating 542,000 industrial robots were installed in 2024. High annual deployment naturally accelerates demand for reliable drive filter modules across newly installed systems.
Navigating international market demands requires adapting toward specific regional preferences. India and China facilities favor local service availability alongside quicker panel-build support. The United States and Germany sourcing teams require deeper compliance files as well as comprehensive lifecycle service records. Meeting varied expectations remains essential for industry operations to protect expanding inventories of active hardware. International Federation of Robotics reported in its 2025 executive summary stating operational industrial robot stock reached 4,663,698 units in 2024. Such significant installed-base growth sustains long-term demand for drive-side components safeguarding automated assets worldwide.
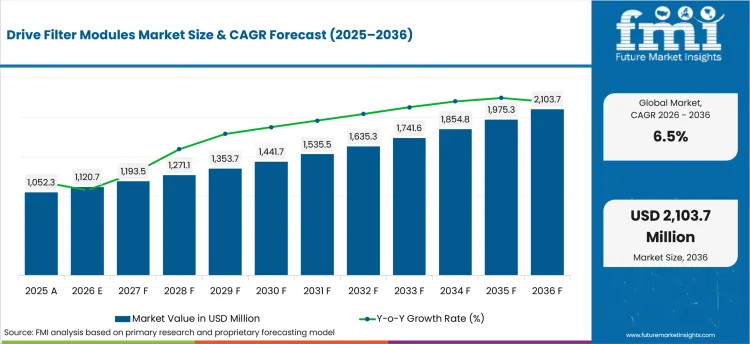
| Metric | Value |
|---|---|
| 2025 Market Size | USD 1,052.3 million |
| 2026 Market Size | USD 1,120.7 million |
| 2036 Market Size | USD 2,103.7 million |
| Forecast CAGR (2026-2036) | 6.5% |
| Drive Rating Focus | 5-50 kW |
| 5-50 kW Share (2026) | 39.0% |
| Installation Focus | Panel-mounted |
| Panel-mounted Share (2026) | 38.0% |
| Filter Type Focus | EMI / RFI Filters |
| EMI / RFI Filters Share (2026) | 31.0% |
Summary of the Drive Filter Modules Market
| Market Signal | Commercial Impact |
|---|---|
| Demand and Growth Drivers | Demand for drive filter modules rises as machine builders connect motion-control performance with electrical-noise control and project acceptance. Buyer decisions are anticipated to reflect product evidence and compatibility records across repeat orders.
|
| Product and Segment View | Segment demand is led by 5-50 kW drive ratings and panel-mounted formats serving recurring industrial-control projects. Specification work is expected to concentrate on supplier-controlled filter programs designed to support drive protection without slowing approval cycles.
|
| Geography and Growth Outlook | Country demand is stronger across automation markets with local project activity and qualified supplier channels. Supplier gains are likely to reflect installation support and documentation discipline.
|
| Competitive View | Competition is likely to focus on filter design breadth and local engineering access. Account gains are expected to favor suppliers with clear technical files and dependable replenishment.
|
| Analyst Perspective | Drive filter modules are developing into a specification-led component segment linked to drive reliability and electrical-noise management. Supplier progress is projected to improve through product evidence and application support aligned with automation and industrial-equipment requirements.
|
Source: Future Market Insights analysis, 2026.
How is the drive filter modules market segmented?
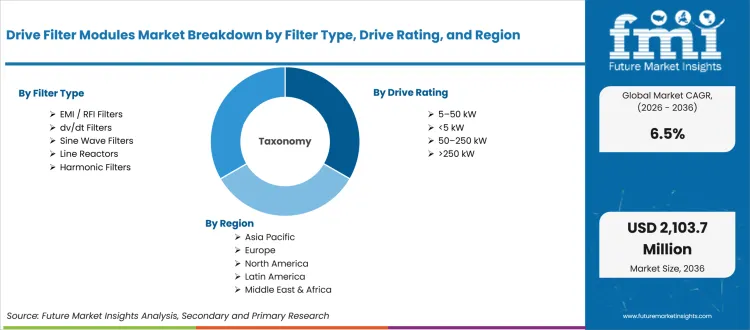
The drive filter modules market is segmented by filter type, drive rating, installation, application, sales channel, and region.
The drive filter modules industry is segmented by filter type, drive rating, installation, application, sales channel, and region. Filter type coverage includes EMI / RFI Filters, dv/dt Filters, Sine Wave Filters, Line Reactors, and Harmonic Filters. Drive rating coverage includes <5 kW, 5-50 kW, 50-250 kW, and >250 kW. Installation coverage includes panel-mounted, drive-integrated, external cabinet-mounted, and DIN rail modules. Application coverage includes servo drives, variable frequency drives, elevators / HVAC drives, and renewable / industrial drives. Sales channel coverage includes direct OEM, electrical distributors, and panel builders / integrators. Regional coverage includes North America, Latin America, Europe, East Asia, South Asia, Oceania, and Middle East and Africa.
What supports demand for EMI / RFI filters within filter type?
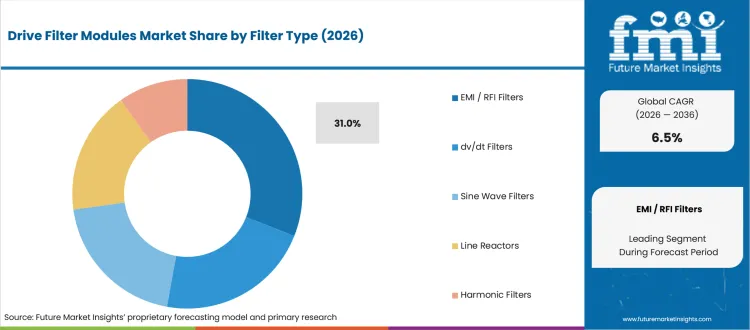
EMI / RFI filters are expected to guide filter type selection as drive switching activity creates electrical-noise risk across machinery and control systems. Because buyers rigorously examine attenuation data and certification files before shifting approved components, suppliers must provide robust technical validation. TDK Electronics stated in its August 28 2025 product release, CarXield supports 500 V and 1000 V systems with rated currents up to 400 A at +85°C by strengthening supplier proof for power-electronics filtering. This validates reliable performance in high-demand electrical environments.
- EMI / RFI filters are anticipated to represent 31.0% share in 2026, reflected by conducted-noise control needs and compliance-document review. Such a prominent position underscores how vital high-frequency attenuation is for stabilizing sensitive control architectures.
- Adoption among machine builders and automation OEMs is projected to grow as engineering teams require verified product evidence prior to component approval. Leading manufacturers rely on solid data linking their filter selection directly to electrical compatibility and dependable service response.
How is 5-50 kW positioned within drive rating?
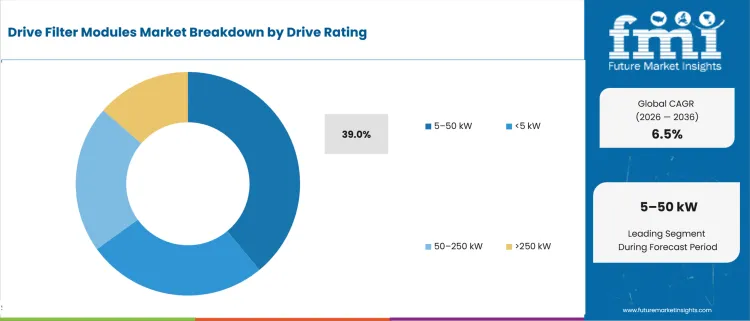
5-50 kW is anticipated to propel recurring demand as many industrial machines use mid-range drives across compressors and compact automation systems. Buyers prefer drive filters within this rating band as technical review stays practical for panel builders and service teams. To highlight the expanding footprint of such machinery, International Federation of Robotics reported in its 2025 executive summary for metal and machinery applications representing 16% of industrial robot installations in 2024. This influences adoption for mid-range drive protection in production equipment, confirming standardized filtering are critical for automated manufacturing reliability.
- Holding a dominant position in the drive rating category, the 5-50 kW band is likely to garner 39.0% share in 2026 due to its common use across general industrial drives and repeated control-panel builds. This steady requirement ensures consistent volume for components tailored to standard medium-duty machinery.
- Machine builders and component distributors are expected to accelerate orders within this power bracket as they rely on predictable filter sizing. To acquire specifications, vendors are required to deliver comprehensive support documentation that clearly correlates rating selection with cable length and motor duty.
What drives panel-mounted demand within installation?
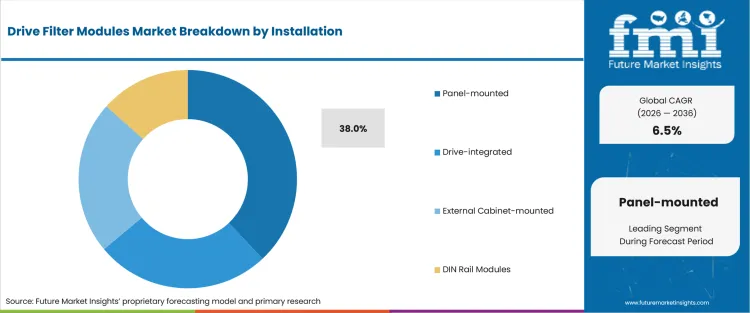
Panel-mounted installation is expected to support drive filter installations through cabinet-level integration and easier service access. Engineering teams use panel-mounted formats to place filters near drives and power-entry points without changing machine architecture. Illustrated by Eaton stating in its SC9000 CI product page updated September 2025 by claiming the drive places an optional output filter above the inverter lowering layout pressure for long-cable applications. It demonstrates how smart cabinet integration directly resolves complex spatial constraints on the factory floor.
- Panel-mounted designs are estimated to claim 38.0% share of installation in 2026, underpinned by the practical benefits of cabinet-level integration and service-friendly access. Such configurations significantly streamline maintenance procedures by allowing technicians to replace units without disassembling adjacent hardware.
- Integrators and panel builders are increasingly specifying such modular formats to streamline layouts and ensure clear engineering drawings. In response, component providers need to supply precise installation manuals supporting cabinet spacing and field replacement.
How do variable frequency drives support application demand?
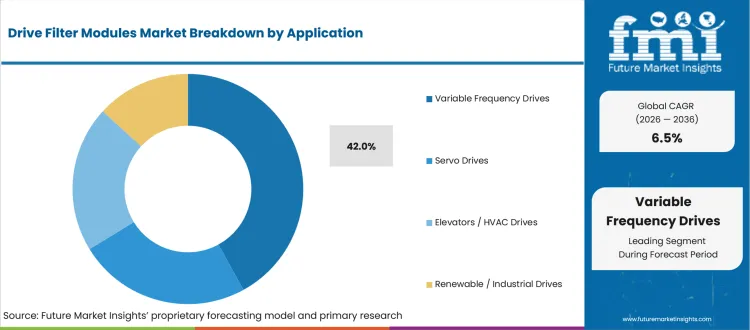
Variable frequency drives are estimated to support application as speed-controlled equipment requires noise mitigation and motor-protection planning. Facility teams use filters to reduce service issues linked to switching behavior and longer motor cables. Underscoring the necessity of high-capacity protection, Eaton reported in its May 2025 SC9000 AFE design guide stating the drive supports 4160 V motors up to 2000 hp in a 112-inch-wide structure keeping filter review close to medium-voltage drive design. Ensuring even massive industrial machinery maintains stable and efficient electrical operations.
- In terms of application, variable frequency drives are predicted to secure 42.0% share in 2026 owing to repeated use across conveyors and process equipment. Proactive filter integration in such setups is essential for safeguarding motor windings against high-voltage spikes and thermal stress.
- As facility accounts prioritize harmonic mitigation and output filtering, equipment utilizing variable frequency drives are likely to experience expanding protection requirements. Engineering teams actively seek detailed application notes matching drive topology with electrical-noise control.
How does direct OEM supply affect sales channel demand?
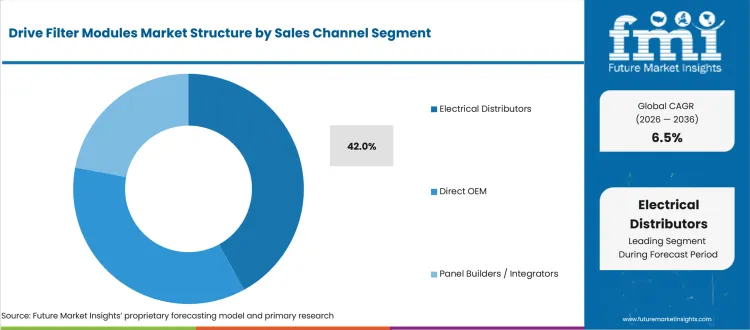
Direct OEM supply is anticipated to promote specification control as machine builders and automation suppliers need component alignment before production release. Account teams prefer direct support shortening changes to drive-filter drawings and technical files. Showcasing the benefits of component scalability in this model, MTE Corporation stated on September 2025 announcing for SyntriX AHF to have scaled from 50 A to 450 A+ without redesign. This promotes direct specification work across retrofit and new installations, allowing equipment manufacturers to seamlessly deploy standardized filtering solutions across varied product lines.
- By the sales channel landscape, direct OEM supply is projected to account for 30.4% share in 2026 due to account-specific documentation and recurring design support. This collaborative model fosters long-term engineering partnerships significantly reducing time-to-market for new machinery series.
- Direct purchasing volumes are set to climb whenever large-scale equipment programs necessitate tightly coordinated design files and recurring filter control. Direct engagement dominates volume manufacturing with panel builders remaining useful for replacement needs and smaller project orders.
What are the drivers, restraints, and opportunities in the drive filter modules market?
Near-term purchases are shaped by product availability and service-led adoption routes outlined below.
- Driver: Machine builders are replacing lightly filtered drive installations with validated modules designed to support electrical-noise control and repeatable machine acceptance.
- Restraint: Adoption slows if dimensional fit or installation documentation remains unclear.
- Opportunity: Suppliers offering drive-filter portfolios with application files and local support improve approval chances across automation accounts.
Modern automated factories place a heavy emphasis on equipment reliability during daily production planning. International Federation of Robotics reported in its September 2025 release, annual industrial-robot installations stayed above 500,000 units for the fourth consecutive year in 2024. Massive hardware growth naturally reinforces buyer attention on protective components keeping automated systems safe from avoidable electrical issues.
Getting new filtering equipment approved remains difficult when standard product claims do not match actual performance expectations on site. Eaton stated on its SC9000 CI product page updated September 2025, the compact inverter drive is designed for 2400 V or 4160 V induction or synchronous motors. Dealing with such high-power systems increases documentation pressure for component suppliers trying to enter medium-voltage projects.
Fresh growth paths are opening up as newer electrical layouts adopt smaller designs and handle higher voltages. TDK Electronics reported on April 2026, its compact common-mode chokes measure 23 x 15.5 x 24 mm and are designed for rated DC voltages up to 1250 V. Smaller component sizes successfully support supplier programs serving newer converter and drive architectures.
What country CAGRs are profiled in the drive filter modules market?
.webp "Top Country Growth Comparison Drive Filter Modules Market Cagr (2026 2036)")
| Country | CAGR |
|---|---|
| India | 8.4% |
| China | 7.6% |
| South Korea | 6.2% |
| Mexico | 6.0% |
| United States | 5.5% |
| Germany | 5.1% |
| Japan | 4.8% |
Source: Future Market Insights, 2026.
How do country-level CAGRs compare in the drive filter modules market?
Country demand in drive filter modules is expected to be guided by machine-builder activity and service-channel strength. India and China are likely to connect demand with expanding factory automation and local component availability. South Korea and Japan are anticipated to connect adoption with electronics manufacturing and compact equipment design. Mexico and Germany are projected to connect demand with qualification files and reliable field support.
- India drive filter module market is likely to be shaped by factory automation programs and local integration activity. International Federation of Robotics reported in its September 2025 India release stating industrial-robot sales in India reached 9,120 installed units in 2024, propelling demand for drive filters supporting control-panel reliability. Demand in India is projected to grow at 8.4% CAGR between 2026 and 2036, reflected by expanding factory automation programs and local integration activity. Local suppliers are estimated to gain account attention through short sampling cycles and dependable product availability.
- China drive filter module industry is projected to be influenced by automation scale and domestic equipment sourcing. Sales in China are forecast to expand at 7.6% CAGR from 2026 to 2036, supported by extensive automation deployment and domestic equipment sourcing. International Federation of Robotics reported in its September 2025 release noting China installed 295,000 industrial robots in 2024, pushing drive-filter qualification into routine machinery programs. Domestic suppliers are expected to receive stronger review once technical files and replenishment discipline match equipment launch schedules.
- South Korea buyers are expected to favor suppliers supporting electronics production and precise equipment operation. International Federation of Robotics reported in its 2025 executive summary recording 30,596 industrial-robot installations in South Korea during 2024, supporting demand for drive filters suited to controlled automation environments. Adoption in South Korea is predicted to rise at 6.2% CAGR by 2036, driven by electronics production and precise equipment operation. Packaged filter suppliers are likely to gain acceptance through low-noise performance evidence and fast engineering feedback.
- Mexico drive filter module purchasing is anticipated to be shaped by industrial automation serving automotive and export-linked manufacturing. Demand in Mexico is expected to scale at 6.0% CAGR during the assessment period, aided by automotive production and export-linked manufacturing activity. International Federation of Robotics reported in its 2025 executive summary stating Mexico installed 5,594 industrial robots in 2024, keeping drive-filter selection close to manufacturing uptime and integration support. Account teams are likely to require product drawings and field guidance before recurring orders move to new suppliers.
- The market in United States is estimated to expand at 5.5% CAGR between 2026 and 2036, underpinned by harmonic mitigation needs and EMC compliance review. United States account teams are expected to review harmonic mitigation and EMC evidence before replacing approved components. International Federation of Robotics reported in its September 2025 United States release announcing 34,164 industrial-robot installations in 2024, sustaining filter demand across automation and machinery accounts. Supplier selection is expected to favor tested filters and clear troubleshooting support.
- Germany keeps drive filter module sector close to technical review and documentation quality. International Federation of Robotics reported in its 2025 executive summary noting Germany installed 26,982 industrial robots in 2024, supporting filter review across machinery and automation projects. Controlled supplier changes are anticipated to keep purchasing centered on compliance records and panel-integration clarity. German engineering teams are likely to avoid quick component switches unless sample quality and evidence files stay stable. Sector in Germany is projected to post 5.1% CAGR during the forecast period, guided by rigorous technical review and documentation quality.
- Japan drive filter module market is expected to reflect compact equipment design and long qualification cycles. International Federation of Robotics reported in its September 2025 release stating Japan installed 44,500 industrial robots in 2024, keeping drive-filter selection close to reliability and service-life expectations. Japanese brand teams are anticipated to value low rework risk and stable technical documentation. Demand in Japan is projected to grow at 4.8% CAGR through 2036, reinforced by compact equipment design and long qualification cycles.
Who are the notable companies in the drive filter modules market?
TE Connectivity / Schaffner, TDK, Eaton, MTE Corporation, KEMET / YAGEO, Danfoss, Siemens, ABB, REO, and Block Transformatoren-Elektronik are expected to shape report scope.
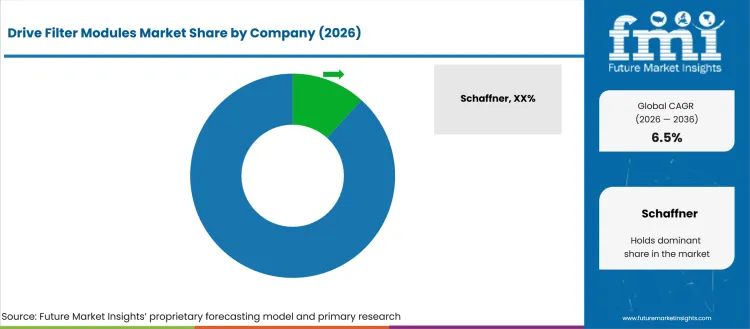
Competition in drive filter modules is anticipated to center on harmonic mitigation knowledge and regional service reach. Account teams are likely to compare suppliers based on technical files and ability to support repeat-order programs after initial approval. TE Connectivity / Schaffner and Eaton are expected to receive review attention due to EMC-filter depth and power-quality expertise. MTE Corporation and Danfoss are projected to compete based on filter engineering and drive-system support. Siemens and Block Transformatoren-Elektronik are estimated to support account demand led by automation access and application support.
- TE Connectivity / Schaffner and Eaton are expected to gain account attention based on EMC-filter portfolios and documentation support. Industrial filter experience is likely to promote programs requiring compliance testing and repeat production discipline.
- MTE Corporation and Danfoss are anticipated to compete led by harmonic mitigation and drive-system knowledge. Market role is projected to improve as automation accounts review power quality before approval.
- Siemens and ABB are forecast to influence demand due to automation-system access. Industrial controls experience is expected to help accounts compare filter needs with drive and panel requirements.
- REO and Block Transformatoren-Elektronik are estimated to gain review strength depending on application engineering support and custom filter depth. Supplier access is likely to improve as machinery builders need validated filtering and compact integration.
Competitive Benchmarking: Drive Filter Modules Market
| Company | Portfolio Depth | Filter Format Match | Application Support | Service Reach |
|---|---|---|---|---|
| TE Connectivity / Schaffner | High | High | High | Global |
| TDK | High | High | High | Global |
| Eaton | High | High | High | Global |
| MTE Corporation | High | High | High | Regional/Global |
| KEMET / YAGEO | Medium | High | High | Global |
| Danfoss | Medium | Medium | High | Global |
| Siemens | Medium | Medium | High | Global |
| ABB | Medium | Medium | High | Global |
| REO | Medium | High | Medium | Regional/Global |
| Block Transformatoren-Elektronik | Medium | High | Medium | Regional |
Source: Future Market Insights competitive analysis, 2026.
Key Developments in the Drive Filter Modules Market
- In September 2025, MTE Corporation released SyntriX AHF built with silicon carbide technology. MTE stated on September 2025, the active harmonic filter delivers over 99% system efficiency and a footprint up to 30% smaller than legacy systems supporting compact harmonic mitigation for retrofit and new installations.
- In September 2025, Eaton updated its SC9000 CI medium-voltage variable frequency drive documentation. Eaton stated on its product page updated September 2025, the SC9000 CI drive uses up to 40% less floorspace supporting installations needing output filtering in tighter equipment rooms.
- In January 2026, Eaton Corporation announced the technical and commercial release of its expanded Harmonic Correction Unit (HCU2) active harmonic filter series. According to official company technical releases and product documentation, this active filter platform is specifically engineered to dynamically mitigate severe harmonic distortion and reactive power issues generated by industrial variable frequency drives (VFDs) and non-linear power electronics.
Key Players in the Drive Filter Modules Market
EMC filter and power-quality suppliers
- TE Connectivity / Schaffner
- TDK
- Eaton
Harmonic mitigation and drive-support specialists
- MTE Corporation
- KEMET / YAGEO
- Danfoss
Automation and system-support groups
- Siemens
- ABB
- REO
Custom magnetic and filter suppliers
- Block Transformatoren-Elektronik
Drive Filter Modules Market - Report Scope
| Coverage field | Report scope |
|---|---|
| Market breakdown | Drive Filter Modules Market Breakdown By Filter Type, Drive Rating, Installation, Application, Sales Channel, and Region |
| Market Definition | Drive Filter Modules refers to EMI / RFI filters, harmonic filters, dv/dt filters, sine wave filters, and related drive-side modules used to improve electrical compatibility, drive reliability, motor protection, installation flexibility, and uptime in automated equipment. |
| Regions Covered | North America, Latin America, Europe, East Asia, South Asia, Oceania, and Middle East and Africa |
| Countries Covered | United States, China, Germany, Japan, India, South Korea, Mexico, and 25+ countries |
| Key Companies Profiled | TE Connectivity / Schaffner, TDK, Eaton, MTE Corporation, KEMET / YAGEO, Danfoss, Siemens, ABB, REO, and Block Transformatoren-Elektronik |
| Forecast Period | 2026 to 2036 |
| Approach | Hybrid bottom-up and top-down methodology using machine-tool output, automation component demand, OEM design cycles, retrofit activity, distributor coverage, and country-level industrial equipment indicators. |
Source: Future Market Insights analysis, 2026.
Drive Filter Modules Market - Research Methodology
| Method | Approach |
|---|---|
| Primary Research | FMI analysts reviewed inputs from machine builders, automation OEMs, maintenance teams, component distributors, and precision equipment manufacturers. Interviews focused on demand triggers, application use, approval barriers, service ownership, replacement behavior, and practical limits of changing suppliers. |
| Desk Research | Desk research covered company product pages, association references, standards-body sources, and industry statistics. Product use was checked against automation uptime, machine accuracy, retrofit compatibility, drive protection, and shorter equipment commissioning cycles. |
| Market Sizing and Forecasting | Market sizing used a hybrid top-down and bottom-up model. Inputs included the 2025 backcast, 2026 base value, 2036 forecast value, segment-share mix, country CAGRs, channel route, and the likely parent market: EMI Filters and Drive Protection Components Market. |
| Data Validation | Data validation compares interview findings from drive builders, electrical distributors, plant engineers, and automation maintenance teams against source-pool consistency and channel availability. Analysts test country-level growth against factory electrification programs, converter upgrades, and verified portfolio reviews to avoid counting adjacent businesses without clear connection to the report scope. The forecast is then triangulated across new equipment installations, system retrofits, and recurring harmonic filtering checks that influence repeat drive filter module demand. |
Source: Future Market Insights analysis, 2026.
Drive Filter Modules Market by Segments
Drive Filter Modules Market segmented by Filter Type:
- EMI / RFI Filters
- dv/dt Filters
- Sine Wave Filters
- Line Reactors
- Harmonic Filters
Drive Filter Modules Market segmented by Drive Rating:
- <5 kW
- 5-50 kW
- 50-250 kW
- >250 kW
Drive Filter Modules Market segmented by Installation:
- Panel-mounted
- Drive-integrated
- External Cabinet-mounted
- DIN Rail Modules
Drive Filter Modules Market segmented by Application:
- Servo Drives
- Variable Frequency Drives
- Elevators / HVAC Drives
- Renewable / Industrial Drives
Drive Filter Modules Market segmented by Sales Channel:
- Direct OEM
- Electrical Distributors
- Panel Builders / Integrators
Drive Filter Modules Market by Region:
- North America
- United States
- Canada
- Latin America
- Brazil
- Mexico
- Argentina
- Europe
- Germany
- United Kingdom
- France
- Italy
- Spain
- East Asia
- China
- Japan
- South Korea
- South Asia
- India
- Thailand
- Indonesia
- Oceania
- Australia
- New Zealand
- Middle East and Africa
- GCC countries
- South Africa
- Türkiye
Research Sources and Bibliography
- Danfoss. (2025, August 25). How CAESB turned downtime risks into long-term operational reliability.
- Eaton. (2025, May). SC9000 AFE variable frequency drive - medium voltage design guide.
- Eaton. (2025, September 24). SC9000 CI medium-voltage variable frequency drive.
- International Federation of Robotics. (2025). World Robotics 2025 - Industrial Robots: Executive summary.
- International Federation of Robotics. (2025, September 25). Global robot demand in factories doubles over 10 years.
- International Federation of Robotics. (2025, September 25). India rises to sixth in global factory robot installations.
- International Federation of Robotics. (2025, September 25). USA lags China in factory robot deployment by 5 to 1 ratio.
- MTE Corporation. (2025, September 22). MTE launches next-gen active harmonic filter built with silicon carbide technology.
- TDK Electronics. (2025, August 28). TDK unveils standardized CarXield EMC filters for xEV platforms.
- TDK Electronics. (2026, April 15). TDK enables compact 1250 V DC converter designs with a new high-voltage common-mode choke.
- TE Connectivity. (2025, August). Drives & Motors.
- Eaton. (2026). Harmonic correction unit (HCU2) active harmonic filter (Publication No. TD156001EN).
This bibliography is provided for reader reference and is not exhaustive. The full report contains the complete reference list and detailed citations.
This Report Answers
- What segments shape demand across filter type, drive rating, installation, application, and sales channel?
- How do machine builders evaluate drive filter modules before replacing approved filtering components?
- How do country CAGRs differ across profiled markets?
- What companies compete through EMC-filter depth and drive-system service?
- How does FMI validate forecasts using a hybrid bottom-up and top-down approach?
- What factors should account teams address before larger account expansion?
- How do technical files and electrical-noise evidence affect supplier selection?
- What limits return on investment for account teams adding drive filter modules to machinery programs?
- How do application files and installation records influence account approval?
- What supplier capabilities improve long-term account confidence?
Frequently Asked Questions
What is supporting demand in the drive filter modules market?
Demand is likely to be supported by machine builders and automation teams needing drive-side filtering for electrical-noise control and machine acceptance. Accounts are expected to prefer modules combining EMC evidence and service-ready documentation.
Who are the key players in the drive filter modules market?
Key companies are anticipated to include TE Connectivity / Schaffner, TDK, Eaton, MTE Corporation, KEMET / YAGEO, Danfoss, Siemens, ABB, REO, and Block Transformatoren-Elektronik. Competition is likely to be based on filter breadth and application support.
What is a restraint in the drive filter modules market?
A main restraint is the qualification burden created by incomplete controller compatibility records and limited shielding guidance across drive projects. Accounts slow adoption if filters lack cabinet compatibility or supplier response needed for approval.
Why should executives track the drive filter modules market?
Executives are expected to track the market as drive filtering affects machine uptime and supplier accountability. Factors such as commissioning delays and repeat service exposure shape buyer reviews.
What business problem does the drive filter modules market address?
Market demand addresses a practical machinery problem linked to electrical-noise exposure and delayed site acceptance in automated equipment. Industrial users need filter modules protecting drives and motors from electrical-noise issues across automation programs.
What should account teams evaluate before selecting suppliers?
Account teams are likely to evaluate attenuation data and installation support before supplier approval. Technical files and application guidance are expected to guide final supplier review.
What limits return on investment for purchasing teams?
Return on investment weakens if product compatibility or account acceptance is not proven before rollout. Rework and delayed commissioning reduce expected operating gains.
How do suppliers build long-term account confidence?
Suppliers build account confidence by providing consistent product quality and technical evidence specific to drive filter modules. Application records and responsive field support are expected to influence repeat-order trust.
Preview the report firsthand - request a free sample
Get SampleGet the brochure for pricing and purchase details.
Get PDFTable of Content
- Key Takeaways
- Market Size and CAGR
- Top Growth Driver
- Fastest Growing Segment
- Leading Region
- Key Companies
- Emerging Opportunities
- Executive Summary
- Global Market Outlook
- Demand-side Trends
- Supply-side Trends
- Technology Roadmap Analysis
- Analysis and Recommendations
- Analyst Perspective (What is happening? Why now? What should investors know?)
- Key Questions Answered
- How large is the market?
- What is the CAGR?
- What are key trends?
- Which region dominates?
- Who are the leaders?
- Market Overview
- Market Coverage / Taxonomy
- Market Definition / Scope / Limitations
- Research Methodology
- Chapter Orientation
- Analytical Lens and Working Hypotheses
- Market Structure, Signals, and Trend Drivers
- Benchmarking and Cross-market Comparability
- Market Sizing, Forecasting, and Opportunity Mapping
- Research Design and Evidence Framework
- Desk Research Programme (Secondary Evidence)
- Expert Input and Fieldwork (Primary Evidence)
- Tooling, Models, and Reference Databases
- Data Engineering and Model Build
- Quality Assurance and Audit Trail
- Market Background
- Market Dynamics (Drivers, Restraints, Opportunity, Trends)
- Scenario Forecast (Optimistic, Likely, Conservative)
- Impact Analysis
- AI Impact
- Sustainability Impact
- Regulatory Impact
- Technology Impact
- Consumer / Buyer Analysis
- Purchase Drivers
- Adoption Barriers
- Buyer Journey
- Opportunity Map Analysis
- Product Life Cycle Analysis
- Supply Chain Analysis
- Investment Feasibility Matrix
- Value Chain Analysis
- PESTLE and Porter's Analysis
- Regulatory Landscape
- Regional Parent Market Outlook
- Production and Consumption Statistics
- Import and Export Statistics
- Global Market Analysis and Forecast, 2021 to 2036
- Historical Market Size Value (USD Million) & Volume (Unit) Analysis, 2021 to 2025
- Current and Future Market Size Value (USD Million) & Volume (Unit) Projections, 2026 to 2036
- Y-o-Y Growth Trend Analysis
- Absolute $ Opportunity Analysis
- Global Market Pricing Analysis, 2021 to 2036
- Global Market Analysis and Forecast, By Filter Type, 2021 to 2036
- Introduction / Key Findings
- Historical Market Size Value (USD Million) & Volume (Unit) Analysis By Filter Type, 2021 to 2025
- Current and Future Market Size Value (USD Million) & Volume (Unit) Analysis and Forecast By Filter Type, 2026 to 2036
- EMI / RFI Filters
- dv/dt Filters
- Sine Wave Filters
- Line Reactors
- Harmonic Filters
- EMI / RFI Filters
- Y-o-Y Growth Trend Analysis By Filter Type, 2021 to 2025
- Absolute $ Opportunity Analysis By Filter Type, 2026 to 2036
- Global Market Analysis and Forecast, By Drive Rating, 2021 to 2036
- Introduction / Key Findings
- Historical Market Size Value (USD Million) & Volume (Unit) Analysis By Drive Rating, 2021 to 2025
- Current and Future Market Size Value (USD Million) & Volume (Unit) Analysis and Forecast By Drive Rating, 2026 to 2036
- 5–50 kW
- <5 kW
- 50–250 kW
- >250 kW
- 5–50 kW
- Y-o-Y Growth Trend Analysis By Drive Rating, 2021 to 2025
- Absolute $ Opportunity Analysis By Drive Rating, 2026 to 2036
- Global Market Analysis and Forecast, By Installation, 2021 to 2036
- Introduction / Key Findings
- Historical Market Size Value (USD Million) & Volume (Unit) Analysis By Installation, 2021 to 2025
- Current and Future Market Size Value (USD Million) & Volume (Unit) Analysis and Forecast By Installation, 2026 to 2036
- Panel-mounted
- Drive-integrated
- External Cabinet-mounted
- DIN Rail Modules
- Panel-mounted
- Y-o-Y Growth Trend Analysis By Installation, 2021 to 2025
- Absolute $ Opportunity Analysis By Installation, 2026 to 2036
- Global Market Analysis and Forecast, By Application, 2021 to 2036
- Introduction / Key Findings
- Historical Market Size Value (USD Million) & Volume (Unit) Analysis By Application, 2021 to 2025
- Current and Future Market Size Value (USD Million) & Volume (Unit) Analysis and Forecast By Application, 2026 to 2036
- Variable Frequency Drives
- Servo Drives
- Elevators / HVAC Drives
- Renewable / Industrial Drives
- Variable Frequency Drives
- Y-o-Y Growth Trend Analysis By Application, 2021 to 2025
- Absolute $ Opportunity Analysis By Application, 2026 to 2036
- Global Market Analysis and Forecast, By Sales Channel, 2021 to 2036
- Introduction / Key Findings
- Historical Market Size Value (USD Million) & Volume (Unit) Analysis By Sales Channel, 2021 to 2025
- Current and Future Market Size Value (USD Million) & Volume (Unit) Analysis and Forecast By Sales Channel, 2026 to 2036
- Electrical Distributors
- Direct OEM
- Panel Builders / Integrators
- Electrical Distributors
- Y-o-Y Growth Trend Analysis By Sales Channel, 2021 to 2025
- Absolute $ Opportunity Analysis By Sales Channel, 2026 to 2036
- Global Market Analysis and Forecast, By Region, 2021 to 2036
- Introduction
- Historical Market Size Value (USD Million) & Volume (Unit) Analysis By Region, 2021 to 2025
- Current Market Size Value (USD Million) & Volume (Unit) Analysis and Forecast By Region, 2026 to 2036
- North America
- Latin America
- Western Europe
- Eastern Europe
- East Asia
- South Asia and Pacific
- Middle East & Africa
- Market Attractiveness Analysis By Region
- North America Market Analysis and Forecast, By Country, 2021 to 2036
- Historical Market Size Value (USD Million) & Volume (Unit) Trend Analysis By Market Taxonomy, 2021 to 2025
- Market Size Value (USD Million) & Volume (Unit) Forecast By Market Taxonomy, 2026 to 2036
- By Country
- USA
- Canada
- By Filter Type
- By Drive Rating
- By Installation
- By Application
- By Sales Channel
- By Country
- Market Attractiveness Analysis
- By Country
- By Filter Type
- By Drive Rating
- By Installation
- By Application
- By Sales Channel
- Key Takeaways
- Latin America Market Analysis and Forecast, By Country
- Historical Market Size Value (USD Million) & Volume (Unit) Trend Analysis By Market Taxonomy, 2021 to 2025
- Market Size Value (USD Million) & Volume (Unit) Forecast By Market Taxonomy, 2026 to 2036
- By Country
- Brazil
- Mexico
- Chile
- Rest of Latin America
- By Filter Type
- By Drive Rating
- By Installation
- By Application
- By Sales Channel
- By Country
- Market Attractiveness Analysis
- By Country
- By Filter Type
- By Drive Rating
- By Installation
- By Application
- By Sales Channel
- Key Takeaways
- Western Europe Market Analysis and Forecast, By Country
- Historical Market Size Value (USD Million) & Volume (Unit) Trend Analysis By Market Taxonomy, 2021 to 2025
- Market Size Value (USD Million) & Volume (Unit) Forecast By Market Taxonomy, 2026 to 2036
- By Country
- Germany
- UK
- Italy
- Spain
- France
- Nordic
- BENELUX
- Rest of Western Europe
- By Filter Type
- By Drive Rating
- By Installation
- By Application
- By Sales Channel
- By Country
- Market Attractiveness Analysis
- By Country
- By Filter Type
- By Drive Rating
- By Installation
- By Application
- By Sales Channel
- Key Takeaways
- Eastern Europe Market Analysis and Forecast, By Country
- Historical Market Size Value (USD Million) & Volume (Unit) Trend Analysis By Market Taxonomy, 2021 to 2025
- Market Size Value (USD Million) & Volume (Unit) Forecast By Market Taxonomy, 2026 to 2036
- By Country
- Russia
- Poland
- Hungary
- Balkan & Baltic
- Rest of Eastern Europe
- By Filter Type
- By Drive Rating
- By Installation
- By Application
- By Sales Channel
- By Country
- Market Attractiveness Analysis
- By Country
- By Filter Type
- By Drive Rating
- By Installation
- By Application
- By Sales Channel
- Key Takeaways
- East Asia Market Analysis and Forecast, By Country
- Historical Market Size Value (USD Million) & Volume (Unit) Trend Analysis By Market Taxonomy, 2021 to 2025
- Market Size Value (USD Million) & Volume (Unit) Forecast By Market Taxonomy, 2026 to 2036
- By Country
- China
- Japan
- South Korea
- By Filter Type
- By Drive Rating
- By Installation
- By Application
- By Sales Channel
- By Country
- Market Attractiveness Analysis
- By Country
- By Filter Type
- By Drive Rating
- By Installation
- By Application
- By Sales Channel
- Key Takeaways
- South Asia and Pacific Market Analysis and Forecast, By Country
- Historical Market Size Value (USD Million) & Volume (Unit) Trend Analysis By Market Taxonomy, 2021 to 2025
- Market Size Value (USD Million) & Volume (Unit) Forecast By Market Taxonomy, 2026 to 2036
- By Country
- India
- ASEAN
- Australia & New Zealand
- Rest of South Asia and Pacific
- By Filter Type
- By Drive Rating
- By Installation
- By Application
- By Sales Channel
- By Country
- Market Attractiveness Analysis
- By Country
- By Filter Type
- By Drive Rating
- By Installation
- By Application
- By Sales Channel
- Key Takeaways
- Middle East & Africa Market Analysis and Forecast, By Country
- Historical Market Size Value (USD Million) & Volume (Unit) Trend Analysis By Market Taxonomy, 2021 to 2025
- Market Size Value (USD Million) & Volume (Unit) Forecast By Market Taxonomy, 2026 to 2036
- By Country
- Kingdom of Saudi Arabia
- Other GCC Countries
- Türkiye
- South Africa
- Other African Union
- Rest of Middle East & Africa
- By Filter Type
- By Drive Rating
- By Installation
- By Application
- By Sales Channel
- By Country
- Market Attractiveness Analysis
- By Country
- By Filter Type
- By Drive Rating
- By Installation
- By Application
- By Sales Channel
- Key Takeaways
- Key Countries Market Analysis
- USA
- Pricing Analysis
- Market Share Analysis, 2025
- By Filter Type
- By Drive Rating
- By Installation
- By Application
- By Sales Channel
- Canada
- Pricing Analysis
- Market Share Analysis, 2025
- By Filter Type
- By Drive Rating
- By Installation
- By Application
- By Sales Channel
- Mexico
- Pricing Analysis
- Market Share Analysis, 2025
- By Filter Type
- By Drive Rating
- By Installation
- By Application
- By Sales Channel
- Brazil
- Pricing Analysis
- Market Share Analysis, 2025
- By Filter Type
- By Drive Rating
- By Installation
- By Application
- By Sales Channel
- Chile
- Pricing Analysis
- Market Share Analysis, 2025
- By Filter Type
- By Drive Rating
- By Installation
- By Application
- By Sales Channel
- Germany
- Pricing Analysis
- Market Share Analysis, 2025
- By Filter Type
- By Drive Rating
- By Installation
- By Application
- By Sales Channel
- UK
- Pricing Analysis
- Market Share Analysis, 2025
- By Filter Type
- By Drive Rating
- By Installation
- By Application
- By Sales Channel
- Italy
- Pricing Analysis
- Market Share Analysis, 2025
- By Filter Type
- By Drive Rating
- By Installation
- By Application
- By Sales Channel
- Spain
- Pricing Analysis
- Market Share Analysis, 2025
- By Filter Type
- By Drive Rating
- By Installation
- By Application
- By Sales Channel
- France
- Pricing Analysis
- Market Share Analysis, 2025
- By Filter Type
- By Drive Rating
- By Installation
- By Application
- By Sales Channel
- India
- Pricing Analysis
- Market Share Analysis, 2025
- By Filter Type
- By Drive Rating
- By Installation
- By Application
- By Sales Channel
- ASEAN
- Pricing Analysis
- Market Share Analysis, 2025
- By Filter Type
- By Drive Rating
- By Installation
- By Application
- By Sales Channel
- Australia & New Zealand
- Pricing Analysis
- Market Share Analysis, 2025
- By Filter Type
- By Drive Rating
- By Installation
- By Application
- By Sales Channel
- China
- Pricing Analysis
- Market Share Analysis, 2025
- By Filter Type
- By Drive Rating
- By Installation
- By Application
- By Sales Channel
- Japan
- Pricing Analysis
- Market Share Analysis, 2025
- By Filter Type
- By Drive Rating
- By Installation
- By Application
- By Sales Channel
- South Korea
- Pricing Analysis
- Market Share Analysis, 2025
- By Filter Type
- By Drive Rating
- By Installation
- By Application
- By Sales Channel
- Russia
- Pricing Analysis
- Market Share Analysis, 2025
- By Filter Type
- By Drive Rating
- By Installation
- By Application
- By Sales Channel
- Poland
- Pricing Analysis
- Market Share Analysis, 2025
- By Filter Type
- By Drive Rating
- By Installation
- By Application
- By Sales Channel
- Hungary
- Pricing Analysis
- Market Share Analysis, 2025
- By Filter Type
- By Drive Rating
- By Installation
- By Application
- By Sales Channel
- Kingdom of Saudi Arabia
- Pricing Analysis
- Market Share Analysis, 2025
- By Filter Type
- By Drive Rating
- By Installation
- By Application
- By Sales Channel
- Türkiye
- Pricing Analysis
- Market Share Analysis, 2025
- By Filter Type
- By Drive Rating
- By Installation
- By Application
- By Sales Channel
- South Africa
- Pricing Analysis
- Market Share Analysis, 2025
- By Filter Type
- By Drive Rating
- By Installation
- By Application
- By Sales Channel
- USA
- Market Structure Analysis
- Competition Dashboard
- Competition Benchmarking
- Market Share Analysis of Top Players
- By Regional
- By Filter Type
- By Drive Rating
- By Installation
- By Application
- By Sales Channel
- Emerging Startups
- Innovation Benchmarking
- Competition Analysis
- Competition Deep Dive
- Schaffner
- Overview
- Product Portfolio
- Profitability by Market Segments (Product/Region/Sales Channel)
- Sales Footprint
- Strategy Overview
- Marketing Strategy
- Product Strategy
- Channel Strategy
- TDK
- Eaton
- MTE Corporation
- KEMET / YAGEO
- Danfoss
- TE Connectivity
- Siemens
- ABB
- REO
- Schaffner
- Case Studies
- Success Stories
- Recent Developments
- Competition Deep Dive
- Assumptions & Acronyms Used


