

- Market Size (2026)
- USD 2.7 Bn
- Forecast (2036)
- USD 4.9 Bn
- CAGR (2026 to 2036)
- 6.4%
How big is the Duplication Disc Market in 2026?
USD 2.7 billion in 2026, reaching USD 4.9 billion by 2036 at a 6.4% CAGR
The duplication disc market is estimated at USD 2.7 billion in 2026 and is forecast to reach USD 4.9 billion by 2036 at a 6.4% CAGR. Demand is shaped by media and entertainment companies producing physical media for movies, games, and archival distribution. Printed Disc accounts for 63.0% of Disc Type demand in 2026, while Inkjet Printing holds 49.0% of printing technology.
The market was valued at USD 2.5 billion in 2025. Growth reflects continued demand for physical media in collector, archival, and distribution segments alongside on-demand duplication services. Demand is shaped by media companies and data-archival users who require durable, printed physical discs for content distribution and long-term storage.
Disc duplication is shifting toward printed, on-demand physical media for movies, games, and archival use. Buyers judge services through print quality and turnaround.
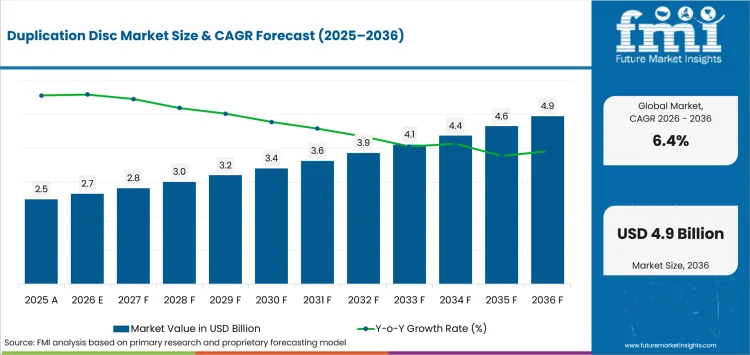
| Metric | Value |
|---|---|
| 2025 Market Size | USD 2.5 billion |
| 2026 Market Size | USD 2.7 billion |
| 2036 Market Size | USD 4.9 billion |
| Forecast CAGR (2026-2036) | 6.4% |
| Disc Type Focus | Printed Disc |
| Printed Disc Share (2026) | 63.0% |
| Printing Technology Focus | Inkjet Printing |
| Inkjet Printing Share (2026) | 49.0% |
| Key Countries | USA, Germany, France, UK |
Summary of the Duplication Disc Market
| Market Signal | Commercial Impact |
|---|---|
| Demand and Growth Drivers | Demand comes from entertainment distribution and archival storage, supported by on-demand, short-run duplication.
|
| Product and Segment View | Printed discs and inkjet printing lead the mix, with movies and games the largest application.
|
| Geography and Competitive Outlook | South Korea leads growth on media and OEM duplication capacity, while system makers compete on throughput and print fidelity.
|
| Analyst Opinion | Providers combining high-fidelity inkjet printing with fast on-demand turnaround will lead as physical media concentrates in entertainment and archival use.
|
Why is the Duplication Disc Market growing?
Rising Printed Disc and Inkjet Printing demand in movies, games, and archival distribution
- Sustained procurement of printed disc duplication is shaped by media and entertainment companies distributing movies and games on physical media.
- South Korea is leading the way with growth of 7.6%, driven by media production, OEM duplication capacity, and on-demand printing demand.
- The printing segment is led by Inkjet Printing at 49.0% share, supported by short-run, full-color disc production for customized media.
Demand is rising because physical media retains a role in collector, archival, and distribution segments despite digital alternatives. Adoption is increasing due to on-demand duplication and inkjet printing, which support short-run, customized disc production for media companies and archival users requiring durable printed physical media.
How is the Duplication Disc Market segmented?
By Disc Type, Printing Technology, Application and End Use
- Printed disc is projected to lead Disc Type demand with 63.0% share in 2026 due to branded media distribution.
- Inkjet printing is expected to lead Printing Technology with 49.0% share in 2026 as it supports short-run color production.
- Movies and games are forecast to lead Application with 35.0% share in 2026 as entertainment drives physical media.
Why does Printed Disc lead the Duplication Disc Market?
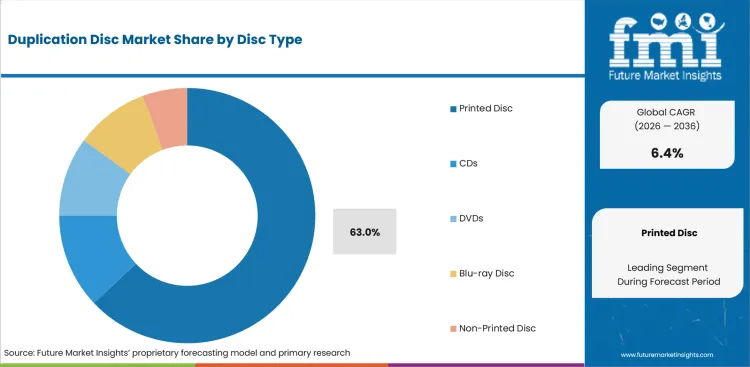
- Printed disc is expected to hold 63.0% share in 2026 because branded, durable physical media is required for distribution and collector segments.
- Full-color printing supports movie, game, and archival media that demand professional presentation.
Inkjet Printing holds 49.0% share, led by short-run color production
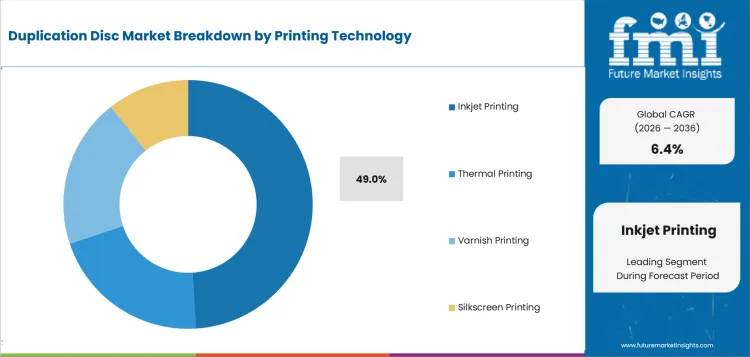
- Inkjet printing forms the leading technology at 49.0% share, anchored by full-color short-run production.
- Thermal and screen printing follow where high-volume or specialized finishes are required.
Which Application leads the market?
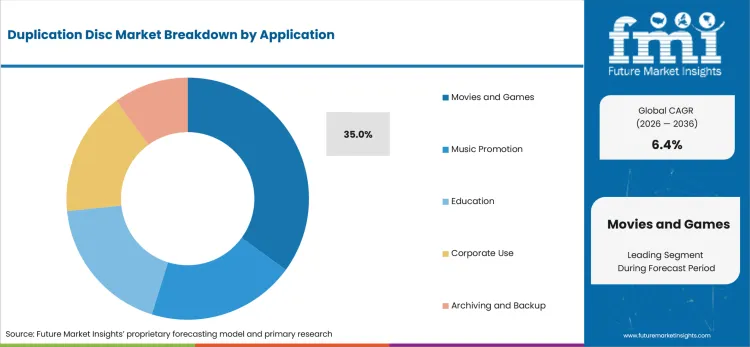
- Movies and games lead Application at 35.0% share as entertainment distribution drives physical media demand.
- Software, archival, and promotional uses follow as content distribution diversifies.
Which End Use leads procurement?
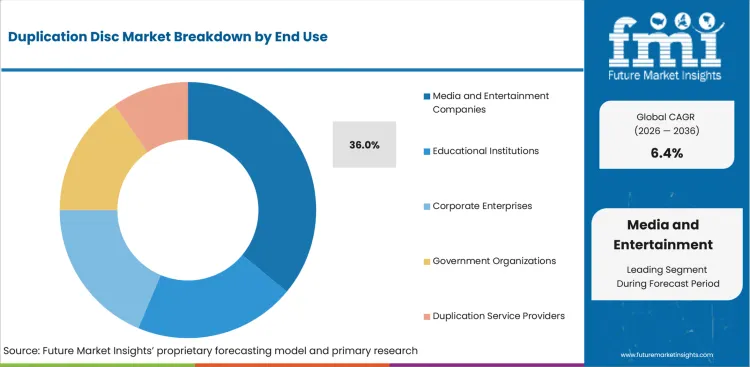
- Media and entertainment companies lead End Use at 36.0% share as they commission branded physical media.
- Archival, corporate, and educational users follow as physical distribution continues in specific segments.
What drives and restrains the Duplication Disc Market?
Driven by movie and game distribution and on-demand printing,restrained by digital substitution and volume decline
Physical media demand in entertainment and archival segments supports adoption, while digital streaming substitution and declining mass-volume duplication limit overall growth.
- Driver: Media and entertainment companies commission printed disc duplication for movie and game distribution, generating demand for inkjet printing that supports branded, durable physical media.
- Restraint: Digital streaming and download substitution erode mass-volume duplication, concentrating demand in collector, archival, and specialized distribution segments that limit broad volume growth.
- Opportunity: On-demand and short-run inkjet duplication can widen adoption by serving customized, collector, and archival media that digital channels do not address.
Physical media demand is sustaining duplication as media companies distribute movies and games on printed discs. Printed disc duplication anchors demand while inkjet printing supports short-run, customized production.
The market is led by structural demand from media and entertainment companies. Printed disc remains the leading type, while unprinted discs serve bulk uses. Constraints include digital substitution, declining mass-volume duplication, and competition from cloud distribution.
Which factors support expansion in the Duplication Disc Market?
On-demand duplication and printed media procurement support market value across media and archival channels
- Market value is supported by on-demand printed duplication before bulk-volume services add secondary revenue.
- Provider pricing reflects print fidelity and turnaround before throughput affects renewal demand.
- Media buyers compare print quality and turnaround before committing to a duplication provider.
Which countries are growing fastest in the Duplication Disc Market?
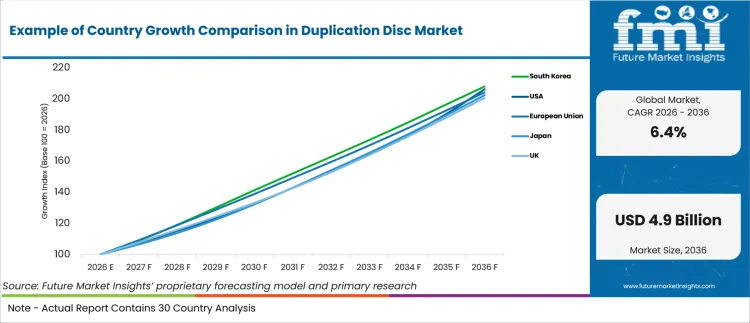
| Country | CAGR |
|---|---|
| South Korea | 7.6% |
| USA | 7.5% |
| European Union | 7.4% |
| Japan | 7.3% |
| UK | 7.2% |
Source: Future Market Insights analysis, 2026.
How do country-level CAGRs compare in the Duplication Disc Market?
The global duplication disc market is projected to expand at 6.4% from 2026 to 2036. The study covers more than 30 countries, and the primary markets are listed below.
- South Korea is forecast to record 7.6% CAGR by 2036 as media production and OEM duplication capacity expand.
- The USA is expected to expand at 7.5% CAGR through 2036 as entertainment and archival demand sustain volume.
- The European Union is estimated to grow at 7.4% CAGR by 2036 as media distribution and archival use continue.
- Japan is projected to rise at 7.3% CAGR through 2036 as collector and entertainment media demand persists.
- The UK is forecast to post 7.2% CAGR by 2036 as media production and archival distribution support demand.
Who are the leading companies in the Duplication Disc Market?
Rimage, Primera Technology, Microboards Technology, Epson, and Vinpower Digital
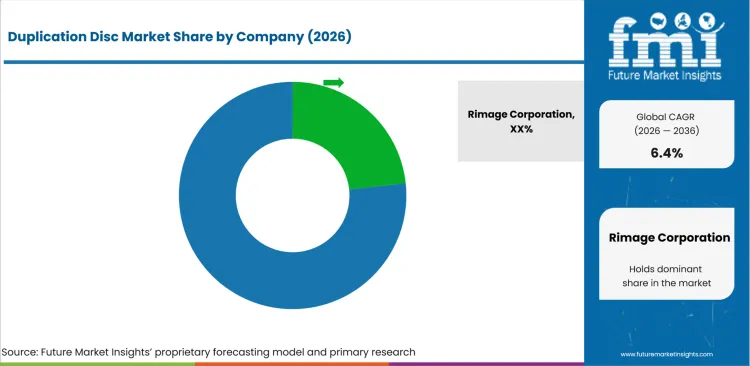
Rimage and Primera Technology compete through duplication system throughput and print fidelity. Service support remains a further point of differentiation. Microboards Technology and Vinpower Digital compete on duplication hardware, while Epson holds positions in inkjet printing technology. These overlap with broader physical-media production and archival buying paths.
Buyers compare suppliers on print fidelity, throughput, and turnaround. Media companies standardize on systems that deliver branded print quality at production speed. Archival and on-demand users favor providers offering short-run inkjet duplication with reliable color reproduction.
Who are the key players in the Duplication Disc Market?
Key global companies leading the Duplication Disc Market include:
- Rimage, Primera Technology, and Microboards Technology maintain leading positions through duplication systems, print fidelity, and service support across global markets.
- Printing and hardware specialists such as Epson and Vinpower Digital compete through inkjet technology and duplication equipment.
- Specialist and emerging providers such as All Pro Solutions target on-demand and archival duplication to establish positions and scale.
How do top Duplication Disc Market companies compare?
Rimage and Primera lead on scale; Microboards also has a global footprint, while Epson and Vinpower are more technology-concentrated.
| Company | System Breadth | Print Fidelity | Throughput Scale | Geographic Footprint |
|---|---|---|---|---|
| Rimage Corporation | High | High | Strong | Global |
| Primera Technology | High | High | Strong | Global |
| Microboards Technology | Moderate | Moderate | Strong | Americas-led |
| Epson | Moderate | High | Strong | Global |
| Vinpower Digital | Moderate | Moderate | Moderate | Global |
Source: Future Market Insights competitive analysis, 2026.
Key Developments in the Duplication Disc Market
- In 2025, leading suppliers improved inkjet print fidelity for on-demand disc duplication.
- In 2025, manufacturers expanded short-run duplication systems for collector and archival media production.
Key Players in the Duplication Disc Market
Global Player
- Rimage Corporation
- Primera Technology
- Epson
Emerging Player
- Microboards Technology
- Vinpower Digital
Startup or Niche Player
- All Pro Solutions
- ADR (Alpha Digital Reproductions)
- Summation Technology
Duplication Disc Market - Scope & Definition
| Attribute | Detail |
|---|---|
| Market Definition | Optical disc duplication and printing systems and services used to produce printed and unprinted physical media for entertainment, archival, and distribution use |
| Functions Covered | Disc duplication, full-color printing, on-demand production, and archival media creation |
| Applications Covered | Movies and games, software distribution, archival storage, and promotional media |
| End-Use Industries | Media and entertainment companies, archival users, corporate, and educational users |
| Inclusions | Printed and unprinted disc duplication, inkjet and thermal printing systems, and on-demand duplication services |
| Exclusions | Digital content distribution, streaming services, and non-optical storage media |
Duplication Disc Market - Research Methodology
| Method | Description |
|---|---|
| Primary Research | FMI analysts gathered input from manufacturers, service providers, technology developers, distributors, end users, procurement teams, and subject-matter experts. Interviews examined purchasing decisions, product or service evaluation, adoption barriers, approval requirements, pricing considerations, and expectations for technical or commercial support. Respondents were also asked what evidence is required before a trial, pilot, or initial order develops into regular purchasing. |
| Desk Research | Desk research covered government statistics, regulatory publications, trade data, industry associations, technical literature, standards, company filings, product information, and official corporate announcements. Sources were reviewed for relevance, publication date, geographic coverage, and consistency with the defined market scope. Claims relating to performance, applications, approvals, capacity, investment, and commercial activity were retained only when supported by credible public evidence. |
| Market Sizing & Forecasting | The market model combined the baseline value with historical performance, segment structure, pricing and volume indicators, adoption levels, company participation, and country-level demand conditions. Forecast assumptions considered economic activity, investment trends, regulatory developments, technology adoption, purchasing cycles, supply availability, and barriers to wider market use. Segment and regional estimates were reconciled before the final market total was calculated. |
| Data Validation | Estimates were checked against multiple independent indicators, including public data, company activity, trade patterns, industry developments, and findings from primary interviews. Validation also tested whether products, services, applications, and company revenues fell within the defined market boundaries. Adjacent categories, unsupported claims, overlapping revenues, and activities without direct market relevance were excluded to reduce double counting and maintain consistency across segments and countries. |
What does the Duplication Disc Market report cover?
2021 to 2025 history and 2026 to 2036 forecasts across all segments and 30+ countries
| Parameter | Details |
|---|---|
| Forecast period | 2026 to 2036 |
| Historical period | 2021 to 2025 |
| Quantitative unit | Value in USD billion |
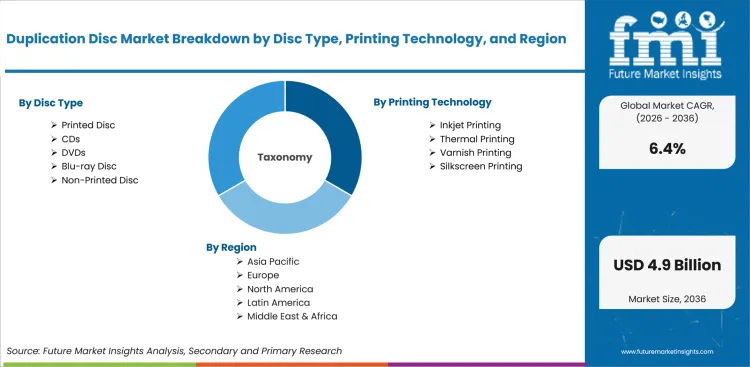
| By Disc type | Printed Disc, Unprinted Disc |
| By Printing technology | Inkjet Printing, Thermal Printing, Screen Printing |
| By Application | Movies and Games, Software, Archival, Promotional |
| By End use | Media and Entertainment Companies, Archival Users, Corporate, Educational |
| Regions covered | North America, Latin America, Western Europe, Eastern Europe, East Asia, South Asia and Pacific, Middle East and Africa |
| Countries covered | USA, South Korea, European Union, Japan, UK, and other major markets |
| Key companies profiled | Rimage, Primera Technology, Microboards Technology, Epson, Vinpower Digital, All Pro Solutions |
| Approach | Bottom-up volume-based approach using duplication output, printing mix, end-use demand, and supplier disclosures |
Market Segmentation Analysis
Duplication Disc Market Segmented by Disc Type:
- Printed Disc
- CDs
- DVDs
- Blu-ray Disc
- Non-Printed Disc
- Recordable Disc
- Write Once Media
- Rewritable Media
- Recordable Disc
Duplication Disc Market Segmented by Printing Technology:
- Inkjet Printing
- Photo Quality Inkjet
- High Speed Inkjet
- Thermal Printing
- Monochrome Thermal
- Color Thermal Retransfer
- Varnish Printing
- Gloss Coating
- Protective UV Coating
- Silkscreen Printing
- Single Color Screen Print
- Multi Color Screen Print
Duplication Disc Market Segmented by Application:
- Movies and Games
- Software Distribution
- Entertainment Media
- Music Promotion
- Album Distribution
- Demo Releases
- Education
- Training Materials
- Academic Content
- Corporate Use
- Marketing Materials
- Data Distribution
- Archiving and Backup
- Long Term Storage
- Document Backup
Duplication Disc Market Segmented by End Use:
- Media and Entertainment Companies
- Educational Institutions
- Corporate Enterprises
- Government Organizations
- Duplication Service Providers
Duplication Disc Market by Region:
- North America
- USA
- Canada
- Mexico
- Latin America
- Brazil
- Chile
- Rest of Latin America
- Western Europe
- Germany
- UK
- Italy
- Spain
- France
- Nordic
- BENELUX
- Rest of Western Europe
- Eastern Europe
- Russia
- Poland
- Hungary
- Balkan & Baltic
- Rest of Eastern Europe
- East Asia
- China
- Japan
- South Korea
- South Asia and Pacific
- India
- ASEAN
- Australia & New Zealand
- Rest of South Asia and Pacific
- Middle East & Africa
- Kingdom of Saudi Arabia
- Other GCC Countries
- Türkiye
- South Africa
- Other African Union
- Rest of Middle East & Africa
Research Sources and Bibliography
- International Organization for Standardization. (2025, October). Standards for optical media and disc duplication quality.
- Organisation for Economic Co-operation and Development. (2025, November). Media and content industry indicators.
- USA Library of Congress. (2025, December). Digital and physical media preservation guidance.
- European Commission. (2025, December 8). Data retention and archival media practices.
- Korea Creative Content Agency. (2025, September). Content industry production and distribution report.
- Epson. (2026, February). 2025 annual report and printing technology overview.
- Rimage Corporation. (2026, January). 2025 duplication systems business update.
This bibliography is provided for reader reference and is not exhaustive.
This Report Answers
- Market size estimates for 2026 and forecasts through 2036 for the Duplication Disc Market.
- Analysis of disc-type demand across printed and unprinted discs with printing technologies.
- Country-level growth analysis covering South Korea and the USA with European Union, Japan and UK outlooks.
- Evaluation of company positioning across Rimage and Primera Technology with Microboards, Epson and Vinpower Digital.
- Assessment of drivers and restraints with procurement patterns across media and archival channels.
Frequently Asked Questions
What is the growth prospect for the Duplication Disc Market?
Demand is projected to grow as physical media remains relevant across film, gaming, and archival distribution despite digital substitution.
Which companies are expected to shape the Duplication Disc Market?
Rimage and Primera Technology are positioned to lead the competitive landscape, alongside Microboards, Epson, and Vinpower Digital.
Why does Printed Disc matter in this market?
Printed Disc accounts for the largest share of Disc Type demand, as branded, durable physical media is essential for distribution and collector segments.
How does digital substitution influence demand?
Streaming and downloads are eroding mass-volume duplication, concentrating demand in collector and archival segments.
Which printing technology is gaining attention?
Inkjet printing leads in short-run color production and is gaining prominence for on-demand, customized disc duplication.
Preview the report firsthand - request a free sample
Get SampleGet the brochure for pricing and purchase details.
Get PDFTable of Content
- Key Takeaways
- Market Size and CAGR
- Top Growth Driver
- Fastest Growing Segment
- Leading Region
- Key Companies
- Emerging Opportunities
- Executive Summary
- Global Market Outlook
- Demand-side Trends
- Supply-side Trends
- Technology Roadmap Analysis
- Analysis and Recommendations
- Analyst Perspective (What is happening? Why now? What should investors know?)
- Key Questions Answered
- How large is the market?
- What is the CAGR?
- What are key trends?
- Which region dominates?
- Who are the leaders?
- Market Overview
- Market Coverage / Taxonomy
- Market Definition / Scope / Limitations
- Research Methodology
- Chapter Orientation
- Analytical Lens and Working Hypotheses
- Market Structure, Signals, and Trend Drivers
- Benchmarking and Cross-market Comparability
- Market Sizing, Forecasting, and Opportunity Mapping
- Research Design and Evidence Framework
- Desk Research Programme (Secondary Evidence)
- Expert Input and Fieldwork (Primary Evidence)
- Tooling, Models, and Reference Databases
- Data Engineering and Model Build
- Quality Assurance and Audit Trail
- Market Background
- Market Dynamics (Drivers, Restraints, Opportunity, Trends)
- Scenario Forecast (Optimistic, Likely, Conservative)
- Impact Analysis
- AI Impact
- Sustainability Impact
- Regulatory Impact
- Technology Impact
- Consumer / Buyer Analysis
- Purchase Drivers
- Adoption Barriers
- Buyer Journey
- Opportunity Map Analysis
- Product Life Cycle Analysis
- Supply Chain Analysis
- Investment Feasibility Matrix
- Value Chain Analysis
- PESTLE and Porter's Analysis
- Regulatory Landscape
- Regional Parent Market Outlook
- Production and Consumption Statistics
- Import and Export Statistics
- Global Market Analysis and Forecast, 2021 to 2036
- Historical Market Size Value (USD Billion) Analysis, 2021 to 2025
- Current and Future Market Size Value (USD Billion) Projections, 2026 to 2036
- Y-o-Y Growth Trend Analysis
- Absolute $ Opportunity Analysis
- Global Market Pricing Analysis, 2021 to 2036
- Global Market Analysis and Forecast, By Disc Type, 2021 to 2036
- Introduction / Key Findings
- Historical Market Size Value (USD Billion) Analysis By Disc Type, 2021 to 2025
- Current and Future Market Size Value (USD Billion) Analysis and Forecast By Disc Type, 2026 to 2036
- Printed Disc
- CDs
- DVDs
- Blu-ray Disc
- Non-Printed Disc
- Recordable Disc
- Printed Disc
- Y-o-Y Growth Trend Analysis By Disc Type, 2021 to 2025
- Absolute $ Opportunity Analysis By Disc Type, 2026 to 2036
- Global Market Analysis and Forecast, By Printing Technology, 2021 to 2036
- Introduction / Key Findings
- Historical Market Size Value (USD Billion) Analysis By Printing Technology, 2021 to 2025
- Current and Future Market Size Value (USD Billion) Analysis and Forecast By Printing Technology, 2026 to 2036
- Inkjet Printing
- Thermal Printing
- Varnish Printing
- Silkscreen Printing
- Inkjet Printing
- Y-o-Y Growth Trend Analysis By Printing Technology, 2021 to 2025
- Absolute $ Opportunity Analysis By Printing Technology, 2026 to 2036
- Global Market Analysis and Forecast, By Application, 2021 to 2036
- Introduction / Key Findings
- Historical Market Size Value (USD Billion) Analysis By Application, 2021 to 2025
- Current and Future Market Size Value (USD Billion) Analysis and Forecast By Application, 2026 to 2036
- Movies and Games
- Music Promotion
- Education
- Corporate Use
- Archiving and Backup
- Movies and Games
- Y-o-Y Growth Trend Analysis By Application, 2021 to 2025
- Absolute $ Opportunity Analysis By Application, 2026 to 2036
- Global Market Analysis and Forecast, By End Use, 2021 to 2036
- Introduction / Key Findings
- Historical Market Size Value (USD Billion) Analysis By End Use, 2021 to 2025
- Current and Future Market Size Value (USD Billion) Analysis and Forecast By End Use, 2026 to 2036
- Media and Entertainment Companies
- Educational Institutions
- Corporate Enterprises
- Government Organizations
- Duplication Service Providers
- Media and Entertainment Companies
- Y-o-Y Growth Trend Analysis By End Use, 2021 to 2025
- Absolute $ Opportunity Analysis By End Use, 2026 to 2036
- Global Market Analysis and Forecast, By Region, 2021 to 2036
- Introduction
- Historical Market Size Value (USD Billion) Analysis By Region, 2021 to 2025
- Current Market Size Value (USD Billion) Analysis and Forecast By Region, 2026 to 2036
- North America
- Latin America
- Western Europe
- Eastern Europe
- East Asia
- South Asia and Pacific
- Middle East & Africa
- Market Attractiveness Analysis By Region
- North America Market Analysis and Forecast, By Country, 2021 to 2036
- Historical Market Size Value (USD Billion) Trend Analysis By Market Taxonomy, 2021 to 2025
- Market Size Value (USD Billion) Forecast By Market Taxonomy, 2026 to 2036
- By Country
- USA
- Canada
- By Disc Type
- By Printing Technology
- By Application
- By End Use
- By Country
- Market Attractiveness Analysis
- By Country
- By Disc Type
- By Printing Technology
- By Application
- By End Use
- Key Takeaways
- Latin America Market Analysis and Forecast, By Country
- Historical Market Size Value (USD Billion) Trend Analysis By Market Taxonomy, 2021 to 2025
- Market Size Value (USD Billion) Forecast By Market Taxonomy, 2026 to 2036
- By Country
- Brazil
- Mexico
- Chile
- Rest of Latin America
- By Disc Type
- By Printing Technology
- By Application
- By End Use
- By Country
- Market Attractiveness Analysis
- By Country
- By Disc Type
- By Printing Technology
- By Application
- By End Use
- Key Takeaways
- Western Europe Market Analysis and Forecast, By Country
- Historical Market Size Value (USD Billion) Trend Analysis By Market Taxonomy, 2021 to 2025
- Market Size Value (USD Billion) Forecast By Market Taxonomy, 2026 to 2036
- By Country
- Germany
- UK
- Italy
- Spain
- France
- Nordic
- BENELUX
- Rest of Western Europe
- By Disc Type
- By Printing Technology
- By Application
- By End Use
- By Country
- Market Attractiveness Analysis
- By Country
- By Disc Type
- By Printing Technology
- By Application
- By End Use
- Key Takeaways
- Eastern Europe Market Analysis and Forecast, By Country
- Historical Market Size Value (USD Billion) Trend Analysis By Market Taxonomy, 2021 to 2025
- Market Size Value (USD Billion) Forecast By Market Taxonomy, 2026 to 2036
- By Country
- Russia
- Poland
- Hungary
- Balkan & Baltic
- Rest of Eastern Europe
- By Disc Type
- By Printing Technology
- By Application
- By End Use
- By Country
- Market Attractiveness Analysis
- By Country
- By Disc Type
- By Printing Technology
- By Application
- By End Use
- Key Takeaways
- East Asia Market Analysis and Forecast, By Country
- Historical Market Size Value (USD Billion) Trend Analysis By Market Taxonomy, 2021 to 2025
- Market Size Value (USD Billion) Forecast By Market Taxonomy, 2026 to 2036
- By Country
- China
- Japan
- South Korea
- By Disc Type
- By Printing Technology
- By Application
- By End Use
- By Country
- Market Attractiveness Analysis
- By Country
- By Disc Type
- By Printing Technology
- By Application
- By End Use
- Key Takeaways
- South Asia and Pacific Market Analysis and Forecast, By Country
- Historical Market Size Value (USD Billion) Trend Analysis By Market Taxonomy, 2021 to 2025
- Market Size Value (USD Billion) Forecast By Market Taxonomy, 2026 to 2036
- By Country
- India
- ASEAN
- Australia & New Zealand
- Rest of South Asia and Pacific
- By Disc Type
- By Printing Technology
- By Application
- By End Use
- By Country
- Market Attractiveness Analysis
- By Country
- By Disc Type
- By Printing Technology
- By Application
- By End Use
- Key Takeaways
- Middle East & Africa Market Analysis and Forecast, By Country
- Historical Market Size Value (USD Billion) Trend Analysis By Market Taxonomy, 2021 to 2025
- Market Size Value (USD Billion) Forecast By Market Taxonomy, 2026 to 2036
- By Country
- Kingdom of Saudi Arabia
- Other GCC Countries
- Türkiye
- South Africa
- Other African Union
- Rest of Middle East & Africa
- By Disc Type
- By Printing Technology
- By Application
- By End Use
- By Country
- Market Attractiveness Analysis
- By Country
- By Disc Type
- By Printing Technology
- By Application
- By End Use
- Key Takeaways
- Key Countries Market Analysis
- USA
- Pricing Analysis
- Market Share Analysis, 2025
- By Disc Type
- By Printing Technology
- By Application
- By End Use
- Canada
- Pricing Analysis
- Market Share Analysis, 2025
- By Disc Type
- By Printing Technology
- By Application
- By End Use
- Mexico
- Pricing Analysis
- Market Share Analysis, 2025
- By Disc Type
- By Printing Technology
- By Application
- By End Use
- Brazil
- Pricing Analysis
- Market Share Analysis, 2025
- By Disc Type
- By Printing Technology
- By Application
- By End Use
- Chile
- Pricing Analysis
- Market Share Analysis, 2025
- By Disc Type
- By Printing Technology
- By Application
- By End Use
- Germany
- Pricing Analysis
- Market Share Analysis, 2025
- By Disc Type
- By Printing Technology
- By Application
- By End Use
- UK
- Pricing Analysis
- Market Share Analysis, 2025
- By Disc Type
- By Printing Technology
- By Application
- By End Use
- Italy
- Pricing Analysis
- Market Share Analysis, 2025
- By Disc Type
- By Printing Technology
- By Application
- By End Use
- Spain
- Pricing Analysis
- Market Share Analysis, 2025
- By Disc Type
- By Printing Technology
- By Application
- By End Use
- France
- Pricing Analysis
- Market Share Analysis, 2025
- By Disc Type
- By Printing Technology
- By Application
- By End Use
- India
- Pricing Analysis
- Market Share Analysis, 2025
- By Disc Type
- By Printing Technology
- By Application
- By End Use
- ASEAN
- Pricing Analysis
- Market Share Analysis, 2025
- By Disc Type
- By Printing Technology
- By Application
- By End Use
- Australia & New Zealand
- Pricing Analysis
- Market Share Analysis, 2025
- By Disc Type
- By Printing Technology
- By Application
- By End Use
- China
- Pricing Analysis
- Market Share Analysis, 2025
- By Disc Type
- By Printing Technology
- By Application
- By End Use
- Japan
- Pricing Analysis
- Market Share Analysis, 2025
- By Disc Type
- By Printing Technology
- By Application
- By End Use
- South Korea
- Pricing Analysis
- Market Share Analysis, 2025
- By Disc Type
- By Printing Technology
- By Application
- By End Use
- Russia
- Pricing Analysis
- Market Share Analysis, 2025
- By Disc Type
- By Printing Technology
- By Application
- By End Use
- Poland
- Pricing Analysis
- Market Share Analysis, 2025
- By Disc Type
- By Printing Technology
- By Application
- By End Use
- Hungary
- Pricing Analysis
- Market Share Analysis, 2025
- By Disc Type
- By Printing Technology
- By Application
- By End Use
- Kingdom of Saudi Arabia
- Pricing Analysis
- Market Share Analysis, 2025
- By Disc Type
- By Printing Technology
- By Application
- By End Use
- Türkiye
- Pricing Analysis
- Market Share Analysis, 2025
- By Disc Type
- By Printing Technology
- By Application
- By End Use
- South Africa
- Pricing Analysis
- Market Share Analysis, 2025
- By Disc Type
- By Printing Technology
- By Application
- By End Use
- USA
- Market Structure Analysis
- Competition Dashboard
- Competition Benchmarking
- Market Share Analysis of Top Players
- By Regional
- By Disc Type
- By Printing Technology
- By Application
- By End Use
- Emerging Startups
- Innovation Benchmarking
- Competition Analysis
- Competition Deep Dive
- Rimage Corporation
- Overview
- Product Portfolio
- Profitability by Market Segments
- Sales Footprint
- Strategy Overview
- Marketing Strategy
- Product Strategy
- Channel Strategy
- Microboards Technology
- Primera Technology
- Vinpower Digital
- Epson
- All Pro Solutions
- TEAC Corporation.
- Acronova Technology
- Disc Makers
- Clover Systems
- Rimage Corporation
- Case Studies
- Success Stories
- Recent Developments
- Competition Deep Dive
- Assumptions & Acronyms Used


