

- Market Size (2026)
- USD 88.4 Bn
- Forecast (2036)
- USD 432.4 Bn
- CAGR (2026 to 2036)
- 17.2%
Educational Tourism Market Size, Market Forecast and Outlook By FMI
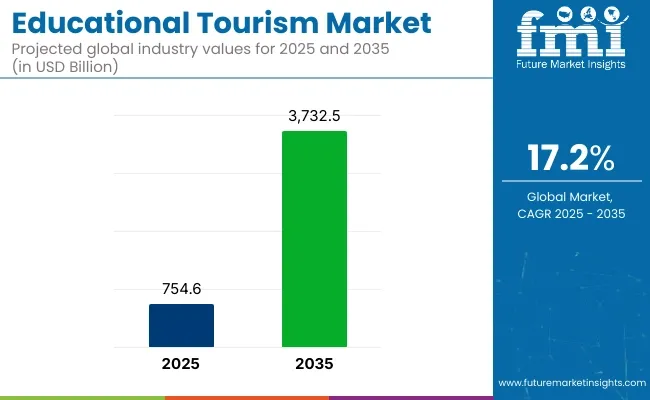
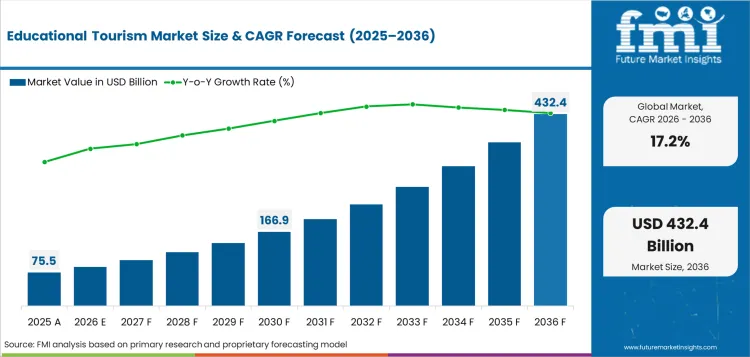
The educational tourism market was valued at USD 75.5 billion in 2025. the market is set to reach USD 88.4 billion by 2026-end and grow at a CAGR of 17.2% between 2026-2036 to reach USD 432.4 billion by 2036. Academic Programs will dominate with a 45.0% share.
Key Takeaways, Market Size, And Forecast
| Metric | Value |
|---|---|
| Market Size (2025) | USD 75.46 Billion |
| Market Size (2036) | USD 432.43 Billion |
| CAGR | 17.2% |
| Market Size (2026) | USD 344.00 Billion |
| Leading Service (2026) | Demand For Degree-Seeking Enrollment, Language Immersion Programs And Structured Academic Exchange Frameworks |
| Demand For Degree-Seeking Enrollment, Language Immersion Programs And Structured Academic Exchange Frameworks Share (2026) | 45% |
| Fastest-Growing Country | France |
| France CAGR | 23.2% |
| 2nd Fastest-Growing Country | Italy |
| Italy CAGR | 21.5% |
Summary of the Educational Tourism Market
- Demand and Growth Drivers
- The increase in international student mobility as students pursue academic programs, Language immersion and cultural experiences abroad is continuing to drive demand for educational tourism services.
- Government investment in international education exchange programs is forming structured demand channels with funding support and visa facilitation.
- The integration of digital learning with face-to-face cultural experiences is giving rise to hybrid forms of educational tourism, Thereby expanding the potential market.
- Product and Segment View
- The service segment is dominated by academic programs at 45.0%. This illustrates the importance of degree-seeking and semester-exchange enrolment in the spending of international educational tourism.
- Short-term programs are a fast-growing segment, Fuelled by demand for language workshops, Cultural immersion experiences and professional development courses.
- The most numerous category of participants is students. the main audience of educational tourism services is students of schools and universities.
- Geography and Competitive Outlook
- Leading the pack, France’s 23.2% CAGR reflects the country’s well-established academic institutions and cultural heritage assets, Alongside government-supported international education programs.
- Italy at 21.5% CAGR Italy is fueling demand owing to university exchange programs and growing experiential education offerings, Spurred by its rich cultural heritage.
- Companies with multi-destination program portfolios and proven university partnerships are well-positioned for enrollment growth in both academic and experiential segments.
- Analyst Opinion
- Companies that can provide integrated academic and cultural experiences in multiple locations while taking care of visa, accommodation and safety logistics are poised to take an increasing share of international student mobility demand.
- The market is moving beyond the traditional academic exchange to formats of experience and skills educational travel.
- Online pre-arrival and post-program engagement is becoming a competitive differentiator for educational tourism operators.
- The demand is driven by the growth in international student mobility around the world, Government scholarship programs and recognition of international education experience by employers.
Educational Tourism Market Definition
Educational tourism market includes travel services and programs for academic learning, Language immersion, Cultural exchange and professional development experiences abroad. the market scope includes academic programs, Language courses, Cultural immersion trips and professional development travel for students, Educators and professionals.
Educational Tourism Market Inclusions
Market scope includes all educational tourism services that are sold in the commercial market by service (academic programs, Language learning, Cultural immersion, Professional development), program length (short-term, Semester, Full academic year), type of participant (students, Professionals, Educators), Destination, booking channel, and accommodation type. Revenue sizing is based on forecast period 2026 to 2036.
Educational Tourism Market Exclusions
This does not cover domestic school field trips, Distance learning done entirely online, or corporate training done at facilities owned by the employer, Where there is no travel involved.
Educational Tourism Market Research Methodology
- Primary Research: FMI analysts reviewed education travel operators, universities, program providers, agencies, and destination partners across key markets.
- Desk Research: Aggregated data and filings from industry association, Regulator, Certification body and manufacturer.
- Market Sizing & Forecasting: Bottom-up aggregation based on service, program duration, type of participant, age group, mode of booking, type of accommodation, application segments, Regional adoption curves and cross-referencing with publicly available industry data.
- Data Validation: Quarterly checks on global production data, Trade statistics and manufacturer-reported figures.
Why is the Educational Tourism Market Growing?
- The international student mobility increase and the government scholarship programs form a structured demand for educational tourism services at several destinations.
- The market is expanding beyond traditional academic exchange programs to include experiential and skills-based educational travel formats.
- France is leading the growth at a CAGR of 23.2%, Owing to its established academic institutions and strong cultural heritage tourism position.
The market for educational tourism is growing fast, with the rise in international student mobility and diversification of educational travel options beyond traditional academic exchange. Government scholarship programs, University partnership networks and employer recognition of international education experience are structural demand drivers. growth is a symptom of the intersection of academic, Cultural, and professional development motivations in educational travel choices.
45.0% leads in academic programs due to the concentration of spending in degree-seeking and semester-exchange enrollment. Short-term programs are the fastest-growing segment, Fueled by demand for language workshops and cultural immersion experiences that serve students and professionals alike. the market structure consists of a mix of specialist educational travel operators, University partnership organizations and tourism companies moving into educational offerings.
Market Segmentation Analysis
- Academic Programs leads the service segment with 45% market share, reflecting established supply and end-use preference.
- Short Term Programs holds the leading position in the program duration category.
- Students accounts for the largest share in the participant type segment.
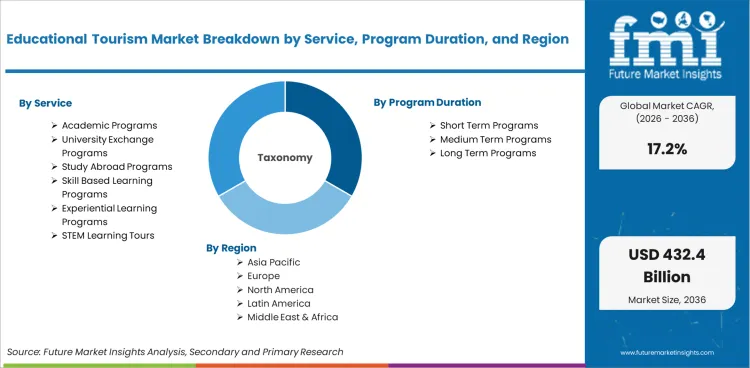
The educational tourism market is segmented by service, program duration, participant type, age group, booking mode, accommodation type, application. Each segment reflects distinct procurement criteria, end-use requirements, and pricing structures.
Insights into the Service Segment
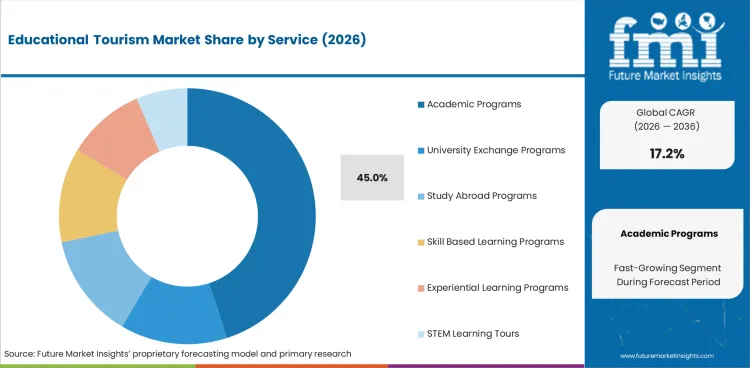
The leader in the services segment is Academic Programs with 45%. It is the well established end use compatibility, Supply chain availability and cost competitiveness relative to other options that drives demand.
Other service categories are language learning programs, English language programs and foreign language immersion, Each of which serves specific application requirements and reflects the diversity of technical specifications across end-use industries.
Insights into the Program Duration Segment
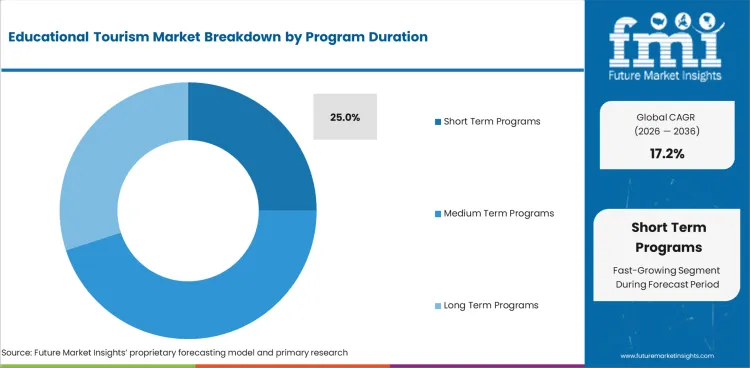
Short Term Programs is the leading player in the program duration segment. Demand is driven by compatibility with end uses, Availability in the supply chain, and cost-competitiveness with alternatives.
Other program duration categories include Up To 2 Weeks, Workshops, Camps, Each serving specific application requirements and reflecting technical specification diversity across end-use industries.
Educational Tourism Market Drivers, Restraints, and Opportunities
- A constant demand for services related to educational tourism is being generated by the growth of international student mobility and government education exchange programs.
- Enrollment volatility and destination-switching behaviors among international students are driven by the complexity of visa processing and geopolitical uncertainty.
- Experiential and hybrid learning formats are broadening the market beyond the traditional academic exchange programs.
The educational tourism market is growing, Due to regulatory factors, Limitations in cost structure, and new application prospects. the pace of adoption differs by segment, Geography and price sensitivity of end-use applications.
Student Mobility Growth
The global increase in international student enrollment, Supported by government scholarship programs and university internationalization strategies, is creating structured demand for educational tourism services. Each enrolled international student generates spending across tuition, accommodation, Cultural activities, and travel.
Visa and Geopolitical Risk
Visa processing delays, policy changes and geopolitical tensions cause uncertainty in enrollment and destination switching behavior. Those with multi-destination portfolios are better placed to manage this volatility and educational tourism operators are no exception.
Experiential Education Expansion
The educational tourism market is expanding beyond the traditional academic exchange, with a growing demand for skills-based, Cultural immersion and professional development travel. Short-term programs are able to attract a wider variety of participants, Such as people WHO are working or students WHO are taking a gap year.
Analysis of Educational Tourism Market By Key Countries
.webp "Top Country Growth Comparison Educational Tourism Market Cagr (2026 2036)")
| Country | CAGR |
|---|---|
| France | 23.2% |
| Italy | 21.5% |
| Spain | 19.8% |
| Germany | 14.6% |
| USA | 12.9% |
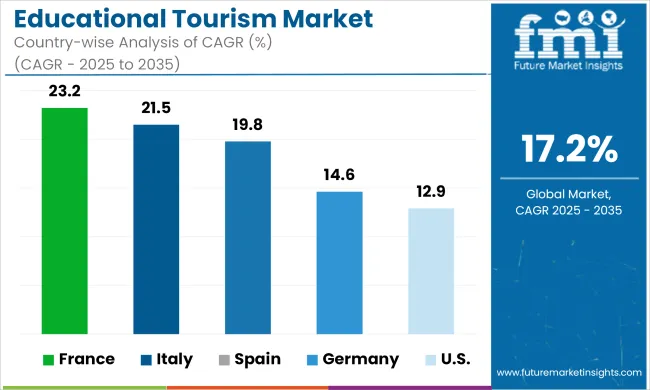
- France leads with a 23.2% CAGR, reflecting established institutional frameworks.
- Italy at 21.5% shows strong demand due to rich cultural heritage.
- Spain (19.8%) and Germany (14.6%) continue growing, Supported by end-use industry expansion.
The global educational tourism market is expected to grow at a rate of 17.2% per year from 2026 to 2036. the study covers more than 30 countries, and the main markets are listed below.
Demand Outlook for Educational Tourism Market in France
France should grow at a rate of 23.2% through 2036 due to established institutional frameworks, Cultural heritage assets, and strong international connectivity. Demand is supported by established academic institutions, Cultural tourism assets and government-supported international education programs.
- Established academic institutions are attracting growing international student enrollment.
- Government-supported education exchange programs are expanding program availability.
- Cultural tourism assets are creating unique positioning for experiential learning programs.
Future Outlook for Educational Tourism Market in Italy
Italy is projected to grow at a rate of 21.5% through 2036, reflecting rich cultural heritage, established tourism infrastructure, and growing international student exchange programs. Demand is supported by cultural heritage tourism infrastructure, University exchange programs, and growing demand for experiential education.
- Rich cultural heritage and historical sites create strong demand for experiential education tourism.
- University exchange programs are expanding international student intake capacity.
- Government investment in cultural preservation supports educational tourism infrastructure.
Opportunity Analysis of Educational Tourism Market in Spain
Spain is projected to grow at a rate of 19.8% through 2036, reflecting expanding domestic demand and regulatory development. Demand is supported by study abroad programs, language learning travel, university exchange activity, and cultural immersion programs.
- End-use industry expansion is driving procurement volume growth.
- Regulatory development is shaping product specifications and compliance requirements.
- Domestic demand growth is creating opportunities for market entry and expansion.
In-depth Analysis of Educational Tourism Market in Germany
Germany is projected to grow at a rate of 14.6% through 2036, reflecting strong industrial base, EU regulatory compliance, and advanced engineering capabilities. Demand is supported by university exchange programs, language learning, research mobility, and cultural learning travel.
- Engineering-LED procurement is sustaining demand for precision-grade products and equipment.
- Industrial automation investment is expanding the addressable market for advanced solutions.
- EU regulatory compliance is accelerating adoption of updated specifications and standards.
Sales Analysis of Educational Tourism Market in USA
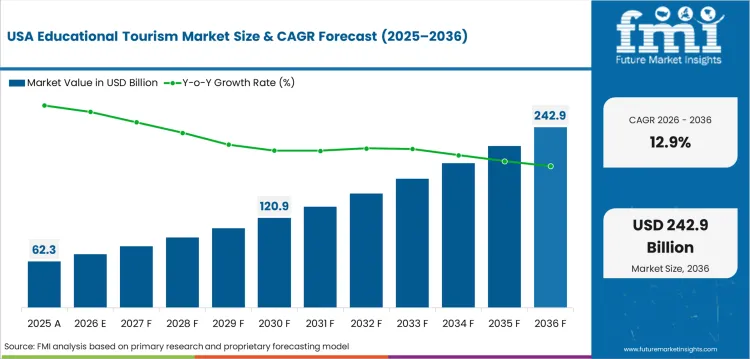
USA is projected to grow at a rate of 12.9% through 2036, reflecting university exchange activity, international student mobility, and demand for structured academic travel programs. Demand is supported by compliance-driven procurement, established distribution networks, and premium product demand.
- Compliance-LED procurement is sustaining demand for products meeting regulatory specifications.
- Established distribution networks support efficient supply chain coverage across end-use sectors.
- Premium product demand is creating value-added procurement channels alongside volume purchasing.
Competitive Landscape and Strategic Positioning
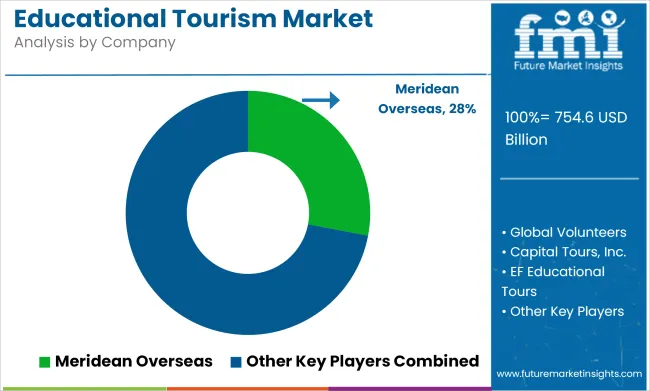
- Meridean Overseas holds a visible position through overseas education counseling, student mobility services, and destination support capabilities.
- EF Education First and CIEE (Council on International Educational Exchange) maintain competitive positions through product breadth and regional distribution capabilities.
- Smaller and emerging players are focusing on specialized applications and niche segments to build market position.
Meridean Overseas is a leading participant owing to broad manufacturing capacity and established relationships with end-use customers across multiple geographies. EF Education First competes through product portfolio breadth and distribution reach.
CIEE (Council on International Educational Exchange) and WorldStrides maintain competitive positions in specific product categories and regional markets. Barriers to entry include manufacturing scale requirements, regulatory certification timelines, and established procurement relationships.
Strategic priorities include cost optimization, Geographic expansion, product specification upgrades, and alignment with regulatory compliance timelines.
Key Companies in the Educational Tourism Market
Key global companies leading the educational tourism market include:
- Meridean Overseas, EF Education First, CIEE (Council on International Educational Exchange) hold leading positions through established infrastructure and strong customer relationships.
- WorldStrides and Kaplan International maintain competitive positions through regional expertise and product specialization.
- Study Group, American Institute For Foreign Study (AIFS), Road Scholar represent emerging participants with growth potential in specialized segments.
Competitive Benchmarking: Educational Tourism Market
| Company | Destination Portfolio | University Partnerships | Program Diversity | Geographic Reach |
|---|---|---|---|---|
| Meridean Overseas | High | Strong | Strong | Global |
| EF Education First | High | Strong | Strong | Global |
| CIEE (Council on International Educational Exchange) | High | Strong | Strong | Global |
| WorldStrides | Medium | Moderate | Moderate | Regional |
| Kaplan International | Medium | Moderate | Moderate | Regional |
| Study Group | Medium | Moderate | Moderate | Regional |
| American Institute For Foreign Study (AIFS) | Medium | Moderate | Moderate | Regional |
| Road Scholar | Medium | Moderate | Moderate | Regional |
Source: Future Market Insights competitive analysis, 2026.
Key Developments in Educational Tourism Market
- In January 2025, Canada capped study permits for 2025 at 437,000, down 10% year over year, while extending the cap to graduate students. For 2026, the target was reduced to 408,000, with new admissions expected to decline by approximately 50%, although master's and PhD students at public Designated Learning Institutions (DLIs) remained exempt. During the first half of 2025, the study permit approval rate fell to approximately 30%, compared with 51% a year earlier.
- Australia announced plans to cap new international student commencements at 270,000 for 2025 as part of its efforts to manage international student intake.
Key Players in the Educational Tourism Market
Major Global Players
- Meridean Overseas
- EF Education First
- CIEE (Council on International Educational Exchange)
- WorldStrides
- Kaplan International
Emerging Players/Startups
- Study Group
- American Institute For Foreign Study (AIFS)
- Road Scholar
- Explorica
- Academic Programs International (API)
Report Scope and Coverage
| Metric | Value |
|---|---|
| Quantitative Units | USD 88.44 billion to USD 432.43 billion, at a CAGR of 17.2% |
| Market Definition | The educational tourism market encompasses products categorized by service, program duration, participant type, age group, booking mode, accommodation type, application across all major end-use applications. |
| Regions Covered | North America, Latin America, Europe, East Asia, South Asia and Pacific, Middle East and Africa |
| Countries Covered | France, Italy, Spain, Germany, USA, 30 plus countries |
| Key Companies Profiled | Meridean Overseas, EF Education First, CIEE (Council on International Educational Exchange), WorldStrides, Kaplan International, Study Group, American Institute For Foreign Study (AIFS) |
| Forecast Period | 2026 to 2036 |
| Approach | Hybrid bottom-up and top-down methodology starting with verified transaction data, Projecting adoption velocity across segments and regions. |
Market Segmentation Analysis
Educational Tourism Market Segmented by Service:
- Academic Programs
- Language Learning Programs
- English Language Programs
- Foreign Language Immersion
- Language Learning Programs
- University Exchange Programs
-
- Semester Exchange
- Short Term Exchange
-
- Study Abroad Programs
-
- Degree Programs
- Certification Courses
-
- Skill Based Learning Programs
- Vocational Training
- Technical Skills
- Professional Courses
- Vocational Training
- Experiential Learning Programs
- Cultural Exchange Programs
- Heritage Learning
- Local Immersion
- Cultural Exchange Programs
- STEM Learning Tours
-
- Science Tours
- Technology Workshops
-
Educational Tourism Market Segmented by Program Duration:
- Short Term Programs
- Up To 2 Weeks
- Workshops
- Camps
- Up To 2 Weeks
- Medium Term Programs
- 2 Weeks To 6 Months
- Certification Courses
- Exchange Programs
- 2 Weeks To 6 Months
- Long Term Programs
- Above 6 Months
- Degree Programs
- Full Academic Courses
- Above 6 Months
Educational Tourism Market Segmented by Participant Type:
- Students
- School Students
- Primary Education
- Secondary Education
- School Students
- University Students
-
- Undergraduate
- Postgraduate
-
- Professionals
- Skill Development
- Executive Programs
- Corporate Training
- Skill Development
- Lifelong Learners
- Adult Education
- Hobby Learning
- Cultural Programs
- Adult Education
Educational Tourism Market Segmented by Age Group:
- Below 18 Years
- School Level
- Junior Programs
- Summer Camps
- School Level
- 18 To 25 Years
- University Level
- Exchange Programs
- Degree Programs
- University Level
- 26 To 40 Years
- Professional Level
- Skill Development
- Career Enhancement
- Professional Level
- Above 40 Years
- Lifelong Learning
- Cultural Tourism
- Personal Enrichment
- Lifelong Learning
Educational Tourism Market Segmented by Booking Mode:
- Direct Booking
- Institution Booking
- University Partnerships
- School Tie Ups
- Institution Booking
- Travel Agencies
- Education Travel Agencies
- Customized Programs
- Group Bookings
- Education Travel Agencies
- Online Platforms
- E Learning Platforms
- Course Booking
- Digital Enrollment
- E Learning Platforms
Educational Tourism Market Segmented by Accommodation Type:
- University Accommodation
- Dormitories
- On Campus Stay
- Shared Housing
- Dormitories
- Homestay
- Local Families
- Cultural Immersion
- Language Practice
- Local Families
- Hotels And Hostels
- Independent Stay
- Short Term Stay
- Budget Accommodation
- Independent Stay
Educational Tourism Market Segmented by Application:
- Language Learning
- English Learning
- Test Preparation
- Fluency Programs
- English Learning
- Higher Education
- Degree Programs
- Undergraduate Studies
- Postgraduate Studies
- Degree Programs
- Skill Development
- Technical Training
- Vocational Courses
- Professional Skills
- Technical Training
- Cultural Exchange
- International Exposure
- Heritage Learning
- Cultural Programs
- International Exposure
- Research And Training
- Field Research
- Academic Projects
- Internships
- Field Research
Educational Tourism Market by Region:
- North America
- USA
- Canada
- Mexico
- Latin America
- Brazil
- Chile
- Rest of Latin America
- Western Europe
- Germany
- UK
- Italy
- Spain
- France
- Nordic
- BENELUX
- Rest of Western Europe
- Eastern Europe
- Russia
- Poland
- Hungary
- Balkan & Baltic
- Rest of Eastern Europe
- East Asia
- China
- Japan
- South Korea
- South Asia and Pacific
- India
- ASEAN
- Australia & New Zealand
- Rest of South Asia and Pacific
- Middle East & Africa
- Kingdom of Saudi Arabia
- Other GCC Countries
- Turkiye
- South Africa
- Other African Union
- Rest of Middle East & Africa
Research Sources and Bibliography
- UNESCO Institute for Statistics. (2025). Global Education Mobility and International Student Enrollment Report. UNESCO.
- Organisation for Economic Co-operation and Development. (2024). Education at a Glance: International Student Mobility Trends. OECD.
- European Commission. (2024). Erasmus+ Programme Implementation and Impact Report. EC.
- World Tourism Organization. (2025). Cultural and Educational Tourism Market Report. UNWTO.
- Institute of International Education. (2025). Open Doors Report on International Educational Exchange. IIE.
This bibliography is provided for reader reference.
This Report Answers
- Estimating the size of the educational tourism market and revenue projections from 2026 to 2036.
- Segmentation by service, program duration, participant type, age group, booking mode, accommodation type, application.
- Insights across more than 30 country and regional markets.
- Analysis of key growth drivers, Restraints, and emerging opportunities.
- Assessment of the competitive landscape and strategic positioning.
- Identification of investment opportunities across primary application segments.
- Supply chain structure and distribution channel analysis.
- Delivery of data in PDF and Excel formats.
Frequently Asked Questions
What is the global market demand for Educational Tourism Market in 2026?
In 2026, the global educational tourism market is expected to be worth USD 88.44 billion.
How big will the Educational Tourism Market be in 2036?
By 2036, the educational tourism market is expected to be worth USD 432.43 billion.
How much is demand for Educational Tourism Market expected to grow between 2026 and 2036?
Between 2026 and 2036, the educational tourism market is expected to grow at a CAGR of 17.2%.
Which segment is likely to lead the Educational Tourism Market in 2026?
In the Educational Tourism Market, Academic Programs is expected to account for 45% of the service segment in 2026, reflecting strong downstream demand and established procurement patterns.
What is causing demand to rise in France for the Educational Tourism Market?
In the Educational Tourism Market, France is projected to grow at 23.2% through 2036, reflecting established institutional frameworks, Cultural heritage assets, and strong international connectivity.
What is causing demand to rise in Italy for the Educational Tourism Market?
In the Educational Tourism Market, Italy is projected to grow at 21.5% through 2036, reflecting rich cultural heritage, established tourism infrastructure, and growing international student exchange programs.
What is the definition of the Educational Tourism Market?
The educational tourism market encompasses products categorized by service, program duration, participant type, age group, booking mode, accommodation type, application across all major end-use applications.
How does FMI forecast and validate the Educational Tourism Market?
Forecasting models use a hybrid bottom-up and top-down approach, starting with verified transaction data and cross-referencing against global production statistics and manufacturer disclosures.
Preview the report firsthand - request a free sample
Get SampleGet the brochure for pricing and purchase details.
Get PDFTable of Content
- Executive Summary
- Global Market Outlook
- Demand-side Trends
- Supply-side Trends
- Technology Roadmap Analysis
- Analysis and Recommendations
- Market Overview
- Market Coverage / Taxonomy
- Market Definition / Scope / Limitations
- Research Methodology
- Chapter Orientation
- Analytical Lens and Working Hypotheses
- Market Structure, Signals, and Trend Drivers
- Benchmarking and Cross-market Comparability
- Market Sizing, Forecasting, and Opportunity Mapping
- Research Design and Evidence Framework
- Desk Research Programme (Secondary Evidence)
- Company Annual and Sustainability Reports
- Peer-reviewed Journals and Academic Literature
- Corporate Websites, product Literature, and Technical Notes
- Earnings Decks and Investor Briefings
- Statutory Filings and Regulatory Disclosures
- Technical White Papers and Standards Notes
- Trade Journals, Industry Magazines, and Analyst Briefs
- Conference Proceedings, Webinars, and Seminar Materials
- Government Statistics Portals and Public Data Releases
- Press Releases and Reputable Media Coverage
- Specialist Newsletters and Curated Briefings
- Sector Databases and Reference Repositories
- FMI Internal Proprietary Databases and Historical Market Datasets
- Subscription Datasets and Paid Sources
- Social Channels, Communities, and Digital Listening Inputs
- Additional Desk Sources
- Expert Input and Fieldwork (Primary Evidence)
- Primary Modes
- Qualitative Interviews and Expert Elicitation
- Quantitative Surveys and Structured Data Capture
- Blended Approach
- Why Primary Evidence is Used
- Field Techniques
- Interviews
- Surveys
- Focus Groups
- Observational and In-context Research
- Social and Community Interactions
- Stakeholder Universe Engaged
- C-suite Leaders
- Board Members
- Presidents and Vice Presidents
- R&D and Innovation Heads
- Technical Specialists
- Domain Subject-matter Experts
- Scientists
- Physicians and Other Healthcare Professionals
- Governance, Ethics, and Data Stewardship
- Research Ethics
- Data Integrity and Handling
- Primary Modes
- Tooling, Models, and Reference Databases
- Desk Research Programme (Secondary Evidence)
- Data Engineering and Model Build
- Data Acquisition and Ingestion
- Cleaning, Normalisation, and Verification
- Synthesis, Triangulation, and Analysis
- Quality Assurance and Audit Trail
- Market Background
- Market Dynamics
- Drivers
- Restraints
- Opportunity
- Trends
- Scenario Forecast
- Demand in Optimistic Scenario
- Demand in Likely Scenario
- Demand in Conservative Scenario
- Opportunity Map Analysis
- Product Life Cycle Analysis
- Supply Chain Analysis
- Investment Feasibility Matrix
- Value Chain Analysis
- PESTLE and Porter’s Analysis
- Regulatory Landscape
- Regional Parent Market Outlook
- Production and Consumption Statistics
- Import and Export Statistics
- Market Dynamics
- Global Market Analysis 2021 to 2025 and Forecast, 2026 to 2036
- Historical Market Size Value (USD Billion) Analysis, 2021 to 2025
- Current and Future Market Size Value (USD Billion) Projections, 2026 to 2036
- Y-o-Y Growth Trend Analysis
- Absolute $ Opportunity Analysis
- Global Market Pricing Analysis 2021 to 2025 and Forecast 2026 to 2036
- Global Market Analysis 2021 to 2025 and Forecast 2026 to 2036, by Service
- Introduction / Key Findings
- Historical Market Size Value (USD Billion) Analysis By Service , 2021 to 2025
- Current and Future Market Size Value (USD Billion) Analysis and Forecast By Service , 2026 to 2036
- Academic Programs
- Language Learning Programs
- English Language Programs
- Foreign Language Immersion
- University Exchange Programs
- Semester Exchange
- Short Term Exchange
- Study Abroad Programs
- Degree Programs
- Certification Courses
- Skill Based Learning Programs
- Vocational Training
- Technical Skills
- Professional Courses
- Experiential Learning Programs
- Cultural Exchange Programs
- Heritage Learning
- Local Immersion
- STEM Learning Tours
- Science Tours
- Technology Workshops
- Academic Programs
- Y-o-Y Growth Trend Analysis By Service , 2021 to 2025
- Absolute $ Opportunity Analysis By Service , 2026 to 2036
- Global Market Analysis 2021 to 2025 and Forecast 2026 to 2036, by Program Duration
- Introduction / Key Findings
- Historical Market Size Value (USD Billion) Analysis By Program Duration, 2021 to 2025
- Current and Future Market Size Value (USD Billion) Analysis and Forecast By Program Duration, 2026 to 2036
- Short Term Programs
- Up To 2 Weeks
- Workshops
- Camps
- Medium Term Programs
- 2 Weeks To 6 Months
- Certification Courses
- Exchange Programs
- Long Term Programs
- Above 6 Months
- Degree Programs
- Full Academic Courses
- Short Term Programs
- Y-o-Y Growth Trend Analysis By Program Duration, 2021 to 2025
- Absolute $ Opportunity Analysis By Program Duration, 2026 to 2036
- Global Market Analysis 2021 to 2025 and Forecast 2026 to 2036, by Participant Type
- Introduction / Key Findings
- Historical Market Size Value (USD Billion) Analysis By Participant Type, 2021 to 2025
- Current and Future Market Size Value (USD Billion) Analysis and Forecast By Participant Type, 2026 to 2036
- Students
- School Students
- Primary Education
- Secondary Education
- University Students
- Undergraduate
- Postgraduate
- Professionals
- Skill Development
- Executive Programs
- Corporate Training
- Lifelong Learners
- Adult Education
- Hobby Learning
- Cultural Programs
- Students
- Y-o-Y Growth Trend Analysis By Participant Type, 2021 to 2025
- Absolute $ Opportunity Analysis By Participant Type, 2026 to 2036
- Global Market Analysis 2021 to 2025 and Forecast 2026 to 2036, by Age Group
- Introduction / Key Findings
- Historical Market Size Value (USD Billion) Analysis By Age Group, 2021 to 2025
- Current and Future Market Size Value (USD Billion) Analysis and Forecast By Age Group, 2026 to 2036
- Below 18 Years
- School Level
- Junior Programs
- Summer Camps
- 18 To 25 Years
- University Level
- Exchange Programs
- Degree Programs
- 26 To 40 Years
- Professional Level
- Skill Development
- Career Enhancement
- Above 40 Years
- Lifelong Learning
- Cultural Tourism
- Personal Enrichment
- Below 18 Years
- Y-o-Y Growth Trend Analysis By Age Group, 2021 to 2025
- Absolute $ Opportunity Analysis By Age Group, 2026 to 2036
- Global Market Analysis 2021 to 2025 and Forecast 2026 to 2036, by Booking Mode
- Introduction / Key Findings
- Historical Market Size Value (USD Billion) Analysis By Booking Mode, 2021 to 2025
- Current and Future Market Size Value (USD Billion) Analysis and Forecast By Booking Mode, 2026 to 2036
- Direct Booking
- Institution Booking
- University Partnerships
- School Tie Ups
- Travel Agencies
- Education Travel Agencies
- Customized Programs
- Group Bookings
- Online Platforms
- E Learning Platforms
- Course Booking
- Digital Enrollment
- Direct Booking
- Y-o-Y Growth Trend Analysis By Booking Mode, 2021 to 2025
- Absolute $ Opportunity Analysis By Booking Mode, 2026 to 2036
- Global Market Analysis 2021 to 2025 and Forecast 2026 to 2036, by Accommodation Type
- Introduction / Key Findings
- Historical Market Size Value (USD Billion) Analysis By Accommodation Type, 2021 to 2025
- Current and Future Market Size Value (USD Billion) Analysis and Forecast By Accommodation Type, 2026 to 2036
- University Accommodation
- Dormitories
- On Campus Stay
- Shared Housing
- Homestay
- Local Families
- Cultural Immersion
- Language Practice
- Hotels And Hostels
- Independent Stay
- Short Term Stay
- Budget Accommodation
- University Accommodation
- Y-o-Y Growth Trend Analysis By Accommodation Type, 2021 to 2025
- Absolute $ Opportunity Analysis By Accommodation Type, 2026 to 2036
- Global Market Analysis 2021 to 2025 and Forecast 2026 to 2036, by Application
- Introduction / Key Findings
- Historical Market Size Value (USD Billion) Analysis By Application, 2021 to 2025
- Current and Future Market Size Value (USD Billion) Analysis and Forecast By Application, 2026 to 2036
- Language Learning
- English Learning
- Test Preparation
- Fluency Programs
- Higher Education
- Degree Programs
- Undergraduate Studies
- Postgraduate Studies
- Skill Development
- Technical Training
- Vocational Courses
- Professional Skills
- Cultural Exchange
- International Exposure
- Heritage Learning
- Cultural Programs
- Research And Training
- Field Research
- Academic Projects
- Internships
- Language Learning
- Y-o-Y Growth Trend Analysis By Application, 2021 to 2025
- Absolute $ Opportunity Analysis By Application, 2026 to 2036
- Global Market Analysis 2021 to 2025 and Forecast 2026 to 2036, by Region
- Introduction
- Historical Market Size Value (USD Billion) Analysis By Region, 2021 to 2025
- Current Market Size Value (USD Billion) Analysis and Forecast By Region, 2026 to 2036
- North America
- Latin America
- Western Europe
- Eastern Europe
- East Asia
- South Asia and Pacific
- Middle East & Africa
- Market Attractiveness Analysis By Region
- North America Market Analysis 2021 to 2025 and Forecast 2026 to 2036, by Country
- Historical Market Size Value (USD Billion) Trend Analysis By Market Taxonomy, 2021 to 2025
- Market Size Value (USD Billion) Forecast By Market Taxonomy, 2026 to 2036
- By Country
- USA
- Canada
- Mexico
- By Service
- By Program Duration
- By Participant Type
- By Age Group
- By Booking Mode
- By Accommodation Type
- By Application
- By Country
- Market Attractiveness Analysis
- By Country
- By Service
- By Program Duration
- By Participant Type
- By Age Group
- By Booking Mode
- By Accommodation Type
- By Application
- Key Takeaways
- Latin America Market Analysis 2021 to 2025 and Forecast 2026 to 2036, by Country
- Historical Market Size Value (USD Billion) Trend Analysis By Market Taxonomy, 2021 to 2025
- Market Size Value (USD Billion) Forecast By Market Taxonomy, 2026 to 2036
- By Country
- Brazil
- Chile
- Rest of Latin America
- By Service
- By Program Duration
- By Participant Type
- By Age Group
- By Booking Mode
- By Accommodation Type
- By Application
- By Country
- Market Attractiveness Analysis
- By Country
- By Service
- By Program Duration
- By Participant Type
- By Age Group
- By Booking Mode
- By Accommodation Type
- By Application
- Key Takeaways
- Western Europe Market Analysis 2021 to 2025 and Forecast 2026 to 2036, by Country
- Historical Market Size Value (USD Billion) Trend Analysis By Market Taxonomy, 2021 to 2025
- Market Size Value (USD Billion) Forecast By Market Taxonomy, 2026 to 2036
- By Country
- Germany
- UK
- Italy
- Spain
- France
- Nordic
- BENELUX
- Rest of Western Europe
- By Service
- By Program Duration
- By Participant Type
- By Age Group
- By Booking Mode
- By Accommodation Type
- By Application
- By Country
- Market Attractiveness Analysis
- By Country
- By Service
- By Program Duration
- By Participant Type
- By Age Group
- By Booking Mode
- By Accommodation Type
- By Application
- Key Takeaways
- Eastern Europe Market Analysis 2021 to 2025 and Forecast 2026 to 2036, by Country
- Historical Market Size Value (USD Billion) Trend Analysis By Market Taxonomy, 2021 to 2025
- Market Size Value (USD Billion) Forecast By Market Taxonomy, 2026 to 2036
- By Country
- Russia
- Poland
- Hungary
- Balkan & Baltic
- Rest of Eastern Europe
- By Service
- By Program Duration
- By Participant Type
- By Age Group
- By Booking Mode
- By Accommodation Type
- By Application
- By Country
- Market Attractiveness Analysis
- By Country
- By Service
- By Program Duration
- By Participant Type
- By Age Group
- By Booking Mode
- By Accommodation Type
- By Application
- Key Takeaways
- East Asia Market Analysis 2021 to 2025 and Forecast 2026 to 2036, by Country
- Historical Market Size Value (USD Billion) Trend Analysis By Market Taxonomy, 2021 to 2025
- Market Size Value (USD Billion) Forecast By Market Taxonomy, 2026 to 2036
- By Country
- China
- Japan
- South Korea
- By Service
- By Program Duration
- By Participant Type
- By Age Group
- By Booking Mode
- By Accommodation Type
- By Application
- By Country
- Market Attractiveness Analysis
- By Country
- By Service
- By Program Duration
- By Participant Type
- By Age Group
- By Booking Mode
- By Accommodation Type
- By Application
- Key Takeaways
- South Asia and Pacific Market Analysis 2021 to 2025 and Forecast 2026 to 2036, by Country
- Historical Market Size Value (USD Billion) Trend Analysis By Market Taxonomy, 2021 to 2025
- Market Size Value (USD Billion) Forecast By Market Taxonomy, 2026 to 2036
- By Country
- India
- ASEAN
- Australia & New Zealand
- Rest of South Asia and Pacific
- By Service
- By Program Duration
- By Participant Type
- By Age Group
- By Booking Mode
- By Accommodation Type
- By Application
- By Country
- Market Attractiveness Analysis
- By Country
- By Service
- By Program Duration
- By Participant Type
- By Age Group
- By Booking Mode
- By Accommodation Type
- By Application
- Key Takeaways
- Middle East & Africa Market Analysis 2021 to 2025 and Forecast 2026 to 2036, by Country
- Historical Market Size Value (USD Billion) Trend Analysis By Market Taxonomy, 2021 to 2025
- Market Size Value (USD Billion) Forecast By Market Taxonomy, 2026 to 2036
- By Country
- Kingdom of Saudi Arabia
- Other GCC Countries
- Turkiye
- South Africa
- Other African Union
- Rest of Middle East & Africa
- By Service
- By Program Duration
- By Participant Type
- By Age Group
- By Booking Mode
- By Accommodation Type
- By Application
- By Country
- Market Attractiveness Analysis
- By Country
- By Service
- By Program Duration
- By Participant Type
- By Age Group
- By Booking Mode
- By Accommodation Type
- By Application
- Key Takeaways
- Key Countries Market Analysis
- USA
- Pricing Analysis
- Market Share Analysis, 2025
- By Service
- By Program Duration
- By Participant Type
- By Age Group
- By Booking Mode
- By Accommodation Type
- By Application
- Canada
- Pricing Analysis
- Market Share Analysis, 2025
- By Service
- By Program Duration
- By Participant Type
- By Age Group
- By Booking Mode
- By Accommodation Type
- By Application
- Mexico
- Pricing Analysis
- Market Share Analysis, 2025
- By Service
- By Program Duration
- By Participant Type
- By Age Group
- By Booking Mode
- By Accommodation Type
- By Application
- Brazil
- Pricing Analysis
- Market Share Analysis, 2025
- By Service
- By Program Duration
- By Participant Type
- By Age Group
- By Booking Mode
- By Accommodation Type
- By Application
- Chile
- Pricing Analysis
- Market Share Analysis, 2025
- By Service
- By Program Duration
- By Participant Type
- By Age Group
- By Booking Mode
- By Accommodation Type
- By Application
- Germany
- Pricing Analysis
- Market Share Analysis, 2025
- By Service
- By Program Duration
- By Participant Type
- By Age Group
- By Booking Mode
- By Accommodation Type
- By Application
- UK
- Pricing Analysis
- Market Share Analysis, 2025
- By Service
- By Program Duration
- By Participant Type
- By Age Group
- By Booking Mode
- By Accommodation Type
- By Application
- Italy
- Pricing Analysis
- Market Share Analysis, 2025
- By Service
- By Program Duration
- By Participant Type
- By Age Group
- By Booking Mode
- By Accommodation Type
- By Application
- Spain
- Pricing Analysis
- Market Share Analysis, 2025
- By Service
- By Program Duration
- By Participant Type
- By Age Group
- By Booking Mode
- By Accommodation Type
- By Application
- France
- Pricing Analysis
- Market Share Analysis, 2025
- By Service
- By Program Duration
- By Participant Type
- By Age Group
- By Booking Mode
- By Accommodation Type
- By Application
- India
- Pricing Analysis
- Market Share Analysis, 2025
- By Service
- By Program Duration
- By Participant Type
- By Age Group
- By Booking Mode
- By Accommodation Type
- By Application
- ASEAN
- Pricing Analysis
- Market Share Analysis, 2025
- By Service
- By Program Duration
- By Participant Type
- By Age Group
- By Booking Mode
- By Accommodation Type
- By Application
- Australia & New Zealand
- Pricing Analysis
- Market Share Analysis, 2025
- By Service
- By Program Duration
- By Participant Type
- By Age Group
- By Booking Mode
- By Accommodation Type
- By Application
- China
- Pricing Analysis
- Market Share Analysis, 2025
- By Service
- By Program Duration
- By Participant Type
- By Age Group
- By Booking Mode
- By Accommodation Type
- By Application
- Japan
- Pricing Analysis
- Market Share Analysis, 2025
- By Service
- By Program Duration
- By Participant Type
- By Age Group
- By Booking Mode
- By Accommodation Type
- By Application
- South Korea
- Pricing Analysis
- Market Share Analysis, 2025
- By Service
- By Program Duration
- By Participant Type
- By Age Group
- By Booking Mode
- By Accommodation Type
- By Application
- Russia
- Pricing Analysis
- Market Share Analysis, 2025
- By Service
- By Program Duration
- By Participant Type
- By Age Group
- By Booking Mode
- By Accommodation Type
- By Application
- Poland
- Pricing Analysis
- Market Share Analysis, 2025
- By Service
- By Program Duration
- By Participant Type
- By Age Group
- By Booking Mode
- By Accommodation Type
- By Application
- Hungary
- Pricing Analysis
- Market Share Analysis, 2025
- By Service
- By Program Duration
- By Participant Type
- By Age Group
- By Booking Mode
- By Accommodation Type
- By Application
- Kingdom of Saudi Arabia
- Pricing Analysis
- Market Share Analysis, 2025
- By Service
- By Program Duration
- By Participant Type
- By Age Group
- By Booking Mode
- By Accommodation Type
- By Application
- Turkiye
- Pricing Analysis
- Market Share Analysis, 2025
- By Service
- By Program Duration
- By Participant Type
- By Age Group
- By Booking Mode
- By Accommodation Type
- By Application
- South Africa
- Pricing Analysis
- Market Share Analysis, 2025
- By Service
- By Program Duration
- By Participant Type
- By Age Group
- By Booking Mode
- By Accommodation Type
- By Application
- USA
- Market Structure Analysis
- Competition Dashboard
- Competition Benchmarking
- Market Share Analysis of Top Players
- By Regional
- By Service
- By Program Duration
- By Participant Type
- By Age Group
- By Booking Mode
- By Accommodation Type
- By Application
- Competition Analysis
- Competition Deep Dive
- Meridean Overseas
- Overview
- Product Portfolio
- Profitability by Market Segments (Product/Age /Sales Channel/Region)
- Sales Footprint
- Strategy Overview
- Marketing Strategy
- Product Strategy
- Channel Strategy
- EF Education First
- CIEE (Council on International Educational Exchange)
- WorldStrides
- Kaplan International
- Study Group
- American Institute For Foreign Study (AIFS)
- Road Scholar
- Explorica
- Academic Programs International (API)
- Cultural Vistas
- GoAbroad
- The Education Abroad Network (TEAN)
- Meridean Overseas
- Competition Deep Dive
- Assumptions & Acronyms Used


