Emulsified Shortenings Market Size and Share Forecast Outlook 2025 to 2035

The Emulsified Shortenings Market is estimated to be valued at USD 353.9 million in 2025 and is projected to reach USD 544.3 million by 2035, registering a compound annual growth rate (CAGR) of 4.4% over the forecast period.
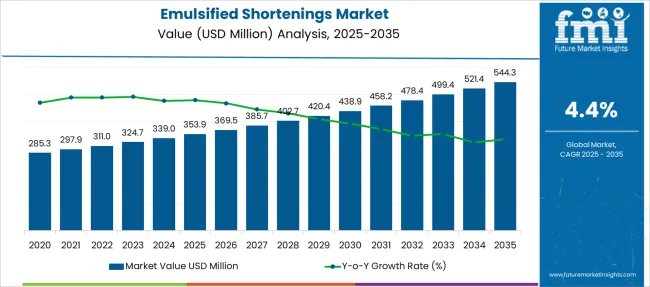
Quick Stats for Emulsified Shortenings Market

  • Emulsified Shortenings Market Industry Value (2025): USD 353.9 million
  • Emulsified Shortenings Market Forecast Value (2035): USD 544.3 million
  • Emulsified Shortenings Market Forecast CAGR: 4.4%
  • Leading Segment in Emulsified Shortenings Market in 2025: Dry (42.8%)
  • Key Growth Region in Emulsified Shortenings Market: North America, Asia-Pacific, Europe
  • Top Key Players in Emulsified Shortenings Market: Cargill, Incorporated, Bunge Limited, Mallet & Company, Inc., Lonza Group AG, Palsgaard, Archer Daniels Midland Company, Wilmar International Limited, Ventura Foods LLC, AAK AB

Emulsified Shortenings Market Market Value Analysis

Metric Value
Emulsified Shortenings Market Estimated Value in (2025 E) USD 353.9 million
Emulsified Shortenings Market Forecast Value in (2035 F) USD 544.3 million
Forecast CAGR (2025 to 2035) 4.4%

Rationale for Segmental Growth in the Emulsified Shortenings Market

The emulsified shortenings market is expanding steadily as food manufacturers seek ingredients that enhance product texture, shelf life, and nutritional profile. Growing consumer preference for cleaner labels and plant-based alternatives has encouraged the development and adoption of emulsified shortenings derived from natural sources.

The food processing industry has increasingly prioritized ingredient functionality to meet demands for better product performance and health-conscious formulations. Additionally, innovations in emulsification techniques have improved the stability and versatility of shortenings across various food applications.

Industry trends indicate a rise in demand for dry form emulsified shortenings due to their ease of handling and longer storage life. The market outlook remains positive as manufacturers focus on sustainable sourcing and clean-label positioning to capture evolving consumer preferences. Segmental growth is expected to be driven by the Dry form, Plant-based source, and the Food Processing end use.

Segmental Analysis

The market is segmented by Form, Source, End Use, and Distribution Channel and region. By Form, the market is divided into Dry, Powder, Pellets, and Liquid. In terms of Source, the market is classified into Plant-based and Animal-based. Based on End Use, the market is segmented into Food Processing, Bakery, Confectionery, Dairy, Desserts, Foodservice/HoReCa, and Household. By Distribution Channel, the market is divided into Direct Sales and Indirect Sales. Regionally, the market is classified into North America, Latin America, Western Europe, Eastern Europe, Balkan & Baltic Countries, Russia & Belarus, Central Asia, East Asia, South Asia & Pacific, and the Middle East & Africa.
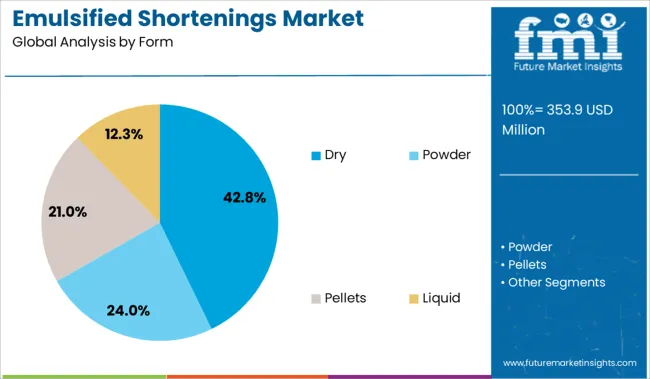
Insights into the Form Segment: Dry

Emulsified Shortenings Market Analysis By Form

The Dry form segment is projected to hold 42.8% of the emulsified shortenings market revenue in 2025, maintaining its position as the preferred form type. This segment has gained traction due to its convenience in storage, handling, and transportation.

Dry emulsified shortenings offer longer shelf stability and reduced risk of microbial contamination compared to liquid or semi-solid forms. Food processors favor dry forms as they allow precise dosing and easier integration into dry mixes or dough formulations.

The dry form also aligns well with manufacturing processes that require consistent ingredient quality and minimal moisture content. As production efficiency and ingredient standardization become priorities in food manufacturing, the Dry segment is expected to sustain strong demand.
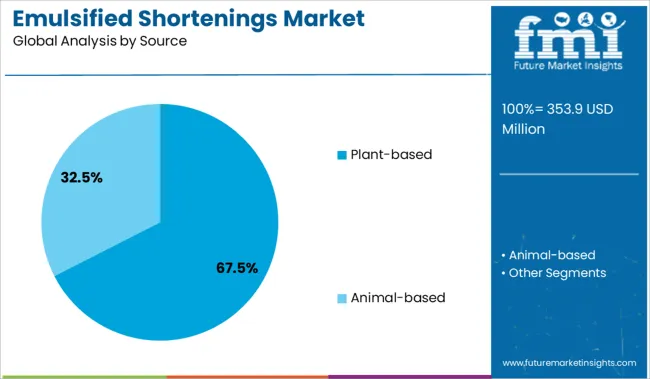
Insights into the Source Segment: Plant-based

Emulsified Shortenings Market Analysis By Source

The Plant-based segment is anticipated to contribute 67.5% of the emulsified shortenings market revenue in 2025, dominating the source category. This growth is fueled by the rising consumer demand for plant-derived food ingredients driven by health, environmental, and ethical considerations.

Plant-based emulsified shortenings are preferred for their clean-label appeal and ability to replace traditional animal fats without compromising product texture or performance. Food manufacturers are increasingly reformulating products to meet vegetarian and vegan standards, further propelling this segment.

Additionally, advancements in plant oil processing have enhanced the functional properties of these shortenings, making them suitable for a wide range of bakery and snack applications. With growing focus on sustainability and health, the Plant-based segment is expected to maintain its leading market share.
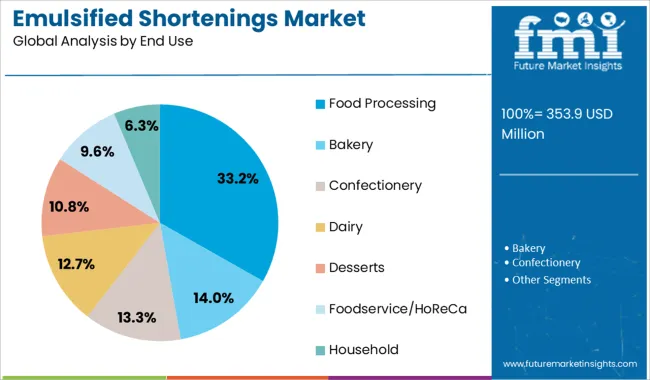
Insights into the End Use Segment: Food Processing

Emulsified Shortenings Market Analysis By End Use

The Food Processing segment is projected to account for 33.2% of the emulsified shortenings market revenue in 2025, remaining the primary end-use sector. This segment’s growth is driven by the expanding bakery, confectionery, and snack food industries that rely on emulsified shortenings to improve product quality and shelf life.

Food processors prioritize ingredients that ensure consistent dough handling, texture, and mouthfeel in finished products. The increasing demand for baked goods and processed snacks in emerging markets has further contributed to this segment’s expansion.

Moreover, regulatory emphasis on food safety and quality standards has encouraged the adoption of high-performance emulsified shortenings. As consumer preferences evolve toward healthier and more natural food options, food processing companies are expected to continue investing in innovative shortening solutions, keeping this segment at the forefront of market growth.

What are the Prominent Opportunities Creating Growth Prospects in the Global Emulsified Shortenings Market?

Emulsified shortenings are garnering immense popularity across diverse food & beverage sectors, on account of their ability to elevate taste, enhance texture, increase moisture, and improve mouth feel.

It also helps in increasing the volume of bakery products, improves crumb structure in cakes, assist in strengthening the gluten network in the dough, and enhances the structure of whipped products. Attributed to this, these shortenings are finding a wide range of applications in the preparation of various products such as dairy, bakery, confectionery, and desserts.

Hence, increasing consumption of cakes, brownies, bread, candies, ice creams, smoothies, chocolates, desserts, and others across the world is estimated to bolster the sales of emulsified shortenings in the global market.

What are the Leading Factors Restraining the Growth in the Global Emulsified Shortenings Market?

There has been a significant increase in the prevalence of lifestyle diseases such as hypertension, obesity, diabetes, and others worldwide over the past few years. For instance, according the National Health and Nutrition Examination Survey, around 42.4% of the overall population, or more than 2 out of 5 adults between the ages 18 and 69 were reported to be suffering from obesity.

Hence, rising concerns regarding healthly lifestyle, and growing focus on decreasing the consumption of fatty & high-calorie foods such as cakes, ice creams, chocolates, and others are estimated to hinder the sales of emulsified shortenings in the market.
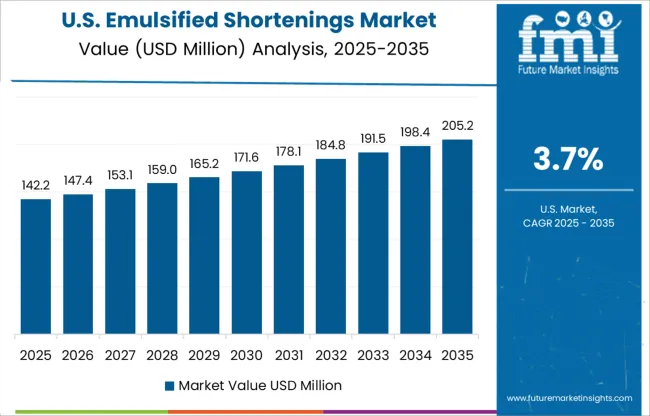
What is the Demand Outlook for Emulsified Shortenings in the North America Market?

Emulsified Shortenings Market Country Value Analysis

As per Future Market Insights, North America is projected to emerge as a highly remunerative market for emulsified shortenings during the forecast period 2025 to 2035.

Due to the shifting consumer preference towards adopting packed and convenience food, the consumption of quality bakery products such as pastries, bread, cakes, cookies, and others is increasing at a rapid pace. To capitalize on this trend, leading Hotels, Restaurants, and Café (HoReCa) industry players are aiming at launching novel outlets.

For instance, in March 2024, Levain Bakery, a USA based retail bakery announced opening a new outlet in Lower Manhattan, New York, the USA to expand its footprint. Since emulsified shortenings is used in preparing bakery products, a multiplicity of such developments is estimated to augment the demand for emulsified shortenings in the North America market.
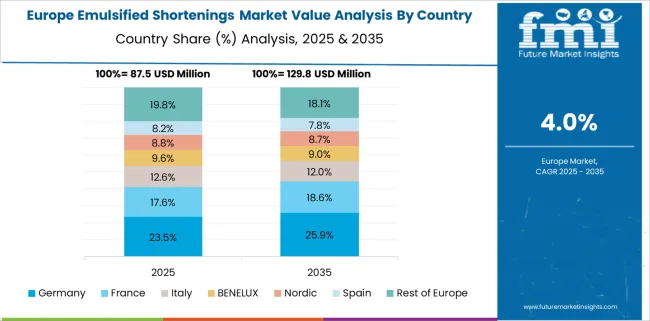
Why is Europe Emerging as a Highly Lucrative Emulsified Shortenings Market?

Emulsified Shortenings Market Europe Country Market Share Analysis, 2025 & 2035

As per a study by FMI, Europe is estimated to register robust growth in the global emulsified shortenings market during the forecast period 2025 to 2035.

With growing adoption of novel additives shortenings for enhancing the texture, volume, and moisture of processed food products and rising shift towards adopting plant-based ingredients, key companies are focusing on launching novel products sourced from plants.

For instance, in 2020, Bunge Loders Croklaan B.V., A Netherlands-based producer of sustainable specialty oils and fats announced launching a new plant-based specialty emulsified shortenings Vream Elite, sourced from soy. It aids in maximizing the texture, taste, and functionality of cakes, icings, donuts, pies, and cookies. Such new product launches are anticipated to favor the growth in the Europe market.
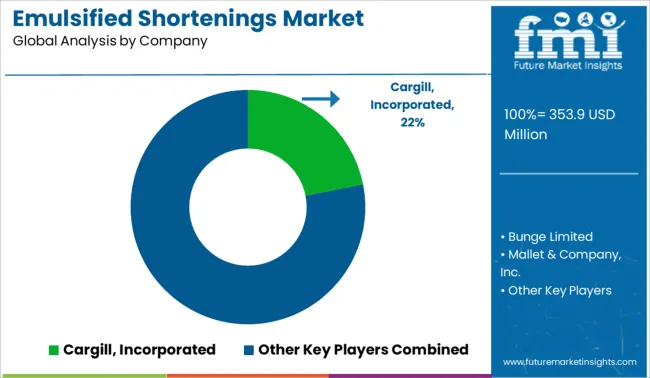
Market Competition

Emulsified Shortenings Market Analysis By Company

Some of the leading players in the emulsified shortenings market are Cargill, Incorporated, Bunge Limited, Mallet & Company, Inc., Lonza Group AG, Palsgaard, Archer Daniels Midland Company, and others.

Leading manufacturers of emulsified shortenings in the global market are aiming at adoption strategies such as new product launch, production capacity expansion, acquisition, collaboration, and others for strengthen their footprint in the competitive market.

Report Scope

Report Attribute Details
Growth Rate CAGR of 5% to 6% from 2025 to 2035
Base Year for Estimation 2024
Historical Data 2020 to 2024
Forecast Period 2025 to 2035
Quantitative Units Revenue in USD Million, Volume in Kilotons and CAGR from 2025-2035
Report Coverage Revenue Forecast, Volume Forecast, Company Ranking, Competitive Landscape, Growth Factors, Trends and Pricing Analysis
Segments Covered Form, Source, End Use, Region
Countries Covered North America, Latin America, Europe, East Asia, South Asia, Oceania, Middle East and Africa
Key Companies Profiled Cargill, Incorporated; Bunge Limited; Mallet & Company, Inc.; Lonza Group AG; Palsgaard; Archer Daniels Midland Company; Others
Customization Available Upon Request

Key Segments Profiled in the Emulsified Shortenings Market Survey

By Form:

  • Dry
  • Powder
  • Pellets
  • Liquid

By Source:

  • Plant-based
  • Animal-based

By End Use:

  • Food Processing
  • Bakery
  • Confectionery
  • Dairy
  • Desserts
  • Foodservice/HoReCa (Hotels/ Restaurants/ Café)
  • Household

By Sales Channel:

  • Direct Sales/ B2B
  • Indirect Sales/ B2C
  • Hypermarkets/ Supermarkets
  • Wholesalers
  • Convenience Stores
  • Specialty Stores
  • Online Retailers

By Region:

  • North America
  • Latin America
  • Europe
  • East Asia
  • South Asia
  • Oceania
  • Middle East and Africa

Table of Content

  1. Executive Summary
    • Global Market Outlook
    • Demand-side Trends
    • Supply-side Trends
    • Technology Roadmap Analysis
    • Analysis and Recommendations
  2. Market Overview
    • Market Coverage / Taxonomy
    • Market Definition / Scope / Limitations
  3. Market Background
    • Market Dynamics
      • Drivers
      • Restraints
      • Opportunity
      • Trends
    • Scenario Forecast
      • Demand in Optimistic Scenario
      • Demand in Likely Scenario
      • Demand in Conservative Scenario
    • Opportunity Map Analysis
    • Product Life Cycle Analysis
    • Supply Chain Analysis
    • Investment Feasibility Matrix
    • Value Chain Analysis
    • PESTLE and Porter’s Analysis
    • Regulatory Landscape
    • Regional Parent Market Outlook
    • Production and Consumption Statistics
    • Import and Export Statistics
  4. Global Market Analysis 2020 to 2024 and Forecast, 2025 to 2035
    • Historical Market Size Value (USD Million) Analysis, 2020 to 2024
    • Current and Future Market Size Value (USD Million) Projections, 2025 to 2035
      • Y-o-Y Growth Trend Analysis
      • Absolute $ Opportunity Analysis
  5. Global Market Pricing Analysis 2020 to 2024 and Forecast 2025 to 2035
  6. Global Market Analysis 2020 to 2024 and Forecast 2025 to 2035, By Form
    • Introduction / Key Findings
    • Historical Market Size Value (USD Million) Analysis By Form , 2020 to 2024
    • Current and Future Market Size Value (USD Million) Analysis and Forecast By Form , 2025 to 2035
      • Dry
      • Powder
      • Pellets
      • Liquid
    • Y-o-Y Growth Trend Analysis By Form , 2020 to 2024
    • Absolute $ Opportunity Analysis By Form , 2025 to 2035
  7. Global Market Analysis 2020 to 2024 and Forecast 2025 to 2035, By Source
    • Introduction / Key Findings
    • Historical Market Size Value (USD Million) Analysis By Source, 2020 to 2024
    • Current and Future Market Size Value (USD Million) Analysis and Forecast By Source, 2025 to 2035
      • Plant-based
      • Animal-based
    • Y-o-Y Growth Trend Analysis By Source, 2020 to 2024
    • Absolute $ Opportunity Analysis By Source, 2025 to 2035
  8. Global Market Analysis 2020 to 2024 and Forecast 2025 to 2035, By End Use
    • Introduction / Key Findings
    • Historical Market Size Value (USD Million) Analysis By End Use, 2020 to 2024
    • Current and Future Market Size Value (USD Million) Analysis and Forecast By End Use, 2025 to 2035
      • Food Processing
      • Bakery
      • Confectionery
      • Dairy
      • Desserts
      • Foodservice/HoReCa
      • Household
    • Y-o-Y Growth Trend Analysis By End Use, 2020 to 2024
    • Absolute $ Opportunity Analysis By End Use, 2025 to 2035
  9. Global Market Analysis 2020 to 2024 and Forecast 2025 to 2035, By Distribution Channel
    • Introduction / Key Findings
    • Historical Market Size Value (USD Million) Analysis By Distribution Channel, 2020 to 2024
    • Current and Future Market Size Value (USD Million) Analysis and Forecast By Distribution Channel, 2025 to 2035
      • Direct Sales
      • Indirect Sales
        • Hypermarkets/Supermarkets
        • Wholesalers
        • Convenience Stores
        • Specialty Stores
        • Online Retailers
    • Y-o-Y Growth Trend Analysis By Distribution Channel, 2020 to 2024
    • Absolute $ Opportunity Analysis By Distribution Channel, 2025 to 2035
  10. Global Market Analysis 2020 to 2024 and Forecast 2025 to 2035, By Region
    • Introduction
    • Historical Market Size Value (USD Million) Analysis By Region, 2020 to 2024
    • Current Market Size Value (USD Million) Analysis and Forecast By Region, 2025 to 2035
      • North America
      • Latin America
      • Western Europe
      • Eastern Europe
      • East Asia
      • South Asia and Pacific
      • Middle East & Africa
    • Market Attractiveness Analysis By Region
  11. North America Market Analysis 2020 to 2024 and Forecast 2025 to 2035, By Country
    • Historical Market Size Value (USD Million) Trend Analysis By Market Taxonomy, 2020 to 2024
    • Market Size Value (USD Million) Forecast By Market Taxonomy, 2025 to 2035
      • By Country
        • USA
        • Canada
        • Mexico
      • By Form
      • By Source
      • By End Use
      • By Distribution Channel
    • Market Attractiveness Analysis
      • By Country
      • By Form
      • By Source
      • By End Use
      • By Distribution Channel
    • Key Takeaways
  12. Latin America Market Analysis 2020 to 2024 and Forecast 2025 to 2035, By Country
    • Historical Market Size Value (USD Million) Trend Analysis By Market Taxonomy, 2020 to 2024
    • Market Size Value (USD Million) Forecast By Market Taxonomy, 2025 to 2035
      • By Country
        • Brazil
        • Chile
        • Rest of Latin America
      • By Form
      • By Source
      • By End Use
      • By Distribution Channel
    • Market Attractiveness Analysis
      • By Country
      • By Form
      • By Source
      • By End Use
      • By Distribution Channel
    • Key Takeaways
  13. Western Europe Market Analysis 2020 to 2024 and Forecast 2025 to 2035, By Country
    • Historical Market Size Value (USD Million) Trend Analysis By Market Taxonomy, 2020 to 2024
    • Market Size Value (USD Million) Forecast By Market Taxonomy, 2025 to 2035
      • By Country
        • Germany
        • UK
        • Italy
        • Spain
        • France
        • Nordic
        • BENELUX
        • Rest of Western Europe
      • By Form
      • By Source
      • By End Use
      • By Distribution Channel
    • Market Attractiveness Analysis
      • By Country
      • By Form
      • By Source
      • By End Use
      • By Distribution Channel
    • Key Takeaways
  14. Eastern Europe Market Analysis 2020 to 2024 and Forecast 2025 to 2035, By Country
    • Historical Market Size Value (USD Million) Trend Analysis By Market Taxonomy, 2020 to 2024
    • Market Size Value (USD Million) Forecast By Market Taxonomy, 2025 to 2035
      • By Country
        • Russia
        • Poland
        • Hungary
        • Balkan & Baltic
        • Rest of Eastern Europe
      • By Form
      • By Source
      • By End Use
      • By Distribution Channel
    • Market Attractiveness Analysis
      • By Country
      • By Form
      • By Source
      • By End Use
      • By Distribution Channel
    • Key Takeaways
  15. East Asia Market Analysis 2020 to 2024 and Forecast 2025 to 2035, By Country
    • Historical Market Size Value (USD Million) Trend Analysis By Market Taxonomy, 2020 to 2024
    • Market Size Value (USD Million) Forecast By Market Taxonomy, 2025 to 2035
      • By Country
        • China
        • Japan
        • South Korea
      • By Form
      • By Source
      • By End Use
      • By Distribution Channel
    • Market Attractiveness Analysis
      • By Country
      • By Form
      • By Source
      • By End Use
      • By Distribution Channel
    • Key Takeaways
  16. South Asia and Pacific Market Analysis 2020 to 2024 and Forecast 2025 to 2035, By Country
    • Historical Market Size Value (USD Million) Trend Analysis By Market Taxonomy, 2020 to 2024
    • Market Size Value (USD Million) Forecast By Market Taxonomy, 2025 to 2035
      • By Country
        • India
        • ASEAN
        • Australia & New Zealand
        • Rest of South Asia and Pacific
      • By Form
      • By Source
      • By End Use
      • By Distribution Channel
    • Market Attractiveness Analysis
      • By Country
      • By Form
      • By Source
      • By End Use
      • By Distribution Channel
    • Key Takeaways
  17. Middle East & Africa Market Analysis 2020 to 2024 and Forecast 2025 to 2035, By Country
    • Historical Market Size Value (USD Million) Trend Analysis By Market Taxonomy, 2020 to 2024
    • Market Size Value (USD Million) Forecast By Market Taxonomy, 2025 to 2035
      • By Country
        • Kingdom of Saudi Arabia
        • Other GCC Countries
        • Turkiye
        • South Africa
        • Other African Union
        • Rest of Middle East & Africa
      • By Form
      • By Source
      • By End Use
      • By Distribution Channel
    • Market Attractiveness Analysis
      • By Country
      • By Form
      • By Source
      • By End Use
      • By Distribution Channel
    • Key Takeaways
  18. Key Countries Market Analysis
    • USA
      • Pricing Analysis
      • Market Share Analysis, 2024
        • By Form
        • By Source
        • By End Use
        • By Distribution Channel
    • Canada
      • Pricing Analysis
      • Market Share Analysis, 2024
        • By Form
        • By Source
        • By End Use
        • By Distribution Channel
    • Mexico
      • Pricing Analysis
      • Market Share Analysis, 2024
        • By Form
        • By Source
        • By End Use
        • By Distribution Channel
    • Brazil
      • Pricing Analysis
      • Market Share Analysis, 2024
        • By Form
        • By Source
        • By End Use
        • By Distribution Channel
    • Chile
      • Pricing Analysis
      • Market Share Analysis, 2024
        • By Form
        • By Source
        • By End Use
        • By Distribution Channel
    • Germany
      • Pricing Analysis
      • Market Share Analysis, 2024
        • By Form
        • By Source
        • By End Use
        • By Distribution Channel
    • UK
      • Pricing Analysis
      • Market Share Analysis, 2024
        • By Form
        • By Source
        • By End Use
        • By Distribution Channel
    • Italy
      • Pricing Analysis
      • Market Share Analysis, 2024
        • By Form
        • By Source
        • By End Use
        • By Distribution Channel
    • Spain
      • Pricing Analysis
      • Market Share Analysis, 2024
        • By Form
        • By Source
        • By End Use
        • By Distribution Channel
    • France
      • Pricing Analysis
      • Market Share Analysis, 2024
        • By Form
        • By Source
        • By End Use
        • By Distribution Channel
    • India
      • Pricing Analysis
      • Market Share Analysis, 2024
        • By Form
        • By Source
        • By End Use
        • By Distribution Channel
    • ASEAN
      • Pricing Analysis
      • Market Share Analysis, 2024
        • By Form
        • By Source
        • By End Use
        • By Distribution Channel
    • Australia & New Zealand
      • Pricing Analysis
      • Market Share Analysis, 2024
        • By Form
        • By Source
        • By End Use
        • By Distribution Channel
    • China
      • Pricing Analysis
      • Market Share Analysis, 2024
        • By Form
        • By Source
        • By End Use
        • By Distribution Channel
    • Japan
      • Pricing Analysis
      • Market Share Analysis, 2024
        • By Form
        • By Source
        • By End Use
        • By Distribution Channel
    • South Korea
      • Pricing Analysis
      • Market Share Analysis, 2024
        • By Form
        • By Source
        • By End Use
        • By Distribution Channel
    • Russia
      • Pricing Analysis
      • Market Share Analysis, 2024
        • By Form
        • By Source
        • By End Use
        • By Distribution Channel
    • Poland
      • Pricing Analysis
      • Market Share Analysis, 2024
        • By Form
        • By Source
        • By End Use
        • By Distribution Channel
    • Hungary
      • Pricing Analysis
      • Market Share Analysis, 2024
        • By Form
        • By Source
        • By End Use
        • By Distribution Channel
    • Kingdom of Saudi Arabia
      • Pricing Analysis
      • Market Share Analysis, 2024
        • By Form
        • By Source
        • By End Use
        • By Distribution Channel
    • Turkiye
      • Pricing Analysis
      • Market Share Analysis, 2024
        • By Form
        • By Source
        • By End Use
        • By Distribution Channel
    • South Africa
      • Pricing Analysis
      • Market Share Analysis, 2024
        • By Form
        • By Source
        • By End Use
        • By Distribution Channel
  19. Market Structure Analysis
    • Competition Dashboard
    • Competition Benchmarking
    • Market Share Analysis of Top Players
      • By Regional
      • By Form
      • By Source
      • By End Use
      • By Distribution Channel
  20. Competition Analysis
    • Competition Deep Dive
      • Cargill, Incorporated
        • Overview
        • Product Portfolio
        • Profitability by Market Segments (Product/Age /Sales Channel/Region)
        • Sales Footprint
        • Strategy Overview
          • Marketing Strategy
          • Product Strategy
          • Channel Strategy
      • Bunge Limited
      • Mallet & Company, Inc.
      • Lonza Group AG
      • Palsgaard
      • Archer Daniels Midland Company
      • Wilmar International Limited
      • Ventura Foods LLC
      • AAK AB
  21. Assumptions & Acronyms Used
  22. Research Methodology

List of Tables

  • Table 1: Global Market Value (USD Million) Forecast by Region, 2020-2035
  • Table 2: Global Market Value (USD Million) Forecast by Form , 2020-2035
  • Table 3: Global Market Value (USD Million) Forecast by Source, 2020-2035
  • Table 4: Global Market Value (USD Million) Forecast by End Use, 2020-2035
  • Table 5: Global Market Value (USD Million) Forecast by Distribution Channel, 2020-2035
  • Table 6: North America Market Value (USD Million) Forecast by Country, 2020-2035
  • Table 7: North America Market Value (USD Million) Forecast by Form , 2020-2035
  • Table 8: North America Market Value (USD Million) Forecast by Source, 2020-2035
  • Table 9: North America Market Value (USD Million) Forecast by End Use, 2020-2035
  • Table 10: North America Market Value (USD Million) Forecast by Distribution Channel, 2020-2035
  • Table 11: Latin America Market Value (USD Million) Forecast by Country, 2020-2035
  • Table 12: Latin America Market Value (USD Million) Forecast by Form , 2020-2035
  • Table 13: Latin America Market Value (USD Million) Forecast by Source, 2020-2035
  • Table 14: Latin America Market Value (USD Million) Forecast by End Use, 2020-2035
  • Table 15: Latin America Market Value (USD Million) Forecast by Distribution Channel, 2020-2035
  • Table 16: Western Europe Market Value (USD Million) Forecast by Country, 2020-2035
  • Table 17: Western Europe Market Value (USD Million) Forecast by Form , 2020-2035
  • Table 18: Western Europe Market Value (USD Million) Forecast by Source, 2020-2035
  • Table 19: Western Europe Market Value (USD Million) Forecast by End Use, 2020-2035
  • Table 20: Western Europe Market Value (USD Million) Forecast by Distribution Channel, 2020-2035
  • Table 21: Eastern Europe Market Value (USD Million) Forecast by Country, 2020-2035
  • Table 22: Eastern Europe Market Value (USD Million) Forecast by Form , 2020-2035
  • Table 23: Eastern Europe Market Value (USD Million) Forecast by Source, 2020-2035
  • Table 24: Eastern Europe Market Value (USD Million) Forecast by End Use, 2020-2035
  • Table 25: Eastern Europe Market Value (USD Million) Forecast by Distribution Channel, 2020-2035
  • Table 26: East Asia Market Value (USD Million) Forecast by Country, 2020-2035
  • Table 27: East Asia Market Value (USD Million) Forecast by Form , 2020-2035
  • Table 28: East Asia Market Value (USD Million) Forecast by Source, 2020-2035
  • Table 29: East Asia Market Value (USD Million) Forecast by End Use, 2020-2035
  • Table 30: East Asia Market Value (USD Million) Forecast by Distribution Channel, 2020-2035
  • Table 31: South Asia and Pacific Market Value (USD Million) Forecast by Country, 2020-2035
  • Table 32: South Asia and Pacific Market Value (USD Million) Forecast by Form , 2020-2035
  • Table 33: South Asia and Pacific Market Value (USD Million) Forecast by Source, 2020-2035
  • Table 34: South Asia and Pacific Market Value (USD Million) Forecast by End Use, 2020-2035
  • Table 35: South Asia and Pacific Market Value (USD Million) Forecast by Distribution Channel, 2020-2035
  • Table 36: Middle East & Africa Market Value (USD Million) Forecast by Country, 2020-2035
  • Table 37: Middle East & Africa Market Value (USD Million) Forecast by Form , 2020-2035
  • Table 38: Middle East & Africa Market Value (USD Million) Forecast by Source, 2020-2035
  • Table 39: Middle East & Africa Market Value (USD Million) Forecast by End Use, 2020-2035
  • Table 40: Middle East & Africa Market Value (USD Million) Forecast by Distribution Channel, 2020-2035

List of Figures

  • Figure 1: Global Market Pricing Analysis
  • Figure 2: Global Market Value (USD Million) Forecast 2020-2035
  • Figure 3: Global Market Value (USD Million) Share and BPS Analysis by Region, 2025 and 2035
  • Figure 4: Global Market Y-o-Y Growth Comparison by Region, 2025-2035
  • Figure 5: Global Market Attractiveness Analysis by Region
  • Figure 6: North America Market Incremental Dollar Opportunity, 2025-2035
  • Figure 7: Latin America Market Incremental Dollar Opportunity, 2025-2035
  • Figure 8: Western Europe Market Incremental Dollar Opportunity, 2025-2035
  • Figure 9: Eastern Europe Market Incremental Dollar Opportunity, 2025-2035
  • Figure 10: East Asia Market Incremental Dollar Opportunity, 2025-2035
  • Figure 11: South Asia and Pacific Market Incremental Dollar Opportunity, 2025-2035
  • Figure 12: Middle East & Africa Market Incremental Dollar Opportunity, 2025-2035
  • Figure 13: North America Market Value Share and BPS Analysis by Country, 2025 and 2035
  • Figure 14: Latin America Market Value Share and BPS Analysis by Country, 2025 and 2035
  • Figure 15: Western Europe Market Value Share and BPS Analysis by Country, 2025 and 2035
  • Figure 16: Eastern Europe Market Value Share and BPS Analysis by Country, 2025 and 2035
  • Figure 17: East Asia Market Value Share and BPS Analysis by Country, 2025 and 2035
  • Figure 18: South Asia and Pacific Market Value Share and BPS Analysis by Country, 2025 and 2035
  • Figure 19: Middle East & Africa Market Value Share and BPS Analysis by Country, 2025 and 2035
  • Figure 20: Global Market - Tier Structure Analysis
  • Figure 21: Global Market - Company Share Analysis

Frequently Asked Questions

How big is the emulsified shortenings market in 2025?

The global emulsified shortenings market is estimated to be valued at USD 353.9 million in 2025.

What will be the size of emulsified shortenings market in 2035?

The market size for the emulsified shortenings market is projected to reach USD 544.3 million by 2035.

How much will be the emulsified shortenings market growth between 2025 and 2035?

The emulsified shortenings market is expected to grow at a 4.4% CAGR between 2025 and 2035.

What are the key product types in the emulsified shortenings market?

The key product types in emulsified shortenings market are dry, powder, pellets and liquid.

Which source segment to contribute significant share in the emulsified shortenings market in 2025?

In terms of source, plant-based segment to command 67.5% share in the emulsified shortenings market in 2025.

Explore Similar Insights

Future Market Insights

Emulsified Shortenings Market