

- Market Size (2026)
- USD 1.0 Bn
- Forecast (2036)
- USD 3.2 Bn
- CAGR (2026 to 2036)
- 12.3%
EV Battery Thermal Management Upgrade Services Market Size, Forecast and Outlook By FMI
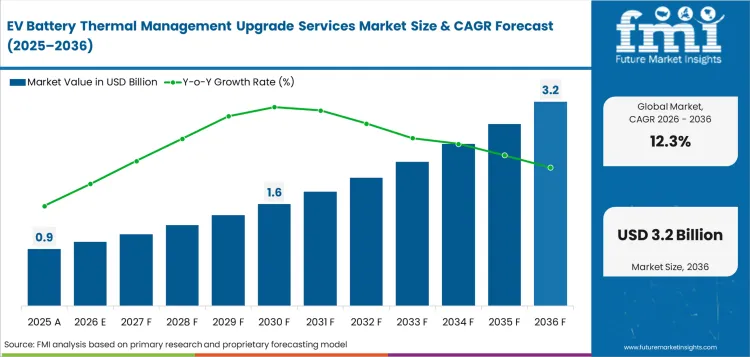
EV battery thermal management upgrade services market was valued at USD 0.9 billion in 2025 and is expected to reach USD 1.0 billion in 2026. Demand is forecast to rise to USD 3.2 billion by 2036 at 12.3% CAGR during the forecast period. Coolant loop upgrades are expected to account for 38.4% share of service type demand in 2026. Electric buses are forecast to hold 34.6% share of vehicle type demand in 2026.
Battery cooling service is moving from basic coolant handling toward documented repair work because safety rules and workshop tools are becoming more specific. In February 2025, the USA Department of Transportation stated that FMVSS No. 305a applies to light and heavy vehicles and includes performance requirements for the propulsion battery. Service providers will need repair records and safe handling steps after thermal circuit work. In May 2025, MAHLE launched E-CARE Fluid in Europe for fully automated emptying and filling of EV cooling systems with integrated vacuum and pressure leak testing.
The tool supports garages during high-voltage battery repair and coolant circuit component replacement. In May 2025, HELLA said its aftermarket thermal management range starts with 1,200 spare parts and is planned to expand to 6,000 parts by 2027. Parts distributors get a clearer route to supply EV cooling repairs as older electric vehicles enter higher-mileage service.
Summary of the EV Battery Thermal Management Upgrade Services Market
- Demand and Growth Drivers
- EV battery cooling service is becoming more important as older electric vehicles move into regular repair cycles. Workshops need to check coolant flow and battery temperature control before small faults become costly repairs.
- Fast charging puts extra heat stress on battery packs. Service providers can add value by checking pumps and coolant quality during planned maintenance.
- Electric buses and fleet EVs need reliable battery cooling because downtime can affect daily operations. Planned thermal checks help operators keep vehicles ready for routes.
- Product and Segment View
- Coolant loop upgrades form an important service area because battery packs need clean coolant movement. Poor flow can reduce charging performance and raise battery safety concerns.
- Battery chiller upgrades support EVs that run under higher heat loads. Heat pump retrofits are also useful in colder regions because battery warming affects range and charging speed.
- Preventive maintenance is becoming the preferred service route for fleets. It allows technicians to find weak pumps and coolant issues before the vehicle gives repeated warning alerts.
- Geography and Competitive Outlook
- China and India offer strong service potential as electric cars and electric buses move into wider use. Larger EV fleets create more need for battery cooling checks and service tools.
- Germany and France show better readiness as their workshops already support EV thermal systems. The United Kingdom adds service depth through trained EV repair networks. This helps service providers handle higher-value EV repair work.
- Competition will favor companies that can combine trained technicians with clear diagnostic steps. Suppliers that provide parts and service guidance will be better placed in fleet and workshop channels.
- Analyst Opinion
- Nikhil Kaitwade, Principal Consultant of FMI says, “EV battery thermal service is shifting from simple coolant refill to a pack-health decision. Fleet operators want lower downtime and safer charging performance. Suppliers able to combine diagnostics and leak testing with correct coolant handling are expected to be preferred as EVs move into second-owner and fleet maintenance cycles.”
- EV Battery Thermal Management Upgrade Services Market Value Analysis
- The EV battery thermal management upgrade services market is moving from basic coolant service into a more defined EV repair and upgrade space.
- Adoption is supported by rising use of fast charging, which puts more heat stress on battery packs.
- The market is benefitting from electric bus and fleet service needs as operators look for better uptime and safer battery performance.
- Demand is further supported by older EVs that need coolant checks with pump replacement and thermal system diagnostics during regular service.
Key Takeaways, Market Size, and Forecast
- EV battery thermal management upgrade services market stood at USD 0.9 billion in 2025.
- By 2036, industry revenue is forecast to reach USD 3.2 billion.
- Market value is expected to expand at 12.3% CAGR during the forecast period.
- Market revenue is predicted to add USD 2.2 billion in incremental opportunity over 2026 to 2036.
- Coolant loop upgrades are expected to hold the leading service position with 38.4% share in 2026.
- Electric buses are anticipated to represent 34.6% share of vehicle type demand in 2026.
- India at 14.6% CAGR and China at 13.8% CAGR are forecast to outpace the global market during the forecast period.
EV Battery Thermal Management Upgrade Services Market Definition
EV battery thermal management upgrade services cover inspection and repair work performed on electric vehicle battery cooling systems.
EV Battery Thermal Management Upgrade Services Market Inclusions
Market scope covers EV battery thermal management upgrade services categorized by service type, including coolant loop upgrades and battery chiller upgrades. Heat pump retrofits and software recalibration are included. Vehicle type includes electric buses and passenger EVs. Electric trucks and light commercial EVs complete the vehicle scope. Upgrade scope includes preventive maintenance and performance retrofit. Safety retrofit and diagnostics are covered as service extensions. Service provider scope includes OEM workshops and independent garages.
Fleet depots and battery repair centers complete the service route. Thermal component scope includes coolant pumps and chillers. Valves and sensors are included when they directly support battery pack temperature control. Revenue scope covers 2026 to 2036. Key stakeholders include automakers, authorized EV workshops, fleet service centers, battery repair centers, thermal component suppliers, diagnostic tool providers, high-voltage service technicians, and EV fleet operators.
EV Battery Thermal Management Upgrade Services Market Exclusions
Scope excludes general engine cooling work and fuel vehicle radiator repair. Non-traction battery service is outside coverage. Battery cell replacement is excluded unless thermal service is bundled with the battery pack repair. Cabin HVAC work is excluded unless energy-efficient EV cabin HVAC or heat pump service directly changes pack temperature control.
EV Battery Thermal Management Upgrade Services Market Research Methodology
- Primary Research: FMI analysts reviewed EV service centers and battery repair firms across major EV countries. Thermal component suppliers were checked for product fit and service depth.
- Desk Research: Public data from IEA and national vehicle agencies was checked with official company thermal service releases.
- Market Sizing and Forecasting: Market size was estimated through EV fleet aging and service frequency. Average repair ticket and fleet upgrade activity were used for forecast checks.
- Data Validation: Forecast checks compared EV sales and battery use. Thermal service tool activity was reviewed across commercial fleets and passenger EVs.
Why is the EV Battery Thermal Management Upgrade Services Market Growing?
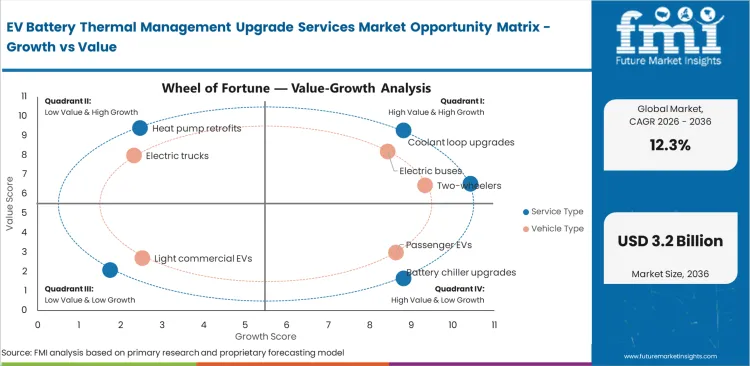
- EV fleet aging is creating demand for coolant checks and pump replacement as battery packs move beyond early service life.
- Fast charging puts more heat into the battery pack, which makes coolant flow and chiller performance more important.
- Commercial EV fleets need planned thermal maintenance because downtime can affect routes and charging schedules.
Battery thermal service demand is rising as high-voltage packs become larger and more expensive to repair. The IEA reported that EV battery use reached 1.2 TWh in 2025, with light-duty vehicles using over 85.0% of that volume. Larger packs make a cooling fault more costly for fleets and private EV owners. Service centers can add value by checking coolant quality and confirming leak-free battery cooling work before pack-level damage occurs.
Charging behavior is creating another service need. The IEA reported that average public charging power rose from just above 40.0 kW to nearly 50.0 kW in 2025. Higher charging power puts more heat into the battery during shorter charging sessions. Weak coolant pumps and blocked coolant lines become easier to detect under higher heat load. Workshops with coolant evacuation tools and high-voltage safety training can support EV owners before charging speed drops.
Market Segmentation Analysis
- In 2026, coolant loop upgrades are expected to account for 38.4% share.
- Electric buses are forecast to represent 34.6% share of vehicle type demand in 2026.
- Preventive maintenance is anticipated at 42.7% share of upgrade scope demand in 2026.
- OEM workshops are expected to capture 44.9% share of service provider demand in 2026.
- Coolant pumps are forecast to take 31.8% share of thermal component demand in 2026.
Market segmentation is divided into five primary groups. Service type and vehicle type define demand. Upgrade scope and service provider define service route. Thermal component completes the structure. Service type includes coolant loop upgrades and battery chiller upgrades. Heat pump retrofits and software recalibration complete the group. Vehicle type covers electric buses and passenger EVs. Electric trucks and light commercial EVs form the next service pool. Upgrade scope includes preventive maintenance and performance retrofit. Safety retrofit and diagnostics complete the group. Service provider covers OEM workshops and independent garages. Fleet depots and battery centers complete service coverage. Thermal component includes coolant pumps and chillers. Valves and sensors complete the component view.
Insights into EV Battery Thermal Management Upgrade Services Market by Service Type
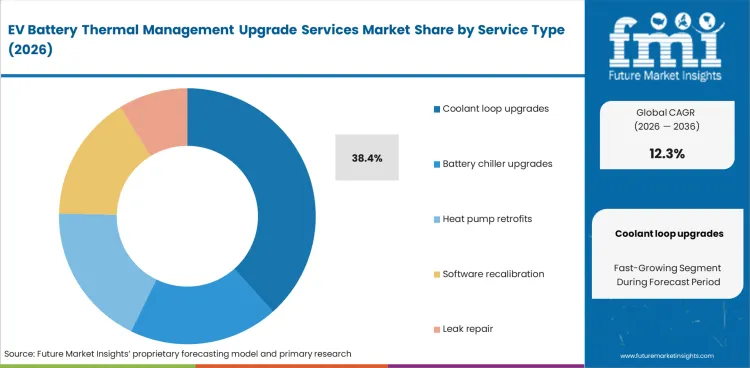
- Coolant loop upgrades are expected to account for 38.4% share in 2026 as older EV battery packs need cleaner flow and safer coolant refill. Air pockets or weak coolant movement can raise battery temperature during charging, so workshops use pressure checks and controlled filling to protect pack life.
- Battery chiller upgrades are becoming more important as fast charging puts extra heat into the pack. Heat pump retrofits support colder regions because battery warming can improve charging speed and daily vehicle use.
Insights into EV Battery Thermal Management Upgrade Services Market by Vehicle Type
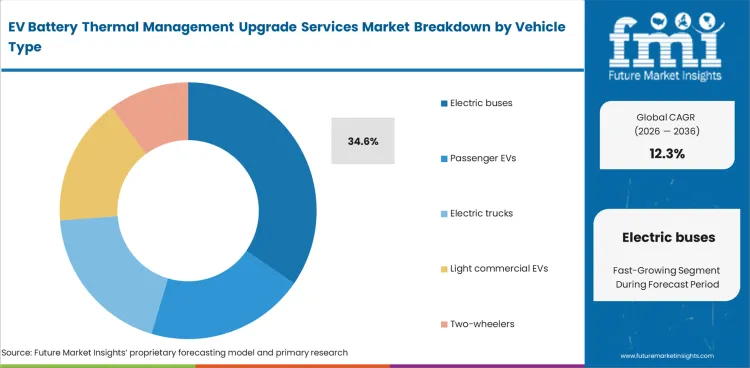
- Electric buses are forecast to hold 34.6% share in 2026 because depot fleets run fixed routes and need planned service before thermal faults affect operations. Larger battery packs and overnight charging make coolant pump checks a regular service need for bus operators.
- Passenger EVs create steady workshop volume as older vehicles move into second-owner use. Electric trucks need higher-value service because towing load and long charging sessions put more stress on battery cooling systems.
Insights into EV Battery Thermal Management Upgrade Services Market by Upgrade Scope
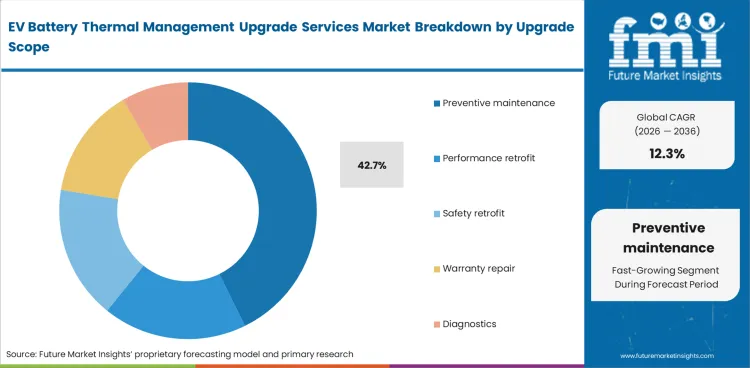
- Preventive maintenance is expected to represent 42.7% share in 2026. Fleet operators prefer early coolant checks before battery warnings appear. Planned inspection is easier to manage than urgent pack repair after repeated overheating alerts.
- Performance retrofit work is rising as fleets use faster charging and need stable battery temperature control. Safety retrofit work supports older EVs by improving sensor checks and fault detection.
Insights into EV Battery Thermal Management Upgrade Services Market by Service Provider
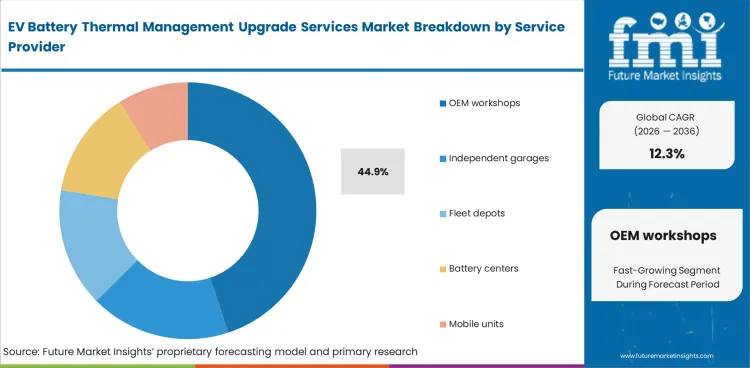
- OEM workshops are forecast to capture 44.9% share in 2026 because high-voltage battery work needs trained technicians and approved service steps. Warranty access gives OEM outlets an advantage when fleets need repair records for battery claims.
- Independent garages are building service depth as more EVs move beyond warranty coverage. Battery centers and fleet depots can add thermal service work once technicians are trained in coolant handling and high-voltage safety.
Insights into EV Battery Thermal Management Upgrade Services Market by Thermal Component
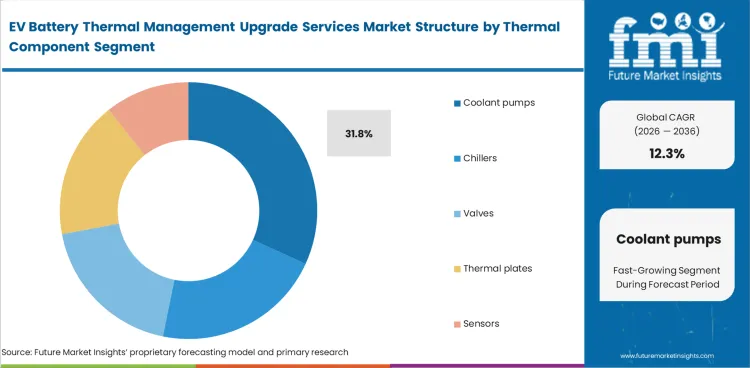
- Coolant pumps are expected to hold 31.8% share in 2026 as weak flow and pump noise create clear service tickets. Pump replacement gives workshops a simple repair route for restoring battery temperature control.
- Chillers and valves support higher service value because refrigerant-side checks need trained diagnosis. Sensors and thermal plates complete many upgrades as technicians confirm temperature readings and cooling contact after repair.
EV Battery Thermal Management Upgrade Services Market Drivers, Restraints, and Opportunities
- Fast-charging heat load is increasing demand for coolant pump checks and battery chiller upgrades.
- High-voltage safety rules and limited technician skills can slow independent workshop adoption.
- Fleet depot service creates an opportunity for zonal heat pump cabin HVAC checks and mobile diagnostics.
Fast-Charging Heat Load Raises Service Need
Fast charging is turning battery cooling into a regular service task. The IEA counted about 160.0 battery electric vehicle (BEV) models able to charge above 150.0 kW in 2025. Higher charging power can expose weak coolant pumps and poor chiller performance during repeated charging. Service centers can use diagnostics and controlled coolant refill to restore heat transfer before the vehicle reduces charging speed. Fleet operators will prefer workshops that can provide clear repair records and safer battery checks.
High-Voltage Safety Limits Small Garage Entry
Battery cooling service needs more care than normal coolant replacement. Technicians must isolate the high-voltage system before working near pack cooling lines. Poor coolant handling can create air pockets and raise the risk of later battery temperature faults. Small garages may delay entry until training and tools become affordable. Certified EV workshops will have an advantage because fleets need proof that the repair was completed safely.
Analysis of EV Battery Thermal Management Upgrade Services Market by Key Countries
.webp "Top Country Growth Comparison Ev Battery Thermal Management Upgrade Services Market Cagr (2026 2036)")
| Country | CAGR |
|---|---|
| India | 14.6% |
| China | 13.8% |
| United Kingdom | 12.7% |
| Germany | 11.9% |
| France | 11.2% |
| United States | 9.8% |
| Japan | 8.9% |
Source: Future Market Insights, 2026.
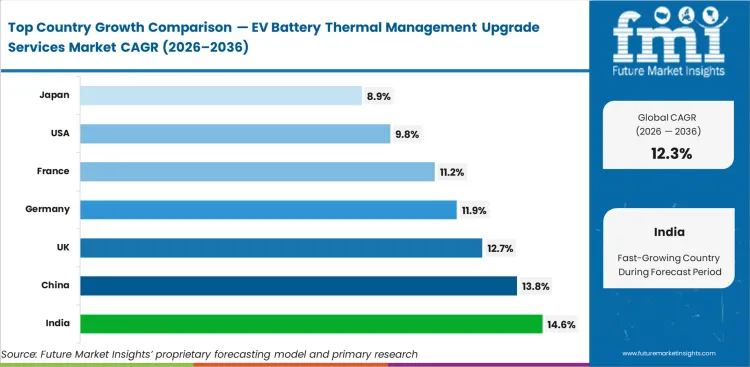
EV Battery Thermal Management Upgrade Services Market CAGR Analysis by Country
- India is forecast to record a 14.6% CAGR between 2026 and 2036.
- China is expected to expand at 13.8% CAGR during the forecast period.
- United Kingdom demand is anticipated to advance at 12.7% CAGR by 2036.
- Germany is forecast at 11.9% CAGR across the forecast decade.
- France is expected to rise at 11.2% CAGR by 2036.
- United States demand is likely to expand at 9.8% CAGR.
- Japan is forecast to post 8.9% CAGR during the forecast period.
- EV battery thermal management upgrade services demand is forecast to rise at 12.3% CAGR.
Demand Outlook for EV Battery Thermal Management Upgrade Services Market in India
The market in India is expected to expand at 14.6% CAGR through 2036 as electric buses and passenger EVs enter regular service cycles. The IEA recorded 165.0 thousand electric car sales in India in 2025 after a 75.0% annual increase. Young EV fleets will need trained technicians as battery warranties move closer to major service checks. Thermal service providers should focus on depot operators and high-use passenger EV fleets because uptime needs will guide service choices.
- State transport fleets need thermal checks for buses that charge at fixed depots.
- Passenger EV workshops need safer coolant refill steps as used EVs enter service.
- Local assembly by thermal suppliers can improve parts access and technician training.
Sales Analysis of EV Battery Thermal Management Upgrade Services Market in China
China is forecast to rise at 13.8% CAGR through 2036 due to its deep EV service pool. Electric car sales in China crossed 13.0 million units in 2025, with nearly 55.0% share of new car sales. Large EV fleets and heavy fast-charging use increase the need for coolant pump replacement and chiller repair. Service firms with high-volume repair capacity and clear test steps will be preferred by fleet depots and used-EV platforms.
- High EV production creates broad demand for battery cooling diagnostics and parts.
- Commercial EV fleets need fast coolant service to protect depot charging schedules.
- Battery supply depth supports local access to valves and thermal plates.
Future Outlook for EV Battery Thermal Management Upgrade Services Market in the United Kingdom
Zero-emission vehicle rules are pushing more EVs into service lanes in the United Kingdom. The industry outlook points to 12.7% CAGR through 2036 as used EVs move out of warranty coverage. The IEA reported that UK electric car sales increased by over 25.0% in 2025, with more than one in three new cars sold as electric. Independent workshops can expand if training and diagnostic tools keep pace with battery safety needs.
- Fleet leasing channels need battery cooling records to support used-EV resale value.
- Workshop networks can add battery thermal checks to routine EV service packages.
- Public fast charging raises attention on chiller performance during repeat charging.
Opportunity Analysis of EV Battery Thermal Management Upgrade Services Market in Germany
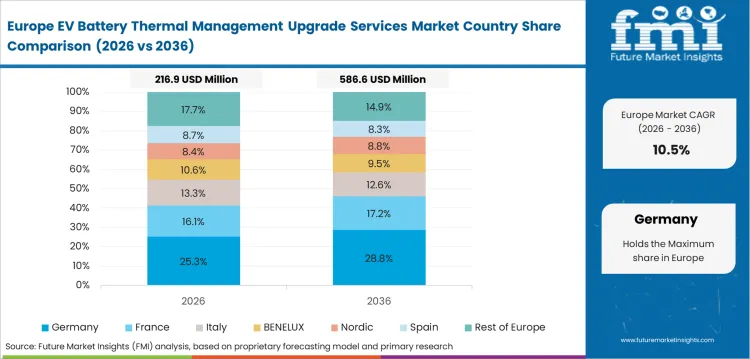
Germany has an established repair skill pool around premium EVs and vehicle thermal systems. The market is forecast to advance at 11.9% CAGR through 2036 as battery repair skills improve across service networks. The IEA recorded about 850.0 thousand electric car sales in Germany in 2025, with electric cars taking about 30.0% share of new car sales. Premium EV fleets create demand for documented coolant service and heat pump checks. Supplier margins will depend on proof of service quality.
- Automaker service networks need clear thermal steps for premium and fleet EV models.
- Thermal component suppliers create local repair knowledge around pumps and chillers.
- Battery repair centers can pair coolant service with pack health diagnostics.
Sales Analysis of EV Battery Thermal Management Upgrade Services Market in France
France benefits from domestic thermal suppliers and urban fleet electrification. Battery thermal service demand is expected to move ahead at 11.2% CAGR through 2036. The IEA stated that BEV sales in France increased by almost 15.0% in 2025. Fleet operators will need reliable cooling service as delivery EVs and shared vehicles run frequent charging cycles. Service providers should focus on chiller checks and software calibration for vehicles used in city operations.
- Thermal component knowledge supports repair depth around heat pumps and refrigerant valves.
- Urban fleets need short service windows and clear cooling system fault records.
- Battery centers can add thermal inspection to existing pack diagnostic work.
Demand Outlook for EV Battery Thermal Management Upgrade Services Market in the United States
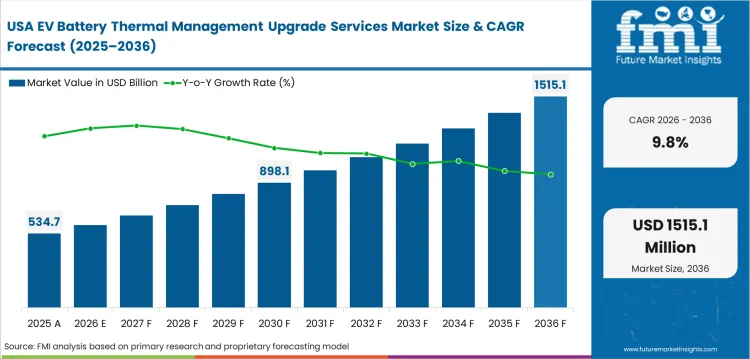
A large EV fleet gives the United States steady thermal service volume. The IEA estimated about 1.5 million electric car sales in 2025, with electric cars taking around 10.0% share of new car sales. The market is expected to record 9.8% CAGR through 2036 as pickup and SUV battery packs add more thermal load during towing and fast charging. Service firms with coolant flow testing and refrigerant-side skills can stand out as repair work moves beyond tires and brakes.
- High-capacity EV packs need better cooling service during repeated fast charging.
- Fleet vans create demand for planned checks to reduce route disruption.
- Independent workshops need battery safety tools before entering pack cooling repair.
Future Outlook for EV Battery Thermal Management Upgrade Services Market in Japan
Japan is forecast to post 8.9% CAGR through 2036 as BEV uptake grows at a slower pace than larger EV markets. The IEA recorded just above 100.0 thousand electric car sales in Japan in 2025, with electric cars below 3.0% share of new car sales. Hybrid service knowledge gives workshops a useful repair foundation, but BEV battery cooling needs different tools. Premium imports and commercial EV pilots is expected to create early thermal upgrade demand.
- Service centers need clear separation between hybrid cooling tasks and BEV battery loops.
- Commercial pilots create selective demand for coolant service and sensor checks.
- Precision repair culture supports premium diagnostic work once EV volumes rise.
Competitive Landscape and Strategic Positioning
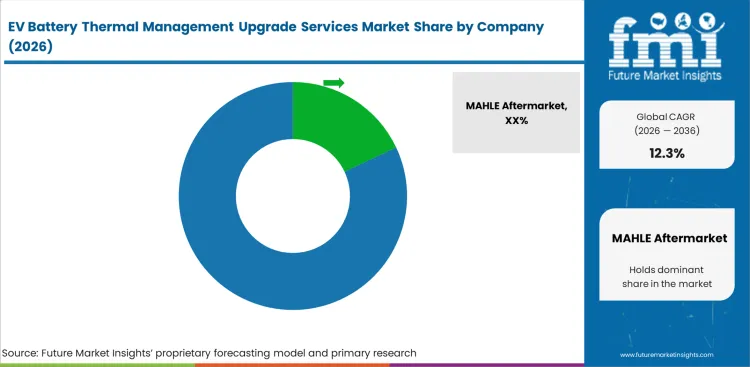
- Competition centers on high-voltage safety training and validated battery diagnostic steps.
- Thermal component suppliers stand out when pumps and chillers come with clear repair guidance.
- Service networks can win fleet work through warranty access and proof-based battery reports.
- Entry barriers include battery safety certification and OEM service information access.
Supplier positioning is shifting toward service packages that combine parts and diagnostics. Key players such as MAHLE holds a strong position through batteryPRO service tools, which support battery checks and coolant service work. Webasto supports battery temperature control for commercial EVs through dedicated thermal modules. BorgWarner and Valeo add hardware depth through heaters and refrigerant valves. Grayson Thermal Systems focuses on heavy EV thermal modules for buses and trucks, which keeps fleet service work central to its role.
Component suppliers have an advantage because battery thermal repair depends on system design knowledge. Hanon Systems supports EV service demand through electric compressor and thermal module capability. DENSO supports battery monitoring through cell supervision and thermal electronics. Independent service firms can win work if battery diagnostics and coolant handling are documented clearly. Fleet operators will prefer repair partners that can prove safe handling and stable thermal performance after service.
Key Companies in the EV Battery Thermal Management Upgrade Services Market
- Thermal Service Tool Providers: MAHLE Aftermarket holds a strong position through BatteryPRO diagnostics and coolant service tools.
- Battery Cooling Hardware Suppliers: Webasto SE and BorgWarner Inc. support heaters and chillers. Valeo SA and Hanon Systems support valves and thermal modules.
- System Electronics and Fleet Specialists: DENSO Corporation and Grayson Thermal Systems support battery monitoring and heavy EV thermal modules.
Competitive Benchmarking: EV Battery Thermal Management Upgrade Services Market
| Company | Cooling Service Depth | Thermal Hardware Breadth | Diagnostic Support | Geographic Footprint |
|---|---|---|---|---|
| MAHLE Aftermarket | High | Medium | High | Europe and India strength |
| Webasto SE | Medium | High | Medium | Europe and commercial EV focus |
| BorgWarner Inc. | Medium | High | Medium | Global OEM supply depth |
| Valeo SA | Medium | High | Medium | Europe and global OEM reach |
| Hanon Systems | Medium | High | Medium | Asia and North America depth |
| DENSO Corporation | Medium | Medium | High | Japan and global OEM reach |
| Grayson Thermal Systems | High | Medium | Medium | Heavy EV fleet focus |
Source: Future Market Insights competitive analysis, 2026.
Key Developments in EV Battery Thermal Management Upgrade Services Market
- In July 2025, BorgWarner secured eHeater contracts with two major global OEMs for high-voltage coolant heater technology across plug-in hybrid platforms.
- In November 2025, Valeo received CES Innovation Awards 2026 recognition for its compact 5-Ways Refrigerant Valve for next-generation EV heat pump systems.
Key Players in the EV Battery Thermal Management Upgrade Services Market
Major Global Players
- MAHLE Aftermarket
- Webasto SE
- BorgWarner Inc.
- Valeo SA
- Hanon Systems
- DENSO Corporation
Specialist and Regional Players
- Grayson Thermal Systems
- Modine Manufacturing Company
- AVL DiTEST GmbH
- HELLA Gutmann Solutions GmbH
Report Scope and Coverage
| Parameter | Details |
|---|---|
| Quantitative Units | USD 1.0 billion to USD 3.2 billion at 12.3% CAGR |
| Market Definition | Service work for EV battery cooling circuits and heat pumps. Chillers and thermal controls are included. |
| Regions Covered | North America, Latin America, Western Europe, Eastern Europe, East Asia, South Asia Pacific, Middle East and Africa. |
| Countries Covered | United States, China, India, Germany, France, Japan, and United Kingdom. |
| Key Companies Profiled | MAHLE Aftermarket, Webasto SE, BorgWarner Inc., Valeo SA, Hanon Systems, DENSO Corporation, and Grayson Thermal Systems. |
| Forecast Period | 2026 to 2036 |
| Approach | Hybrid bottom-up and top-down method using EV parc aging and service ticket value. Fleet duty cycle and supplier activity supported forecast checks. |
Source: Future Market Insights, 2026.
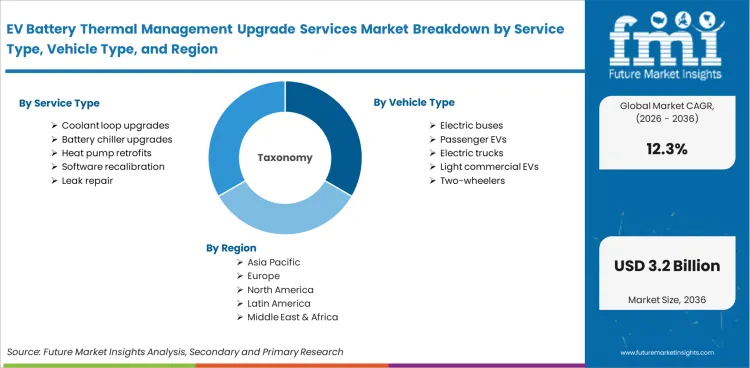
EV Battery Thermal Management Upgrade Services Market Breakdown by Service Type, Vehicle Type, Upgrade Scope, Service Provider, Thermal Component, and Region
EV Battery Thermal Management Upgrade Services Market Segmented by Service Type
- Coolant loop upgrades
- Battery chiller upgrades
- Heat pump retrofits
- Software recalibration
- Leak repair
EV Battery Thermal Management Upgrade Services Market Segmented by Vehicle Type
- Electric buses
- Passenger EVs
- Electric trucks
- Light commercial EVs
- Two-wheelers
EV Battery Thermal Management Upgrade Services Market Segmented by Upgrade Scope
- Preventive maintenance
- Performance retrofit
- Safety retrofit
- Warranty repair
- Diagnostics
EV Battery Thermal Management Upgrade Services Market Segmented by Service Provider
- OEM workshops
- Independent garages
- Fleet depots
- Battery centers
- Mobile units
EV Battery Thermal Management Upgrade Services Market Segmented by Thermal Component
- Coolant pumps
- Chillers
- Valves
- Thermal plates
- Sensors
EV Battery Thermal Management Upgrade Services Market by Region
- North America
- Latin America
- Western Europe
- Eastern Europe
- East Asia
- South Asia and Pacific
- Middle East and Africa
Research Sources and Bibliography
- National Highway Traffic Safety Administration, Department of Transportation. (2025, February 14). Federal motor vehicle safety standards; FMVSS No. 305a electric-powered vehicles: Electric powertrain integrity, Global Technical Regulation No. 20; incorporation by reference. Federal Register.
- MAHLE GmbH. (2025, May 8). MAHLE: Market launch of E-CARE Fluid in Europe. MAHLE.
- FORVIA HELLA. (2025, May 6). HELLA returns to the aftermarket thermal management component business. HELLA.
- International Energy Agency. (2026, May 20). Electric vehicle batteries. International Energy Agency.
- International Energy Agency. (2026, May 20). Electric vehicle charging. International Energy Agency.
- International Energy Agency. (2026, May 20). Trends in electric cars. International Energy Agency.
- BorgWarner Inc. (2025, July 31). BorgWarner secures eHeater contracts for hybrid applications with two major global OEMs. BorgWarner.
- Valeo. (2025, November 6). Valeo named as CES Innovation Awards® 2026 honoree for its compact 5-Ways Refrigerant Valve for next-generation electric vehicles’ heat pump systems. Valeo.
This Report Answers
- What is the current market size of EV battery thermal management upgrade services?
- How much revenue is forecast for 2036 and what CAGR supports the forecast?
- Which service type is expected to lead demand in 2026?
- Which vehicle type offers the main service opportunity in 2026?
- Which countries are forecast to grow faster than the global market?
- How do coolant loop upgrades and battery chiller upgrades affect service revenue?
- Which service providers are better placed to win EV fleet accounts?
- How was the market size estimated and validated?
Frequently Asked Questions
What is the EV battery thermal management upgrade services revenue in 2026?
EV battery thermal management upgrade services market is expected to reach USD 1.0 billion in 2026.
What is the forecast value of the market by 2036?
Market revenue is forecast to reach USD 3.2 billion by 2036.
What CAGR is expected from 2026 to 2036?
Demand is expected to expand at 12.3% CAGR during the forecast period.
Which service type is expected to lead in 2026?
Coolant loop upgrades are expected to lead with 38.4% share of service type demand in 2026.
Which vehicle type is expected to hold a strong share?
Electric buses are forecast to hold 34.6% share of vehicle type demand in 2026.
Which country is expected to grow fastest?
India is expected to lead country demand at 14.6% CAGR during the forecast period.
Which companies are active in the market?
MAHLE Aftermarket and Webasto SE are active suppliers. BorgWarner Inc. and Valeo SA support the same service pool. Hanon Systems and DENSO Corporation add thermal electronics depth. Grayson Thermal Systems supports heavy EV work.
What creates the main service opportunity?
Main opportunity comes from coolant loop service and chiller replacement as EV fleets age and charging speeds rise.
Preview the report firsthand - request a free sample
Get SampleGet the brochure for pricing and purchase details.
Get PDFTable of Content
- Key Takeaways
- Market Size and CAGR
- Top Growth Driver
- Fastest Growing Segment
- Leading Region
- Key Companies
- Emerging Opportunities
- Executive Summary
- Global Market Outlook
- Demand-side Trends
- Supply-side Trends
- Technology Roadmap Analysis
- Analysis and Recommendations
- Analyst Perspective (What is happening? Why now? What should investors know?)
- Key Questions Answered
- How large is the market?
- What is the CAGR?
- What are key trends?
- Which region dominates?
- Who are the leaders?
- Market Overview
- Market Coverage / Taxonomy
- Market Definition / Scope / Limitations
- Research Methodology
- Chapter Orientation
- Analytical Lens and Working Hypotheses
- Market Structure, Signals, and Trend Drivers
- Benchmarking and Cross-market Comparability
- Market Sizing, Forecasting, and Opportunity Mapping
- Research Design and Evidence Framework
- Desk Research Programme (Secondary Evidence)
- Expert Input and Fieldwork (Primary Evidence)
- Tooling, Models, and Reference Databases
- Data Engineering and Model Build
- Quality Assurance and Audit Trail
- Market Background
- Market Dynamics (Drivers, Restraints, Opportunity, Trends)
- Scenario Forecast (Optimistic, Likely, Conservative)
- Impact Analysis
- AI Impact
- Sustainability Impact
- Regulatory Impact
- Technology Impact
- Consumer / Buyer Analysis
- Purchase Drivers
- Adoption Barriers
- Buyer Journey
- Opportunity Map Analysis
- Product Life Cycle Analysis
- Supply Chain Analysis
- Investment Feasibility Matrix
- Value Chain Analysis
- PESTLE and Porter's Analysis
- Regulatory Landscape
- Regional Parent Market Outlook
- Production and Consumption Statistics
- Import and Export Statistics
- Global Market Analysis and Forecast, 2021 to 2036
- Historical Market Size Value (USD Billion) & Volume (Unit) Analysis, 2021 to 2025
- Current and Future Market Size Value (USD Billion) & Volume (Unit) Projections, 2026 to 2036
- Y-o-Y Growth Trend Analysis
- Absolute $ Opportunity Analysis
- Global Market Pricing Analysis, 2021 to 2036
- Global Market Analysis and Forecast, By Service Type, 2021 to 2036
- Introduction / Key Findings
- Historical Market Size Value (USD Billion) & Volume (Unit) Analysis By Service Type, 2021 to 2025
- Current and Future Market Size Value (USD Billion) & Volume (Unit) Analysis and Forecast By Service Type, 2026 to 2036
- Coolant loop upgrades
- Battery chiller upgrades
- Heat pump retrofits
- Software recalibration
- Leak repair
- Coolant loop upgrades
- Y-o-Y Growth Trend Analysis By Service Type, 2021 to 2025
- Absolute $ Opportunity Analysis By Service Type, 2026 to 2036
- Global Market Analysis and Forecast, By Vehicle Type, 2021 to 2036
- Introduction / Key Findings
- Historical Market Size Value (USD Billion) & Volume (Unit) Analysis By Vehicle Type, 2021 to 2025
- Current and Future Market Size Value (USD Billion) & Volume (Unit) Analysis and Forecast By Vehicle Type, 2026 to 2036
- Electric buses
- Passenger EVs
- Electric trucks
- Light commercial EVs
- Two-wheelers
- Electric buses
- Y-o-Y Growth Trend Analysis By Vehicle Type, 2021 to 2025
- Absolute $ Opportunity Analysis By Vehicle Type, 2026 to 2036
- Global Market Analysis and Forecast, By Upgrade Scope, 2021 to 2036
- Introduction / Key Findings
- Historical Market Size Value (USD Billion) & Volume (Unit) Analysis By Upgrade Scope, 2021 to 2025
- Current and Future Market Size Value (USD Billion) & Volume (Unit) Analysis and Forecast By Upgrade Scope, 2026 to 2036
- Preventive maintenance
- Performance retrofit
- Safety retrofit
- Warranty repair
- Diagnostics
- Preventive maintenance
- Y-o-Y Growth Trend Analysis By Upgrade Scope, 2021 to 2025
- Absolute $ Opportunity Analysis By Upgrade Scope, 2026 to 2036
- Global Market Analysis and Forecast, By Service Provider, 2021 to 2036
- Introduction / Key Findings
- Historical Market Size Value (USD Billion) & Volume (Unit) Analysis By Service Provider, 2021 to 2025
- Current and Future Market Size Value (USD Billion) & Volume (Unit) Analysis and Forecast By Service Provider, 2026 to 2036
- OEM workshops
- Independent garages
- Fleet depots
- Battery centers
- Mobile units
- OEM workshops
- Y-o-Y Growth Trend Analysis By Service Provider, 2021 to 2025
- Absolute $ Opportunity Analysis By Service Provider, 2026 to 2036
- Global Market Analysis and Forecast, By Thermal Component, 2021 to 2036
- Introduction / Key Findings
- Historical Market Size Value (USD Billion) & Volume (Unit) Analysis By Thermal Component, 2021 to 2025
- Current and Future Market Size Value (USD Billion) & Volume (Unit) Analysis and Forecast By Thermal Component, 2026 to 2036
- Coolant pumps
- Chillers
- Valves
- Thermal plates
- Sensors
- Coolant pumps
- Y-o-Y Growth Trend Analysis By Thermal Component, 2021 to 2025
- Absolute $ Opportunity Analysis By Thermal Component, 2026 to 2036
- Global Market Analysis and Forecast, By Region, 2021 to 2036
- Introduction
- Historical Market Size Value (USD Billion) & Volume (Unit) Analysis By Region, 2021 to 2025
- Current Market Size Value (USD Billion) & Volume (Unit) Analysis and Forecast By Region, 2026 to 2036
- North America
- Latin America
- Western Europe
- Eastern Europe
- East Asia
- South Asia and Pacific
- Middle East & Africa
- Market Attractiveness Analysis By Region
- North America Market Analysis and Forecast, By Country, 2021 to 2036
- Historical Market Size Value (USD Billion) & Volume (Unit) Trend Analysis By Market Taxonomy, 2021 to 2025
- Market Size Value (USD Billion) & Volume (Unit) Forecast By Market Taxonomy, 2026 to 2036
- By Country
- USA
- Canada
- Mexico
- By Service Type
- By Vehicle Type
- By Upgrade Scope
- By Service Provider
- By Thermal Component
- By Country
- Market Attractiveness Analysis
- By Country
- By Service Type
- By Vehicle Type
- By Upgrade Scope
- By Service Provider
- By Thermal Component
- Key Takeaways
- Latin America Market Analysis and Forecast, By Country
- Historical Market Size Value (USD Billion) & Volume (Unit) Trend Analysis By Market Taxonomy, 2021 to 2025
- Market Size Value (USD Billion) & Volume (Unit) Forecast By Market Taxonomy, 2026 to 2036
- By Country
- Brazil
- Chile
- Rest of Latin America
- By Service Type
- By Vehicle Type
- By Upgrade Scope
- By Service Provider
- By Thermal Component
- By Country
- Market Attractiveness Analysis
- By Country
- By Service Type
- By Vehicle Type
- By Upgrade Scope
- By Service Provider
- By Thermal Component
- Key Takeaways
- Western Europe Market Analysis and Forecast, By Country
- Historical Market Size Value (USD Billion) & Volume (Unit) Trend Analysis By Market Taxonomy, 2021 to 2025
- Market Size Value (USD Billion) & Volume (Unit) Forecast By Market Taxonomy, 2026 to 2036
- By Country
- Germany
- UK
- Italy
- Spain
- France
- Nordic
- BENELUX
- Rest of Western Europe
- By Service Type
- By Vehicle Type
- By Upgrade Scope
- By Service Provider
- By Thermal Component
- By Country
- Market Attractiveness Analysis
- By Country
- By Service Type
- By Vehicle Type
- By Upgrade Scope
- By Service Provider
- By Thermal Component
- Key Takeaways
- Eastern Europe Market Analysis and Forecast, By Country
- Historical Market Size Value (USD Billion) & Volume (Unit) Trend Analysis By Market Taxonomy, 2021 to 2025
- Market Size Value (USD Billion) & Volume (Unit) Forecast By Market Taxonomy, 2026 to 2036
- By Country
- Russia
- Poland
- Hungary
- Balkan & Baltic
- Rest of Eastern Europe
- By Service Type
- By Vehicle Type
- By Upgrade Scope
- By Service Provider
- By Thermal Component
- By Country
- Market Attractiveness Analysis
- By Country
- By Service Type
- By Vehicle Type
- By Upgrade Scope
- By Service Provider
- By Thermal Component
- Key Takeaways
- East Asia Market Analysis and Forecast, By Country
- Historical Market Size Value (USD Billion) & Volume (Unit) Trend Analysis By Market Taxonomy, 2021 to 2025
- Market Size Value (USD Billion) & Volume (Unit) Forecast By Market Taxonomy, 2026 to 2036
- By Country
- China
- Japan
- South Korea
- By Service Type
- By Vehicle Type
- By Upgrade Scope
- By Service Provider
- By Thermal Component
- By Country
- Market Attractiveness Analysis
- By Country
- By Service Type
- By Vehicle Type
- By Upgrade Scope
- By Service Provider
- By Thermal Component
- Key Takeaways
- South Asia and Pacific Market Analysis and Forecast, By Country
- Historical Market Size Value (USD Billion) & Volume (Unit) Trend Analysis By Market Taxonomy, 2021 to 2025
- Market Size Value (USD Billion) & Volume (Unit) Forecast By Market Taxonomy, 2026 to 2036
- By Country
- India
- ASEAN
- Australia & New Zealand
- Rest of South Asia and Pacific
- By Service Type
- By Vehicle Type
- By Upgrade Scope
- By Service Provider
- By Thermal Component
- By Country
- Market Attractiveness Analysis
- By Country
- By Service Type
- By Vehicle Type
- By Upgrade Scope
- By Service Provider
- By Thermal Component
- Key Takeaways
- Middle East & Africa Market Analysis and Forecast, By Country
- Historical Market Size Value (USD Billion) & Volume (Unit) Trend Analysis By Market Taxonomy, 2021 to 2025
- Market Size Value (USD Billion) & Volume (Unit) Forecast By Market Taxonomy, 2026 to 2036
- By Country
- Kingdom of Saudi Arabia
- Other GCC Countries
- Türkiye
- South Africa
- Other African Union
- Rest of Middle East & Africa
- By Service Type
- By Vehicle Type
- By Upgrade Scope
- By Service Provider
- By Thermal Component
- By Country
- Market Attractiveness Analysis
- By Country
- By Service Type
- By Vehicle Type
- By Upgrade Scope
- By Service Provider
- By Thermal Component
- Key Takeaways
- Key Countries Market Analysis
- USA
- Pricing Analysis
- Market Share Analysis, 2025
- By Service Type
- By Vehicle Type
- By Upgrade Scope
- By Service Provider
- By Thermal Component
- Canada
- Pricing Analysis
- Market Share Analysis, 2025
- By Service Type
- By Vehicle Type
- By Upgrade Scope
- By Service Provider
- By Thermal Component
- Mexico
- Pricing Analysis
- Market Share Analysis, 2025
- By Service Type
- By Vehicle Type
- By Upgrade Scope
- By Service Provider
- By Thermal Component
- Brazil
- Pricing Analysis
- Market Share Analysis, 2025
- By Service Type
- By Vehicle Type
- By Upgrade Scope
- By Service Provider
- By Thermal Component
- Chile
- Pricing Analysis
- Market Share Analysis, 2025
- By Service Type
- By Vehicle Type
- By Upgrade Scope
- By Service Provider
- By Thermal Component
- Germany
- Pricing Analysis
- Market Share Analysis, 2025
- By Service Type
- By Vehicle Type
- By Upgrade Scope
- By Service Provider
- By Thermal Component
- UK
- Pricing Analysis
- Market Share Analysis, 2025
- By Service Type
- By Vehicle Type
- By Upgrade Scope
- By Service Provider
- By Thermal Component
- Italy
- Pricing Analysis
- Market Share Analysis, 2025
- By Service Type
- By Vehicle Type
- By Upgrade Scope
- By Service Provider
- By Thermal Component
- Spain
- Pricing Analysis
- Market Share Analysis, 2025
- By Service Type
- By Vehicle Type
- By Upgrade Scope
- By Service Provider
- By Thermal Component
- France
- Pricing Analysis
- Market Share Analysis, 2025
- By Service Type
- By Vehicle Type
- By Upgrade Scope
- By Service Provider
- By Thermal Component
- India
- Pricing Analysis
- Market Share Analysis, 2025
- By Service Type
- By Vehicle Type
- By Upgrade Scope
- By Service Provider
- By Thermal Component
- ASEAN
- Pricing Analysis
- Market Share Analysis, 2025
- By Service Type
- By Vehicle Type
- By Upgrade Scope
- By Service Provider
- By Thermal Component
- Australia & New Zealand
- Pricing Analysis
- Market Share Analysis, 2025
- By Service Type
- By Vehicle Type
- By Upgrade Scope
- By Service Provider
- By Thermal Component
- China
- Pricing Analysis
- Market Share Analysis, 2025
- By Service Type
- By Vehicle Type
- By Upgrade Scope
- By Service Provider
- By Thermal Component
- Japan
- Pricing Analysis
- Market Share Analysis, 2025
- By Service Type
- By Vehicle Type
- By Upgrade Scope
- By Service Provider
- By Thermal Component
- South Korea
- Pricing Analysis
- Market Share Analysis, 2025
- By Service Type
- By Vehicle Type
- By Upgrade Scope
- By Service Provider
- By Thermal Component
- Russia
- Pricing Analysis
- Market Share Analysis, 2025
- By Service Type
- By Vehicle Type
- By Upgrade Scope
- By Service Provider
- By Thermal Component
- Poland
- Pricing Analysis
- Market Share Analysis, 2025
- By Service Type
- By Vehicle Type
- By Upgrade Scope
- By Service Provider
- By Thermal Component
- Hungary
- Pricing Analysis
- Market Share Analysis, 2025
- By Service Type
- By Vehicle Type
- By Upgrade Scope
- By Service Provider
- By Thermal Component
- Kingdom of Saudi Arabia
- Pricing Analysis
- Market Share Analysis, 2025
- By Service Type
- By Vehicle Type
- By Upgrade Scope
- By Service Provider
- By Thermal Component
- Türkiye
- Pricing Analysis
- Market Share Analysis, 2025
- By Service Type
- By Vehicle Type
- By Upgrade Scope
- By Service Provider
- By Thermal Component
- South Africa
- Pricing Analysis
- Market Share Analysis, 2025
- By Service Type
- By Vehicle Type
- By Upgrade Scope
- By Service Provider
- By Thermal Component
- USA
- Market Structure Analysis
- Competition Dashboard
- Competition Benchmarking
- Market Share Analysis of Top Players
- By Regional
- By Service Type
- By Vehicle Type
- By Upgrade Scope
- By Service Provider
- By Thermal Component
- Emerging Startups
- Innovation Benchmarking
- Competition Analysis
- Competition Deep Dive
- MAHLE Aftermarket
- Overview
- Product Portfolio
- Profitability by Market Segments (Product/Region/Sales Channel)
- Sales Footprint
- Strategy Overview
- Marketing Strategy
- Product Strategy
- Channel Strategy
- Webasto SE
- BorgWarner Inc.
- Valeo SA
- Hanon Systems
- DENSO Corporation
- Grayson Thermal Systems
- MAHLE Aftermarket
- Case Studies
- Success Stories
- Recent Developments
- Competition Deep Dive
- Assumptions & Acronyms Used


