

- Market Size (2026)
- USD 35.0 Mn
- Forecast (2036)
- USD 85.0 Mn
- CAGR (2026 to 2036)
- 9.3%
How big is the green ammonia stabilizer additives market in 2026?
USD 35.0 million in 2026 and USD 85.0 million by 2036 at a 9.3% CAGR.
The green ammonia stabilizer additives industry value is forecast to grow from USD 32.0 million in 2025 to USD 85.0 million by 2036 at 9.3% CAGR as green ammonia projects create demand for ammonia-compatible pH control, corrosion protection, dosing stability, and low-emission formulation support. Additive function is forecast to represent 34.0% share in 2026 because buyers use stabilizer packages for several formulation roles. Waterborne chemistry is expected to secure 31.0% share in 2026, led by solvent reduction and stronger fit with water treatment and coating systems.
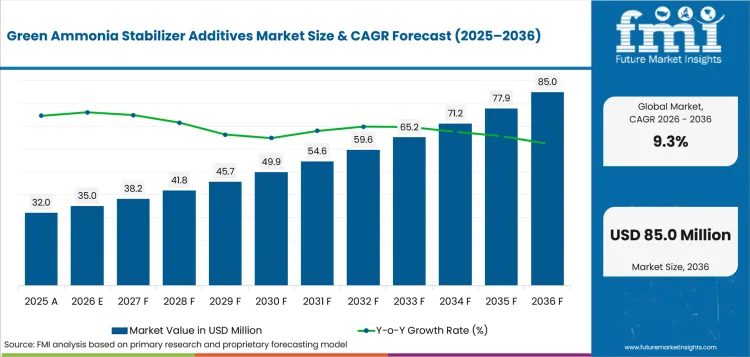
Green Ammonia Stabilizer Additives Market Overview: Size and Forecast
- 2026 Market Size: USD 35.0 million
- 2036 Market Size: USD 85.0 million
- Forecast CAGR: 9.3% from 2026 to 2036
- Leading Function: Additive
- Additive Function Share in 2026: 34.0%
- Leading Chemistry Type: Waterborne
- Waterborne Chemistry Share in 2026: 31.0%
- Fastest-growing Country: India
- India CAGR: 10.8% by 2036
Summary of the Green Ammonia Stabilizer Additives Market
- Demand and Growth Drivers
- Green ammonia handling needs are increasing demand for stabilizer packages that protect pH balance and formulation life.
- Water treatment and coating systems are using lower-solvent additives where ammonia compatibility must be proven.
- Fertilizer and industrial buyers are testing ammonia-linked additives as cleaner nitrogen systems enter procurement planning.
- Product and Segment View
- Additive function is forecast to represent 34.0% share in 2026, led by pH control, wetting, dispersion, and anti-foam roles.
- Waterborne chemistry is projected to hold 31.0% share in 2026, influenced by low-solvent formulation needs.
- Industrial manufacturing is expected to secure 30.0% share in 2026, supported by process chemical and coating qualification work.
- Geography and Competitive Outlook
- India is projected to record 10.8% CAGR by 2036, backed by fertilizer-linked green ammonia procurement.
- China is expected to expand at 10.4% CAGR by 2036 through ammonia co-firing and low-carbon power conversion programs.
- BASF and Arkema compete through specialty additive portfolios and waterborne formulation depth.
- LANXESS and Covestro focus on low-VOC additives, coating systems, and technical documentation.
- Analyst Opinion
- Nikhil Kaitwade, Senior Chemicals Analyst at FMI, observes, “Green ammonia stabilizer additives are moving from specification testing into early qualification. Buyers are not approving these products only for sustainability claims. They want proof for ammonia compatibility, pH control, corrosion behavior, and traceability. Suppliers that can combine formulation support with low-VOC evidence should gain stronger repeat orders.”
Green ammonia stabilizer additives are gaining value as hydrogen derivative projects move from policy planning into supplier qualification. The International Energy Agency reported that global hydrogen demand reached almost 100 million tonnes in 2024, while low-emissions hydrogen accounted for less than 1% of global production. Low-emissions hydrogen production from operational or final-investment-decision projects is set to reach 4.2 Mtpa by 2030. Yara opened a 24 MW renewable hydrogen plant at Heroya in June 2024, which supports renewable ammonia production and reduces site emissions by 41,000 tonnes of CO2 annually. These signals strengthen additive demand for storage, handling, formulation life, and documentation.
Which factors support expansion in the green ammonia stabilizer additives market?
Ammonia-compatible formulation revenue and lower-emission additive demand support market value across industrial channels.
- Market value is supported by stabilizer additive revenue before ammonia-linked storage and dosing projects move into wider commercial use.
- Supplier pricing reflects compatibility testing, safety files, and low-VOC documentation before bulk additive volumes expand.
- Revenue improves as fertilizer, coatings, water treatment, and industrial users test lower-carbon ammonia systems.
- Buyer trust rises as suppliers provide batch traceability, field support, and application-specific ammonia test evidence.
Why is the green ammonia stabilizer additives market growing?
Green ammonia projects need stabilizers that reduce corrosion risk and protect formulation life during storage and dosing.
Growth outlook has become more structured as hydrogen derivative projects start requiring material qualification beyond bulk ammonia production. The International Renewable Energy Agency reported in October 2024 that approximately 98% of ammonia value-chain emissions originate from the hydrogen production stage. This makes buyers more attentive to the additives used around lower-carbon ammonia systems. LANXESS introduced next-generation low-VOC additives in April 2026, while Arkema reported in January 2026 that more than 70% of its coating facilities had ISCC PLUS certification. These developments show how additive suppliers are aligning formulation stability with lower-emission documentation.
How is the green ammonia stabilizer additives market segmented?
The green ammonia stabilizer additives industry is segmented by chemistry type, function, application, end-use industry, and region.
- Waterborne chemistry is projected to secure 31.0% share in 2026, led by lower-solvent needs and compatibility with ammonia-linked water systems.
- Additive function is expected to capture 34.0% share in 2026, supported by pH control, wetting, dispersion, and process-aid performance.
- Water treatment is anticipated to hold 27.0% share in 2026, driven by ammonia control and dosing stability requirements.
- Industrial manufacturing is forecast to represent 30.0% share in 2026, shaped by process chemical and coating qualification trials.
- East Asia is expected to account for 28.0% regional share in 2026, supported by ammonia energy routes and low-carbon industrial programs.
Why does waterborne chemistry lead the green ammonia stabilizer additives market?
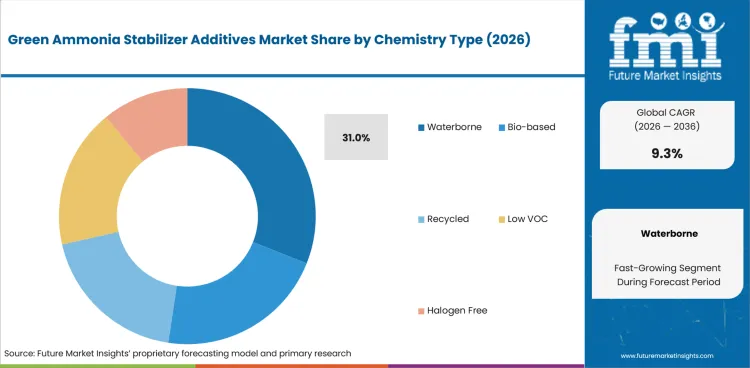
- Waterborne chemistry is projected to account for 31.0% share in 2026, influenced by lower-solvent requirements and stronger use in coatings, water treatment, and ammonia-linked formulations.
- Formulators prefer waterborne packages when they need odor control, dispersion stability, lower VOC contribution, and compatibility evidence across mixed chemical systems.
Which function leads the green ammonia stabilizer additives market?
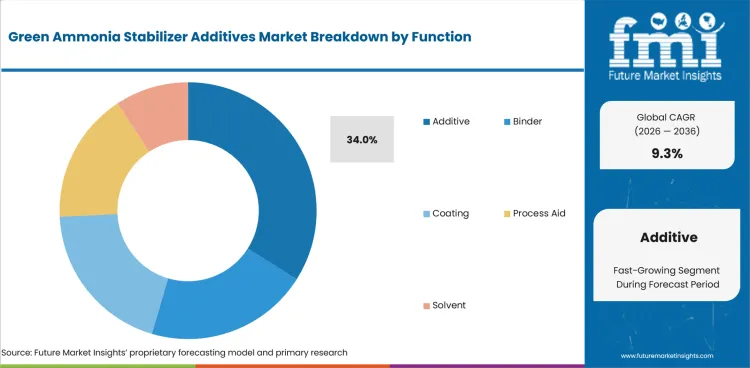
- Additive function is expected to hold 34.0% share in 2026, supported by stabilizer packages that combine pH control, wetting, dispersion, anti-foam, and process support.
- Buyers avoid narrow single-function products when ammonia contact can alter formulation behavior and create extra approval work for plant teams.
Which application leads the green ammonia stabilizer additives market?
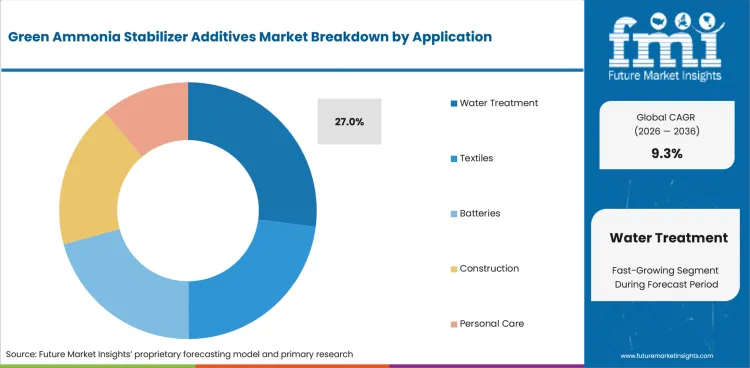
- Water treatment is anticipated to represent 27.0% share in 2026, reflected by ammonia control, dosing stability, and corrosion-aware process treatment needs.
- Municipal and industrial users value predictable dosing performance because ammonia-rich streams require stable additives and clear compatibility files.
Which end-use industry leads the green ammonia stabilizer additives market?
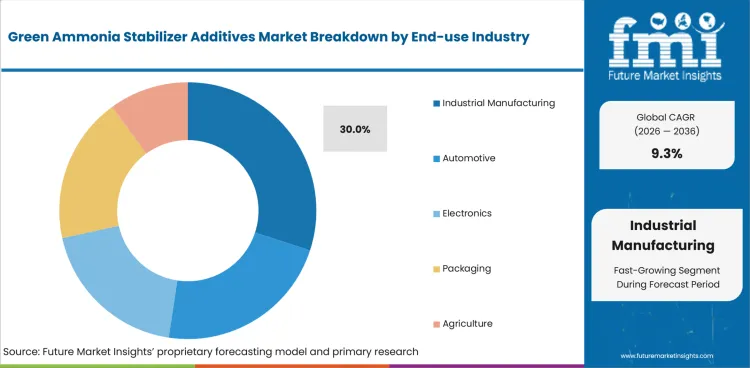
- Industrial manufacturing is projected to account for 30.0% share in 2026, led by early qualification in process chemicals, coatings, and ammonia-linked handling systems.
- Plant buyers often approve additives through trial batches before wider use, which rewards suppliers with safety files and technical service teams.
Which region leads the green ammonia stabilizer additives market?
- East Asia is expected to hold 28.0% share in 2026, supported by ammonia fuel policy, hydrogen derivative planning, and industrial chemical demand.
- Buyers in East Asia often require stronger documentation because ammonia-linked additives may be reviewed beside electronics, coatings, and specialty process inputs.
What are the driver, restraints, and opportunities in the green ammonia stabilizer additives market?
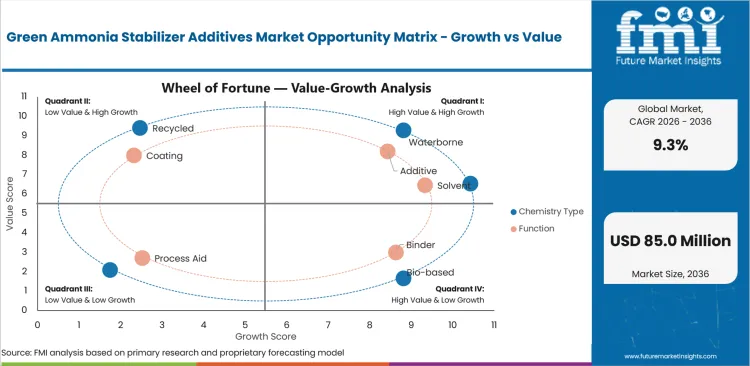
Ammonia compatibility and clean formulation standards support demand while validation cost and project timing restrict faster adoption.
- Driver: Ammonia-compatible formulation testing is becoming central as buyers need proof that additives survive pH and storage stress.
- Restraint: Certification and documentation costs can slow smaller suppliers that lack testing depth and traceability systems.
- Opportunity: Integrated low-VOC additive packages can expand across coatings, water treatment, and fertilizer-linked systems.
Ammonia Compatibility Testing
Ammonia compatibility is the central buying test because standard additives may not perform reliably in ammonia-linked systems. The U.S. Geological Survey reported in 2025 that U.S. ammonia was produced by 18 companies at 37 plants in 17 states during 2024. This production footprint shows why ammonia-linked buyers already understand handling risk and expect stabilizer suppliers to provide formulation proof before approving wider plant use.
Low-VOC Formulation Pressure
Low-VOC requirements support additive packages that work in waterborne systems without reducing film strength or stability. LANXESS stated in April 2026 that Bayferrox Scopeblue pigments deliver an approximate 35% carbon footprint reduction versus standard Bayferrox pigments. The same company introduced Koalex MFX as a multifunctional low-VOC coalescent for waterborne coatings. This supports stabilizer suppliers that link lower-emission chemistry with field performance.
Certification Cost Barrier
Certification cost remains a restraint because buyers often ask for carbon-footprint files, safety data, stability testing, and application evidence in one review package. Arkema reported in January 2026 that more than 70% of its coating facilities worldwide were ISCC PLUS certified, covering waterborne resins, rheology, and specialty additives. This shows how larger suppliers can meet documentation needs more easily than smaller additive firms.
Which countries are growing fastest in the green ammonia stabilizer additives market?
.webp "Top Country Growth Comparison Green Ammonia Stabilizer Additives Market Cagr (2026 2036)")
India 10.8% CAGR, China 10.4% CAGR, Germany 9.6% CAGR, Japan 9.4% CAGR, South Korea 9.1% CAGR, France 8.9% CAGR, United States 8.8% CAGR, and United Kingdom 8.5% CAGR through 2036.
| Country | CAGR |
|---|---|
| India | 10.8% |
| China | 10.4% |
| Germany | 9.6% |
| Japan | 9.4% |
| South Korea | 9.1% |
| France | 8.9% |
| United States | 8.8% |
| United Kingdom | 8.5% |
Source: Future Market Insights, 2026.
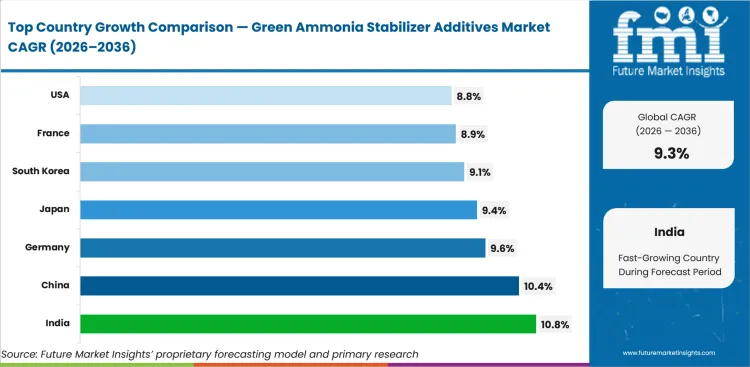
How do country-level CAGRs compare in the green ammonia stabilizer additives market?
India leads country growth while the United Kingdom records the most cautious expansion outlook among selected markets.
- India is forecast to record 10.8% CAGR by 2036 as fertilizer-linked green ammonia procurement creates direct demand signals.
- China is expected to expand at 10.4% CAGR from 2026 to 2036 due to ammonia co-firing and coal-power conversion plans.
- Germany is projected to grow at 9.6% CAGR through 2036 as hydrogen derivative imports become part of industrial sourcing.
- Japan is estimated to rise at 9.4% CAGR by 2036 with ammonia and hydrogen derivatives entering energy-security planning.
- South Korea is expected to advance at 9.1% CAGR over the forecast period as clean hydrogen power procurement supports ammonia handling.
- France is forecast to grow at 8.9% CAGR through 2036 as domestic hydrogen strategy supports downstream formulation trials.
- United States is projected to post 8.8% CAGR by 2036 as ammonia production scale supports additive testing.
- United Kingdom is expected to increase at 8.5% CAGR through 2036 through supported hydrogen allocation projects.
How fast is the green ammonia stabilizer additives market growing in India?
A 10.8% CAGR through 2036 reflects fertilizer-linked green ammonia procurement and domestic clean hydrogen policy support.
Country Market Snapshot Table
| Parameter | Value |
|---|---|
| Market Size in 2025 (Value) | USD 3.9 million |
| Market Size in 2026 (Value) | USD 4.3 million |
| Market Forecast in 2036 (Value) | USD 12.0 million |
| CAGR (2026 to 2036) | 10.8% |
| Years Considered | 2021 to 2036 |
| Base Year | 2025 |
| Forecast Period | 2026 to 2036 |
| Units Considered | Value (USD million) |
| Leading Sub-Region | Gujarat and eastern fertilizer corridors |
India Green Ammonia Stabilizer Additives Market Outlook
India green ammonia stabilizer additives demand is influenced by fertilizer decarbonization and government-backed green ammonia procurement. Fertilizer users need storage, dosing, corrosion control, and traceability support as lower-carbon ammonia supply enters tender-backed channels.
Local adoption is expected to favor suppliers that can provide application testing near fertilizer plants and chemical clusters. Additive suppliers with waterborne formulation depth should gain better access where buyers want cleaner inputs without replacing every plant system.
Key Growth Drivers
- Fertilizer procurement creates direct additive-testing demand. India’s green ammonia tender calls for 724,000 tonnes of annual supply across 13 fertilizer plants.
- Demand certainty supports supplier planning. SECI will sign offtake agreements over a 10-year contract period under the green ammonia tender.
- Fertilizer buyers need stabilizer packages that can protect ammonia-linked storage, transfer, dosing, and process handling systems during early adoption.
- Local technical teams can gain preference by supporting trial batches near fertilizer, coating, water treatment, and industrial chemical clusters.
Key Restraints
- Cost discipline remains high. India’s National Green Hydrogen Mission provides production-linked incentives of INR 8.82/kg, INR 7.06/kg, and INR 5.30/kg for the first 3 years, showing the need for support during early procurement.
- First-wave buyers may delay full additive conversion until storage protocols and supplier testing evidence become more standardized.
- Smaller suppliers can face approval barriers if they cannot provide ammonia compatibility data and batch-level documentation.
What makes India unique
India is unique due to fertilizer-linked green ammonia procurement and a policy route that directly connects clean hydrogen with domestic nitrogen supply.
Key Companies
- BASF India
- LANXESS India
- Arkema India
- Nouryon India
- Tata Chemicals
- Deepak Fertilisers
- Gujarat Narmada Valley Fertilizers & Chemicals
- Indian Farmers Fertiliser Cooperative
Sales & Marketing Channels
- Direct sales to fertilizer producers
- Industrial chemical distributors
- Technical service partnerships
- Water treatment formulators
- Coating and process chemical suppliers
- Engineering procurement contractors
Country Segment Breakdown Table
| Segment | Sub-Segments |
|---|---|
| By Chemistry Type | Bio-based · Recycled · Low VOC · Halogen Free · Waterborne |
| By Function | Solvent · Additive · Binder · Coating · Process Aid |
| By Application | Textiles · Batteries · Construction · Personal Care · Water Treatment |
| By End-use Industry | Automotive · Electronics · Packaging · Agriculture · Industrial Manufacturing |
| By Region | North America · Europe · East Asia · South Asia · Latin America |
| Key Sub-Regions Covered, Fertilizer and Chemical Corridors | Gujarat · Odisha · Andhra Pradesh · Maharashtra · Tamil Nadu · Uttar Pradesh |
Frequently Asked Questions
How fast is India green ammonia stabilizer additives market growing?
Sales in India are ready to scale at 10.8% CAGR from 2026 to 2036, guided by fertilizer-linked green ammonia procurement.
Who leads India green ammonia stabilizer additives market?
BASF India, LANXESS India, Arkema India, Nouryon India, Tata Chemicals, and fertilizer-linked chemical suppliers compete through formulation support.
What is driving adoption in India green ammonia stabilizer additives market?
Green ammonia tenders and fertilizer decarbonization are moving buyers toward ammonia-compatible stabilizer additives.
What is the green ammonia stabilizer additives market outlook in China?
A 10.4% CAGR through 2036 is supported by ammonia co-firing policy and large domestic chemical capacity.
Country Market Snapshot Table
| Parameter | Value |
|---|---|
| Market Size in 2025 (Value) | USD 7.5 million |
| Market Size in 2026 (Value) | USD 8.3 million |
| Market Forecast in 2036 (Value) | USD 22.4 million |
| CAGR (2026 to 2036) | 10.4% |
| Years Considered | 2021 to 2036 |
| Base Year | 2025 |
| Forecast Period | 2026 to 2036 |
| Units Considered | Value (USD million) |
| Leading Sub-Region | Shandong and Jiangsu industrial corridors |
China Green Ammonia Stabilizer Additives Market Outlook
China green ammonia stabilizer additives demand is shaped by coal-power transformation, industrial coatings, water treatment, and large-scale chemical procurement. Ammonia co-firing and low-carbon industrial programs create a testing route for stabilizers used around handling and process protection.
Domestic suppliers can compete on cost, while multinational suppliers are likely to compete on documentation and high-specification performance. Buyers are expected to compare price first, although safety-critical uses will still require technical proof and compatibility evidence.
Key Growth Drivers
- Coal-power transformation supports ammonia-use trials. China’s low-carbon coal-power plan targets 20% lower carbon emissions by 2025 for selected plants compared with similar 2023 units.
- Longer-term policy targets strengthen ammonia-linked demand. The same plan targets 50% lower carbon emissions by 2027 for selected coal-power transformation projects.
- Domestic manufacturing scale lowers additive trial costs across coatings, water treatment, electronics, and industrial process applications.
- Local formulation partners can support faster plant testing when buyers need ammonia-compatible additives and lower-emission chemistry.
Key Restraints
- Electrolyser supply-chain pressure can affect margins. China accounted for 65% of global installed electrolysis capacity and capacity reaching final investment decision in the IEA’s 2025 review.
- Policy-led pilots may take time to convert into repeat private orders because project economics and fuel availability remain sensitive.
- Domestic competition can limit margins for specialty additive suppliers without clear performance differentiation.
What makes China unique
China is unique due to policy-driven ammonia trials, large manufacturing scale, and domestic specialty chemical capacity.
Key Companies
- BASF China
- Covestro China
- Clariant China
- LANXESS China
- Wanhua Chemical
- Sinochem
- Sinopec Catalyst
- Zhejiang NHU
Sales & Marketing Channels
- Direct industrial sales
- Coatings formulators
- State-linked procurement channels
- Water treatment chemical distributors
- Electronics chemical suppliers
- Engineering and project contractors
Country Segment Breakdown Table
| Segment | Sub-Segments |
|---|---|
| By Chemistry Type | Bio-based · Recycled · Low VOC · Halogen Free · Waterborne |
| By Function | Solvent · Additive · Binder · Coating · Process Aid |
| By Application | Textiles · Batteries · Construction · Personal Care · Water Treatment |
| By End-use Industry | Automotive · Electronics · Packaging · Agriculture · Industrial Manufacturing |
| By Region | North America · Europe · East Asia · South Asia · Latin America |
| Key Sub-Regions Covered, Industrial and Ammonia-Linked Corridors | Shandong · Jiangsu · Guangdong · Zhejiang · Inner Mongolia · Hebei |
Frequently Asked Questions
How fast is China green ammonia stabilizer additives market growing?
Demand in China is expected to rise at 10.4% CAGR from 2026 to 2036 with ammonia co-firing and industrial chemical demand.
Who leads China green ammonia stabilizer additives market?
BASF China, Covestro China, Clariant China, LANXESS China, Wanhua, Sinochem, and Sinopec-linked suppliers compete across applications.
What is driving adoption in China green ammonia stabilizer additives market?
Ammonia-linked energy policy and low-emission industrial formulation needs are supporting early additive qualification.
What is the green ammonia stabilizer additives market forecast for Germany?
A 9.6% CAGR through 2036 reflects hydrogen derivative import planning and strong specialty chemical validation depth.
Country Market Snapshot Table
| Parameter | Value |
|---|---|
| Market Size in 2025 (Value) | USD 3.4 million |
| Market Size in 2026 (Value) | USD 3.7 million |
| Market Forecast in 2036 (Value) | USD 9.3 million |
| CAGR (2026 to 2036) | 9.6% |
| Years Considered | 2021 to 2036 |
| Base Year | 2025 |
| Forecast Period | 2026 to 2036 |
| Units Considered | Value (USD million) |
| Leading Sub-Region | North Rhine-Westphalia and northern import corridors |
Germany Green Ammonia Stabilizer Additives Market Outlook
Germany green ammonia stabilizer additives demand is shaped by hydrogen derivative import planning, industrial process chemistry, and strict supplier qualification practices. Additive buyers are expected to prioritize traceability, low-VOC evidence, and application testing before wider procurement.
German chemical suppliers provide a strong base for waterborne additives, rheology control, and specialty formulation support. Demand will favor suppliers that can connect low-emission additives with ammonia compatibility proof.
Key Growth Drivers
- Hydrogen derivative planning supports additive demand. Germany expects national demand for hydrogen and derivatives to reach 95 TWh to 130 TWh by 2030.
- Import dependence creates a handling route for ammonia-linked additives. Germany expects around 50% to 70% of hydrogen products to be imported by 2030.
- German buyers already use detailed supplier qualification processes, supporting additives with strong documentation and technical files.
- Local chemical groups can translate coating additives, rheology control, and process chemistry expertise into ammonia-linked applications.
Key Restraints
- Import infrastructure timing can slow additive demand. Germany expects imports of hydrogen products to reach 45 TWh to 90 TWh by 2030, which requires coordinated logistics and storage systems.
- Higher certification standards increase approval time for smaller additive suppliers that lack global compliance teams.
- Import-market uncertainty can keep buyers cautious when ammonia derivative supply is not yet stable across European terminals.
What makes Germany unique
Germany is unique due to hydrogen derivative import planning, industrial buyer discipline, and specialty chemical supplier depth.
Key Companies
- BASF
- LANXESS
- Clariant
- Covestro
- Evonik
- Wacker Chemie
- Altana
- BYK
Sales & Marketing Channels
- Direct sales to chemical producers
- Coatings formulators
- Industrial distributors
- Import terminal partners
- Technical certification consultants
- Process chemical service providers
Country Segment Breakdown Table
| Segment | Sub-Segments |
|---|---|
| By Chemistry Type | Bio-based · Recycled · Low VOC · Halogen Free · Waterborne |
| By Function | Solvent · Additive · Binder · Coating · Process Aid |
| By Application | Textiles · Batteries · Construction · Personal Care · Water Treatment |
| By End-use Industry | Automotive · Electronics · Packaging · Agriculture · Industrial Manufacturing |
| By Region | North America · Europe · East Asia · South Asia · Latin America |
| Key Sub-Regions Covered, Chemical and Import Corridors | North Rhine-Westphalia · Bavaria · Baden-Wurttemberg · Lower Saxony · Hamburg · Saxony |
Frequently Asked Questions
How fast is Germany green ammonia stabilizer additives market growing?
Industry in Germany is expected to rise at 9.6% CAGR from 2026 to 2036, led by hydrogen derivative import planning.
Who leads Germany green ammonia stabilizer additives market?
BASF, LANXESS, Clariant, Covestro, Evonik, Wacker Chemie, and BYK compete through specialty formulation expertise.
What is driving adoption in Germany green ammonia stabilizer additives market?
Hydrogen derivative import planning and strict industrial qualification are supporting demand for documented additive systems.
How is the green ammonia stabilizer additives market performing in Japan?
A 9.4% CAGR through 2036 reflects clean hydrogen legislation and ammonia-linked energy planning.
Country Market Snapshot Table
| Parameter | Value |
|---|---|
| Market Size in 2025 (Value) | USD 2.8 million |
| Market Size in 2026 (Value) | USD 3.1 million |
| Market Forecast in 2036 (Value) | USD 7.6 million |
| CAGR (2026 to 2036) | 9.4% |
| Years Considered | 2021 to 2036 |
| Base Year | 2025 |
| Forecast Period | 2026 to 2036 |
| Units Considered | Value (USD million) |
| Leading Sub-Region | Chubu and Tokyo industrial corridors |
Japan Green Ammonia Stabilizer Additives Market Outlook
Japan green ammonia stabilizer additives demand is influenced by hydrogen policy, ammonia carrier discussions, and high safety expectations in industrial procurement. Buyers will require evidence that additives do not affect downstream equipment reliability.
Country-specific additive demand may remain selective in the first stage of adoption. However, supplier approval in Japan can create a strong credibility signal across Asia because buyers value long-run safety and technical discipline.
Key Growth Drivers
- Ammonia power trials create a technical reference route. JERA and IHI began 20% ammonia substitution testing at Hekinan Thermal Power Station in April 2024.
- Support programs strengthen future demand. Japan’s low-carbon hydrogen subsidy scheme is planned at about USD 19 billion over 15 years.
- Utilities and industrial buyers need ammonia-compatible additives that protect equipment reliability and storage performance.
- Trading-house networks can connect global additive suppliers with domestic ammonia and industrial users.
Key Restraints
- High-cost fuel support remains necessary. JERA received price-gap support certification in December 2025 for a low-carbon ammonia value chain targeted for fiscal 2029.
- Long approval cycles can delay additive substitution because Japanese buyers place strong weight on safety records and local support.
- Utility procurement may favor proven suppliers, limiting entry for smaller formulators without local partners.
What makes Japan unique
Japan is unique due to hydrogen legislation, ammonia fuel trials, trading-house access, and strict safety expectations.
Key Companies
- Mitsubishi Chemical
- DIC Corporation
- Kuraray
- AGC Chemicals
- Tosoh
- Sumitomo Chemical
- JERA
- Mitsui Chemicals
Sales & Marketing Channels
- Trading houses
- Utility procurement routes
- OEM partnerships
- Specialty distributors
- Technical service agents
- Industrial chemical formulators
Country Segment Breakdown Table
| Segment | Sub-Segments |
|---|---|
| By Chemistry Type | Bio-based · Recycled · Low VOC · Halogen Free · Waterborne |
| By Function | Solvent · Additive · Binder · Coating · Process Aid |
| By Application | Textiles · Batteries · Construction · Personal Care · Water Treatment |
| By End-use Industry | Automotive · Electronics · Packaging · Agriculture · Industrial Manufacturing |
| By Region | North America · Europe · East Asia · South Asia · Latin America |
| Key Sub-Regions Covered, Industrial and Utility Corridors | Tokyo · Osaka · Nagoya · Yokohama · Kobe · Fukuoka |
Frequently Asked Questions
How fast is Japan green ammonia stabilizer additives market growing?
Sector in Japan is projected at 9.4% CAGR from 2026 to 2036 as ammonia and hydrogen derivative planning advances.
Who leads Japan green ammonia stabilizer additives market?
Mitsubishi Chemical, DIC, Kuraray, AGC Chemicals, Tosoh, Sumitomo Chemical, and JERA-linked suppliers compete through technical support.
What is driving adoption in Japan green ammonia stabilizer additives market?
Hydrogen derivative policy and ammonia power trials are supporting additive testing for handling and reliability.
What is driving green ammonia stabilizer additives growth in South Korea?
A 9.1% CAGR through 2036 is supported by clean hydrogen power procurement and ammonia-linked energy security planning.
Country Market Snapshot Table
| Parameter | Value |
|---|---|
| Market Size in 2025 (Value) | USD 2.3 million |
| Market Size in 2026 (Value) | USD 2.5 million |
| Market Forecast in 2036 (Value) | USD 6.0 million |
| CAGR (2026 to 2036) | 9.1% |
| Years Considered | 2021 to 2036 |
| Base Year | 2025 |
| Forecast Period | 2026 to 2036 |
| Units Considered | Value (USD million) |
| Leading Sub-Region | Ulsan and southern industrial corridors |
South Korea Green Ammonia Stabilizer Additives Market Outlook
South Korea green ammonia stabilizer additives demand is shaped by clean hydrogen power bidding, industrial decarbonization, and imported ammonia planning. Stabilizer additive suppliers can gain early opportunities through power, shipbuilding, electronics, and process chemical applications.
Buyers are expected to favor suppliers with local partners and documented compatibility data. The route to market will likely include power-sector qualification and industrial formulation trials.
Key Growth Drivers
- Clean hydrogen power procurement supports ammonia handling demand. South Korea’s 2026 proposed clean hydrogen power generation bidding volume is 500 GWh/year.
- General hydrogen power demand also supports industrial testing. South Korea’s 2026 proposed general hydrogen bidding volume is 930 GWh/year.
- Shipbuilding, electronics, and industrial processing users create strong testing routes for ammonia-compatible additives.
- Domestic industrial groups can support supplier qualification through coatings, materials, and chemical distribution networks.
Key Restraints
- Eligibility rules are strict. Clean hydrogen power facilities must meet a greenhouse gas threshold of no more than 4 kgCO2e per kilogram of hydrogen produced.
- Additive demand may depend on imported ammonia timing because domestic green ammonia scale remains limited.
- Local technical service expectations can restrict suppliers that lack Korean-language support and field testing capability.
What makes South unique
South Korea is unique due to clean hydrogen power procurement, heavy industrial users, and strong industrial material supply chains.
Key Companies
- LOTTE Chemical
- LG Chem
- SK Innovation
- Hanwha Solutions
- Hyundai Oilbank
- OCI Holdings
- KCC Corporation
- Kumho Petrochemical
Sales & Marketing Channels
- Direct enterprise sales
- Power-sector procurement
- Specialty chemical distributors
- Shipbuilding supply chains
- Electronics chemical channels
- Engineering partners
Country Segment Breakdown Table
| Segment | Sub-Segments |
|---|---|
| By Chemistry Type | Bio-based · Recycled · Low VOC · Halogen Free · Waterborne |
| By Function | Solvent · Additive · Binder · Coating · Process Aid |
| By Application | Textiles · Batteries · Construction · Personal Care · Water Treatment |
| By End-use Industry | Automotive · Electronics · Packaging · Agriculture · Industrial Manufacturing |
| By Region | North America · Europe · East Asia · South Asia · Latin America |
| Key Sub-Regions Covered, Industrial and Energy Corridors | Seoul Capital Area · Ulsan · Busan · Incheon · Daegu · Gwangju |
Frequently Asked Questions
How fast is South Korea green ammonia stabilizer additives market growing?
South Korea is anticipated to grow at 9.1% CAGR from 2026 to 2036, reflected by clean hydrogen power procurement.
Who leads South Korea green ammonia stabilizer additives market?
LOTTE Chemical, LG Chem, SK Innovation, Hanwha Solutions, OCI Holdings, KCC, and Kumho Petrochemical compete through industrial channels.
What is driving adoption in South Korea green ammonia stabilizer additives market?
Clean hydrogen bidding and industrial decarbonization are encouraging ammonia-linked additive testing.
What is the green ammonia stabilizer additives market outlook in France?
An 8.9% CAGR through 2036 reflects national hydrogen planning and waterborne specialty chemistry strengths.
Country Market Snapshot Table
| Parameter | Value |
|---|---|
| Market Size in 2025 (Value) | USD 2.6 million |
| Market Size in 2026 (Value) | USD 2.8 million |
| Market Forecast in 2036 (Value) | USD 6.6 million |
| CAGR (2026 to 2036) | 8.9% |
| Years Considered | 2021 to 2036 |
| Base Year | 2025 |
| Forecast Period | 2026 to 2036 |
| Units Considered | Value (USD million) |
| Leading Sub-Region | Auvergne-Rhone-Alpes and northern industrial corridors |
France Green Ammonia Stabilizer Additives Market Outlook
France green ammonia stabilizer additives demand is supported by hydrogen strategy, coating formulation expertise, and waterborne resin development. Additive demand is likely to begin in coatings, process aids, and water treatment before larger ammonia derivative routes scale.
French buyers are expected to prioritize domestic hydrogen, low-emission chemistry, and supplier documentation. This favors additive suppliers with strong certification and application support.
Key Growth Drivers
- Domestic hydrogen planning supports downstream additive trials. France expects up to 4.5 GW of electrolysis capacity to be operating by 2030.
- Longer-term hydrogen scale creates additional formulation demand. France targets 8 GW of installed electrolysis capacity by 2035.
- Arkema’s waterborne and specialty additive portfolio gives France a strong local platform for ammonia-linked formulation work.
- Coatings and water treatment users can qualify stabilizers without waiting for full-scale fuel ammonia deployment.
Key Restraints
- Import-linked ammonia demand may stay limited in the near term. France expects only a few international pilot hydrogen projects to be deployed by 2030.
- Ammonia derivative demand is less direct than in India, Japan, or China because the national plan focuses first on hydrogen production.
- Qualification will depend on specific end-use trials rather than broad policy support alone.
What makes France unique
France is unique due to waterborne specialty chemistry and hydrogen strategy meeting in a formulation-first market.
Key Companies
- Arkema
- Air Liquide
- TotalEnergies
- Solvay France
- SNF Group
- Kem One
- Seqens
- Bostik
Sales & Marketing Channels
- Direct sales to coatings producers
- Industrial chemical distributors
- Water treatment formulators
- Technical service centers
- Sustainability procurement teams
- Hydrogen project partners
Country Segment Breakdown Table
| Segment | Sub-Segments |
|---|---|
| By Chemistry Type | Bio-based · Recycled · Low VOC · Halogen Free · Waterborne |
| By Function | Solvent · Additive · Binder · Coating · Process Aid |
| By Application | Textiles · Batteries · Construction · Personal Care · Water Treatment |
| By End-use Industry | Automotive · Electronics · Packaging · Agriculture · Industrial Manufacturing |
| By Region | North America · Europe · East Asia · South Asia · Latin America |
| Key Sub-Regions Covered, Coating and Hydrogen Corridors | Auvergne-Rhone-Alpes · Ile-de-France · Hauts-de-France · Normandy · Grand Est · Provence-Alpes-Cote d’Azur |
Frequently Asked Questions
How fast is France green ammonia stabilizer additives market growing?
Demand in France is ready to rise at 8.9% CAGR from 2026 to 2036 with hydrogen strategy and waterborne chemistry.
Who leads France green ammonia stabilizer additives market?
Arkema, Air Liquide, TotalEnergies, Solvay France, SNF Group, Kem One, Seqens, and Bostik compete through chemical and formulation expertise.
What is driving adoption in France green ammonia stabilizer additives market?
Hydrogen planning, coatings demand, and waterborne additive capabilities are supporting early stabilizer qualification.
What is the green ammonia stabilizer additives market outlook in the United States?
An 8.8% CAGR through 2036 reflects Gulf Coast ammonia infrastructure and clean hydrogen hub activity.
Country Market Snapshot Table
| Parameter | Value |
|---|---|
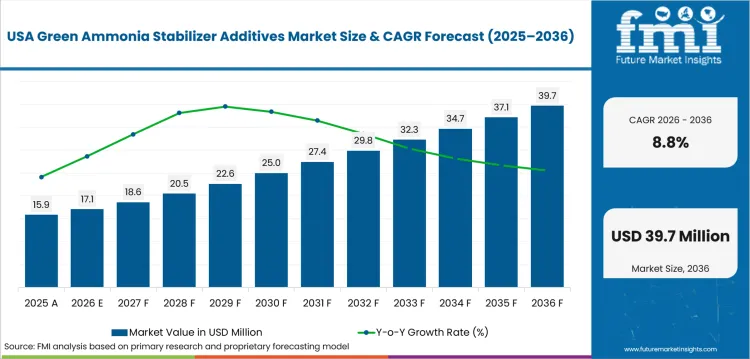
| Market Size in 2025 (Value) | USD 5.4 million |
| Market Size in 2026 (Value) | USD 5.9 million |
| Market Forecast in 2036 (Value) | USD 13.7 million |
| CAGR (2026 to 2036) | 8.8% |
| Years Considered | 2021 to 2036 |
| Base Year | 2025 |
| Forecast Period | 2026 to 2036 |
| Units Considered | Value (USD million) |
| Leading Sub-Region | Gulf Coast ammonia and chemical corridors |
United States Green Ammonia Stabilizer Additives Market Outlook
United States green ammonia stabilizer additives demand is shaped by ammonia production scale, Gulf Coast chemical infrastructure, and clean hydrogen project activity. Stabilizer suppliers can gain through process chemicals, water treatment, industrial coatings, and ammonia project partners.
Buyers in the United States usually require safety files, corrosion data, field support, and formulation testing before wider use. Suppliers with a strong technical service base should gain stronger approval traction.
Key Growth Drivers
- Clean hydrogen hubs create regional project routes. The U.S. hydrogen hubs program is supported by USD 7 billion in federal funding.
- Ammonia production scale supports additive testing. USGS reported ammonia production by 18 companies at 37 plants in 17 states during 2024.
- Gulf Coast chemical plants shorten the supplier qualification route because ammonia storage, loading, and safety routines are already established.
- Water treatment and industrial coating users already understand pH control and corrosion risks in ammonia-linked systems.
Key Restraints
- Low-emissions supply is still small. IEA reported that low-emissions hydrogen accounted for less than 1% of global production in 2024.
- Final offtake contracts can delay green ammonia-linked additive orders because plant-level testing follows confirmed commercial demand.
- Documentation demands raise costs for smaller suppliers that lack field data and ammonia compatibility testing depth.
What makes United unique
The United States is unique due to ammonia production scale, Gulf Coast infrastructure, and specialty chemical supplier depth.
Key Companies
- BASF Corporation
- LANXESS Corporation
- Eastman Chemical
- Nouryon
- CF Industries
- Linde
- DuPont
- Dow
Sales & Marketing Channels
- Direct enterprise sales to chemical plants
- Technical distributors for coatings
- Water treatment formulators
- Project engineering partners
- Industrial safety consultants
- Ammonia project developers
Country Segment Breakdown Table
| Segment | Sub-Segments |
|---|---|
| By Chemistry Type | Bio-based · Recycled · Low VOC · Halogen Free · Waterborne |
| By Function | Solvent · Additive · Binder · Coating · Process Aid |
| By Application | Textiles · Batteries · Construction · Personal Care · Water Treatment |
| By End-use Industry | Automotive · Electronics · Packaging · Agriculture · Industrial Manufacturing |
| By Region | North America · Europe · East Asia · South Asia · Latin America |
| Key Sub-Regions Covered, Ammonia and Chemical Corridors | Louisiana · Texas · Oklahoma · Illinois · California · Gulf Coast |
Frequently Asked Questions
How fast is United States green ammonia stabilizer additives market growing?
Sector in the United States is anticipated to grow at 8.8% CAGR from 2026 to 2036 through ammonia infrastructure and hydrogen hubs.
Who leads United States green ammonia stabilizer additives market?
BASF, LANXESS, Eastman, Nouryon, CF Industries, Linde, DuPont, and Dow compete through chemical supply and project access.
What is driving adoption in United States green ammonia stabilizer additives market?
Ammonia production scale and clean hydrogen hub activity are moving buyers toward compatibility-tested additive systems.
What is the green ammonia stabilizer additives market forecast for the United Kingdom?
An 8.5% CAGR through 2036 reflects supported hydrogen allocation projects and standards-sensitive industrial procurement.
Country Market Snapshot Table
| Parameter | Value |
|---|---|
| Market Size in 2025 (Value) | USD 1.9 million |
| Market Size in 2026 (Value) | USD 2.1 million |
| Market Forecast in 2036 (Value) | USD 4.7 million |
| CAGR (2026 to 2036) | 8.5% |
| Years Considered | 2021 to 2036 |
| Base Year | 2025 |
| Forecast Period | 2026 to 2036 |
| Units Considered | Value (USD million) |
| Leading Sub-Region | Teesside and Humber industrial clusters |
United Kingdom Green Ammonia Stabilizer Additives Market Outlook
United Kingdom green ammonia stabilizer additives demand is shaped by green hydrogen support rounds, industrial clusters, and port-related chemical handling. Green ammonia stabilizer additives can gain through technical distributors, industrial users, and clean hydrogen project routes.
The market is expected to favor suppliers with documentation, import flexibility, and field support. Domestic ammonia-linked volume is smaller than Asia, so early sales may depend on industrial trials and distributor-led qualification.
Key Growth Drivers
- Hydrogen allocation projects create early offtake signals. The UK confirmed support for 11 HAR1 green hydrogen projects.
- Public funding improves project confidence. HAR1 includes GBP 90 million in capital grant support and more than GBP 2 billion in revenue support.
- Port and industrial cluster users can test ammonia-linked additives in storage, terminal, and process chemical applications.
- Specialty distributors can bridge imported additive supply into local users that need technical support and compliance files.
Key Restraints
- First-wave execution remains staged. GOV.UK reported that 10 first-wave hydrogen projects signed contracts in July 2025.
- Domestic ammonia project scale remains smaller than East Asia and India, which can limit early additive volume.
- Buyers may delay supplier approval until hydrogen offtake and derivative routes become clearer.
What makes United unique
United Kingdom is unique due to contract-backed hydrogen projects, standards-sensitive buyers, and specialty distributor access.
Key Companies
- BASF UK
- LANXESS UK
- Croda International
- Innospec
- Johnson Matthey
- Victrex
- Elementis
- Synthomer
Sales & Marketing Channels
- Specialty chemical distributors
- Port and terminal procurement routes
- Industrial cluster partnerships
- Direct sales to process users
- Technical service laboratories
- Hydrogen project developers
Country Segment Breakdown Table
| Segment | Sub-Segments |
|---|---|
| By Chemistry Type | Bio-based · Recycled · Low VOC · Halogen Free · Waterborne |
| By Function | Solvent · Additive · Binder · Coating · Process Aid |
| By Application | Textiles · Batteries · Construction · Personal Care · Water Treatment |
| By End-use Industry | Automotive · Electronics · Packaging · Agriculture · Industrial Manufacturing |
| By Region | North America · Europe · East Asia · South Asia · Latin America |
| Key Sub-Regions Covered, Hydrogen and Industrial Corridors | Teesside · Humber · South Wales · Scotland · Northwest England · Midlands |
Frequently Asked Questions
How fast is United Kingdom green ammonia stabilizer additives market growing?
Industry in the United Kingdom is projected to increase at 8.5% CAGR from 2026 to 2036 through hydrogen allocation projects.
Who leads United Kingdom green ammonia stabilizer additives market?
BASF UK, LANXESS UK, Croda, Innospec, Johnson Matthey, Elementis, Synthomer, and technical distributors compete across applications.
What is driving adoption in United Kingdom green ammonia stabilizer additives market?
Hydrogen contracts, industrial clusters, and standards-sensitive buyers are encouraging ammonia-compatible additive testing.
Who are the leading companies in the green ammonia stabilizer additives market?
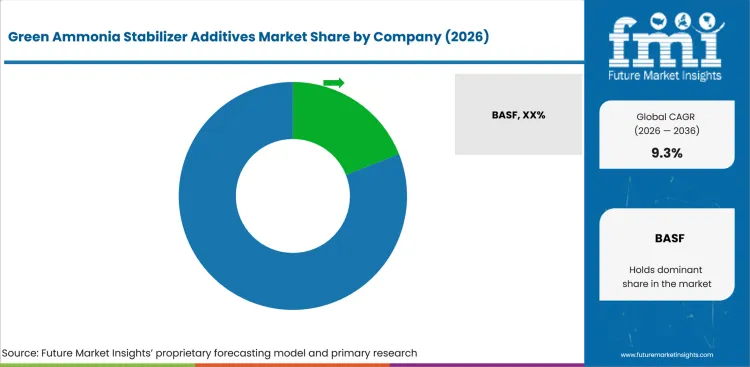
BASF, Arkema, LANXESS, Covestro, and Clariant.
- Established specialty chemical companies hold an advantage through additive portfolios, formulation laboratories, and global technical service networks.
- Waterborne formulation suppliers gain relevance as buyers reduce solvent exposure while keeping film strength, dispersion behavior, and storage stability.
- Ammonia-linked project participants support category development by creating demand for storage, dosing, and process protection chemicals.
- Documentation-ready suppliers gain stronger approval chances through ISCC PLUS certification, low-VOC evidence, and ammonia compatibility files.
Specialty chemical groups in the market compete by combining formulation chemistry with technical validation. BASF, Arkema, LANXESS, Covestro, and Clariant are positioned around additives, coatings, waterborne binders, and process chemistry. Buyers assess their ability to provide compatibility testing before selecting stabilizer packages for ammonia-linked applications. Supplier credibility depends on field support, safety data, and performance results across storage and dosing conditions.
Certification and lower-emission portfolios have become competitive separators as buyers move beyond pilot discussions. Arkema’s ISCC PLUS certification progress gives its coating additives a stronger traceability angle. LANXESS supports low-VOC coating systems through multifunctional additives and lower-carbon pigment technologies. BASF and Covestro benefit from broad formulation platforms that reach coatings, polymers, and industrial process users. Suppliers that can support documentation and plant trials should defend pricing better.
Smaller and regional players can win through local testing support and faster adaptation to country rules. India and China create opportunities for suppliers with cost-effective technical service near fertilizer and industrial plants. Germany and France reward suppliers with certification depth and waterborne formulation strength. Japan and South Korea create harder entry conditions because approval cycles and safety evidence are strict. Companies with ammonia compatibility proof and conservative product claims should gain more durable listing decisions.
How do top green ammonia stabilizer additives companies compare?
BASF and Arkema score strongest on formulation depth while LANXESS leads low-VOC additive visibility.
| Company | Relevance to Market Title | Ammonia-Compatible Formulation Breadth | Waterborne Stabilizer Portfolio | Compliance Documentation Depth | Channel Reach | Geographic Footprint |
|---|---|---|---|---|---|---|
| BASF | Very High | High | High | Strong | Very Strong | Global |
| Arkema | Very High | High | High | Very Strong | Strong | Global |
| LANXESS | Very High | High | Medium to High | Strong | Strong | Global |
| Covestro | High | Medium | High | Strong | Strong | Global |
| Clariant | High | Medium | Strong | Strong | Strong | Global |
| Nouryon | High | Medium | Medium | Moderate to Strong | Strong | Global |
| Eastman | High | Medium | Medium | Moderate to Strong | Strong | Global |
| Mitsubishi Chemical | High | Medium | Medium | Moderate | Strong | East Asia and selected global markets |
Source: Future Market Insights competitive analysis, 2026.
Who are the key players in the green ammonia stabilizer additives market?
BASF, Arkema, LANXESS, Covestro, and Clariant are listed with Nouryon and Eastman among other suppliers.
Key global companies leading the green ammonia stabilizer additives market include:
- BASF
- Arkema
- LANXESS
- Covestro
- Clariant
- Nouryon
- Eastman
- Mitsubishi Chemical
- Evonik
- Dow
Key Developments in Green Ammonia Stabilizer Additives Market
- In April 2026, LANXESS showcased low-carbon pigments and next-generation low-VOC additives for coating applications.
- In January 2026, Arkema announced ISCC PLUS certification across more than 70% of its coating facilities worldwide.
- In April 2025, CF Industries formed a joint venture with JERA and Mitsui for a low-carbon ammonia facility with approximately 1.4 million metric tons of annual capacity.
Key Players in the Green Ammonia Stabilizer Additives Market
Integrated Formulation Leaders
- BASF
- Arkema
- Covestro
- LANXESS
Specialty Additive and Process Chemistry Suppliers
- Clariant
- Nouryon
- Eastman
- Evonik
Ammonia and Industrial Project Enablers
- Mitsubishi Chemical
- CF Industries
- Linde
- Yara International
Green Ammonia Stabilizer Additives Market - Report Scope
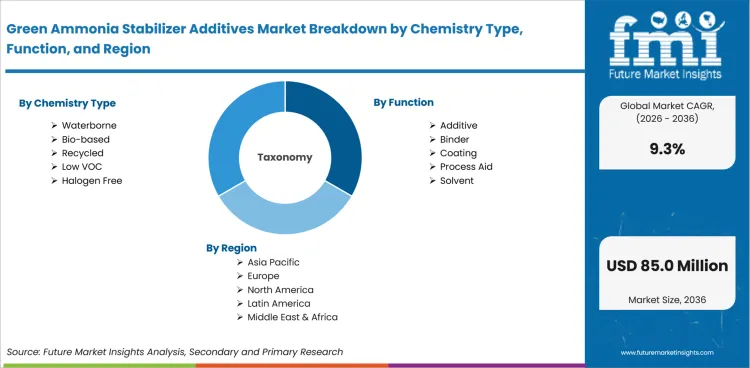
| Item | Value |
|---|---|
| Market size by 2036 | USD 85.0 million |
| Growth rate | 9.3% CAGR from 2026 to 2036 |
| Forecast period | 2026 to 2036 |
| Base year value (2025) | USD 32.0 million |
| By chemistry type | Bio-based, recycled, low VOC, halogen free, waterborne |
| By function | Solvent, additive, binder, coating, process aid |
| By application | Textiles, batteries, construction, personal care, water treatment |
| By end-use industry | Automotive, electronics, packaging, agriculture, industrial manufacturing |
| Regions covered | North America, Europe, East Asia, South Asia, Latin America |
| Countries covered | United States, United Kingdom, Germany, France, Japan, China, South Korea, India |
| Key companies profiled | BASF, Arkema, LANXESS, Covestro, Clariant, Nouryon, Eastman, Mitsubishi Chemical |
| Approach | Bottom-up additive-boundary approach using eligible product revenue, chemistry type, application exposure, country policy signals, and qualification timing |
Source: Future Market Insights, 2026.
Green Ammonia Stabilizer Additives Market Breakdown by Chemistry Type, Function, Application, End-use Industry, and Region
Green Ammonia Stabilizer Additives Market Segmented by Chemistry Type:
- Bio-based
- Recycled
- Low VOC
- Halogen Free
- Waterborne
Green Ammonia Stabilizer Additives Market Segmented by Function:
- Solvent
- Additive
- Binder
- Coating
- Process Aid
Green Ammonia Stabilizer Additives Market Segmented by Application:
- Textiles
- Batteries
- Construction
- Personal Care
- Water Treatment
Green Ammonia Stabilizer Additives Market Segmented by End-use Industry:
- Automotive
- Electronics
- Packaging
- Agriculture
- Industrial Manufacturing
Green Ammonia Stabilizer Additives Market by Region:
- North America
- Europe
- East Asia
- South Asia
- Latin America
Research Sources and Bibliography
- Agency for Natural Resources and Energy. (2024, September 10). Hydrogen Society Promotion Act enacted toward a forthcoming hydrogen-based society.
- Arkema. (2026, January 14). Arkema announces the ISCC PLUS certification of more than 70% of its coating facilities worldwide.
- CF Industries. (2025, April 8). CF Industries announces joint venture with JERA Co., Inc. and Mitsui & Co., Ltd., for production and offtake of low-carbon ammonia.
- Climate Policy Database. (2025, January 30). Action plan for low-carbon transformation and construction of coal power plants 2024-2027.
- Department for Energy Security and Net Zero. (2025, April 7). Hydrogen allocation rounds.
- Department for Energy Security and Net Zero. (2025, July 23). Jobs unlocked as first wave of hydrogen projects sign contracts.
- Federal Ministry for Economic Affairs and Climate Action. (2024, July 24). Federal Cabinet adopts import strategy for hydrogen and hydrogen derivatives.
- Government of France. (2025, September 30). National strategy for low-carbon hydrogen.
- International Energy Agency. (2025, September 12). Global hydrogen review 2025.
- International Renewable Energy Agency. (2024, October 2). Global trade in green hydrogen derivatives: Trends in regulation, standardisation and certification.
- JERA Co., Inc. (2024, April 1). Start of demonstration testing of fuel ammonia substitution at JERA’s Hekinan Thermal Power Station.
- JERA Co., Inc. (2025, December 19). JERA certified as a low-carbon hydrogen and derivatives supplier under Japan’s price-gap support scheme.
- LANXESS. (2026, April 22). LANXESS showcasing low-carbon pigments, next-generation low-VOC additives and advanced microbial control solutions at American Coatings Show 2026.
- Ministry of Climate, Energy and Environment. (2026, June 8). Public notice of proposed 2026 hydrogen power generation bidding market volumes.
- Press Information Bureau. (2025, June 23). SECI’s landmark green ammonia tender set to decarbonize India’s fertilizer sector.
- U.S. Department of Energy. (2026). Regional clean hydrogen hubs.
- U.S. Geological Survey. (2025, January). Nitrogen fixed-ammonia.
- Yara International. (2024, June 10). Yara opens renewable hydrogen plant: A major milestone.
This bibliography is provided for reader reference and is not exhaustive. The full report contains the complete reference list and detailed citations.
Green Ammonia Stabilizer Additives Market - Scope & Definition
| Attribute | Detail |
|---|---|
| Market Definition | Specialty additives used to maintain stability, compatibility, pH behavior, corrosion control, and process performance in systems that handle or use ammonia made from low-emission hydrogen. |
| Functions Covered | Stabilization, pH control, corrosion protection, wetting, dispersion, anti-foam support, coating support, and process aid performance. |
| Applications Covered | Textiles, batteries, construction, personal care, water treatment, coatings, and ammonia-linked process systems. |
| End-Use Industries | Automotive, electronics, packaging, agriculture, industrial manufacturing, water treatment, and specialty chemicals. |
| Grades Covered | Bio-based, recycled, low VOC, halogen free, and waterborne additive chemistries. |
| Inclusions | Commercial stabilizer additives used in ammonia-linked formulations by chemistry type, function, application, end-use industry, and selected regions. |
| Exclusions | Bulk green ammonia, grey ammonia, electrolyzer systems, hydrogen production assets, fuel cells, ammonia cracking units, synthesis catalysts, and finished fertilizer blends. |
Green Ammonia Stabilizer Additives Market - Research Methodology
| Method | Description |
|---|---|
| Primary Research | FMI analyst interviews with specialty chemical suppliers, water treatment formulators, coating producers, industrial chemical buyers, and ammonia-handling system integrators across selected markets. |
| Desk Research | Review of government hydrogen policies, ammonia trade references, specialty additive portfolios, official company releases, regulator data, technical standards, and credible international energy publications. |
| Market Sizing & Forecasting | Bottom-up additive-boundary approach using eligible product revenue, additive pricing bands, application exposure, country policy signals, qualification timing, and regional adoption assumptions. |
| Data Validation | Cross-verification using green ammonia project activity, specialty additive supplier portfolios, waterborne formulation demand, country-level clean hydrogen policies, and official public releases. |
This Report Answers
- Market size estimates for 2026 and forecasts through 2036 for the green ammonia stabilizer additives market.
- Insights across selected regional and country-level markets linked to hydrogen derivatives and ammonia handling.
- Analysis of demand drivers, formulation needs, low-VOC requirements, and buyer qualification patterns.
- Evaluation of chemistry types, functions, applications, and end-use industries shaping early adoption.
- Assessment of green ammonia procurement, hydrogen derivative imports, and ammonia co-firing policies.
- Identification of opportunities across waterborne additives, process aids, binders, and corrosion-control systems.
- Evaluation of supplier positioning across specialty additives, coatings, water treatment, and ammonia-linked systems.
- Country-level growth analysis covering India, China, Germany, Japan, South Korea, France, the United States, and the United Kingdom.
- Assessment of the competitive landscape, including leading specialty chemical suppliers and ammonia project enablers.
- Analysis of supplier documentation, certification needs, and batch-level traceability expectations.
- Regional outlooks across North America, Europe, East Asia, South Asia, and Latin America.
- Delivery of market data, forecasts, and supporting analysis in PDF and Excel formats.
Frequently Asked Questions
What is the green ammonia stabilizer additives market size in 2026?
The green ammonia stabilizer additives market size is anticipated to cross USD 35.0 million in 2026.
What is the green ammonia stabilizer additives market forecast for 2036?
The green ammonia stabilizer additives industry revenue is predicted to reach USD 85.0 million by 2036 as ammonia-linked applications scale.
What is the green ammonia stabilizer additives market CAGR?
The green ammonia stabilizer additives sector is projected to expand at 9.3% CAGR from 2026 to 2036.
What segment leads the green ammonia stabilizer additives market?
Additive function is likely to capture 34.0% share in 2026 due to multi-role formulation performance.
Which chemistry type leads the green ammonia stabilizer additives market?
Waterborne chemistry is projected to lead with 31.0% share in 2026 due to lower-solvent formulation needs.
What country grows fastest in the green ammonia stabilizer additives market?
India is set to record 10.8% CAGR by 2036, driven by fertilizer-linked green ammonia procurement.
Preview the report firsthand - request a free sample
Get SampleGet the brochure for pricing and purchase details.
Get PDFTable of Content
- Key Takeaways
- Market Size and CAGR
- Top Growth Driver
- Fastest Growing Segment
- Leading Region
- Key Companies
- Emerging Opportunities
- Executive Summary
- Global Market Outlook
- Demand-side Trends
- Supply-side Trends
- Technology Roadmap Analysis
- Analysis and Recommendations
- Analyst Perspective (What is happening? Why now? What should investors know?)
- Key Questions Answered
- How large is the market?
- What is the CAGR?
- What are key trends?
- Which region dominates?
- Who are the leaders?
- Market Overview
- Market Coverage / Taxonomy
- Market Definition / Scope / Limitations
- Research Methodology
- Chapter Orientation
- Analytical Lens and Working Hypotheses
- Market Structure, Signals, and Trend Drivers
- Benchmarking and Cross-market Comparability
- Market Sizing, Forecasting, and Opportunity Mapping
- Research Design and Evidence Framework
- Desk Research Programme (Secondary Evidence)
- Expert Input and Fieldwork (Primary Evidence)
- Tooling, Models, and Reference Databases
- Data Engineering and Model Build
- Quality Assurance and Audit Trail
- Market Background
- Market Dynamics (Drivers, Restraints, Opportunity, Trends)
- Scenario Forecast (Optimistic, Likely, Conservative)
- Impact Analysis
- AI Impact
- Sustainability Impact
- Regulatory Impact
- Technology Impact
- Consumer / Buyer Analysis
- Purchase Drivers
- Adoption Barriers
- Buyer Journey
- Opportunity Map Analysis
- Product Life Cycle Analysis
- Supply Chain Analysis
- Investment Feasibility Matrix
- Value Chain Analysis
- PESTLE and Porter's Analysis
- Regulatory Landscape
- Regional Parent Market Outlook
- Production and Consumption Statistics
- Import and Export Statistics
- Global Market Analysis and Forecast, 2021 to 2036
- Historical Market Size Value (USD Million) & Volume (Unit) Analysis, 2021 to 2025
- Current and Future Market Size Value (USD Million) & Volume (Unit) Projections, 2026 to 2036
- Y-o-Y Growth Trend Analysis
- Absolute $ Opportunity Analysis
- Global Market Pricing Analysis, 2021 to 2036
- Global Market Analysis and Forecast, By Chemistry Type, 2021 to 2036
- Introduction / Key Findings
- Historical Market Size Value (USD Million) & Volume (Unit) Analysis By Chemistry Type, 2021 to 2025
- Current and Future Market Size Value (USD Million) & Volume (Unit) Analysis and Forecast By Chemistry Type, 2026 to 2036
- Waterborne
- Bio-based
- Recycled
- Low VOC
- Halogen Free
- Waterborne
- Y-o-Y Growth Trend Analysis By Chemistry Type, 2021 to 2025
- Absolute $ Opportunity Analysis By Chemistry Type, 2026 to 2036
- Global Market Analysis and Forecast, By Function, 2021 to 2036
- Introduction / Key Findings
- Historical Market Size Value (USD Million) & Volume (Unit) Analysis By Function, 2021 to 2025
- Current and Future Market Size Value (USD Million) & Volume (Unit) Analysis and Forecast By Function, 2026 to 2036
- Additive
- Solvent
- Binder
- Coating
- Process Aid
- Additive
- Y-o-Y Growth Trend Analysis By Function, 2021 to 2025
- Absolute $ Opportunity Analysis By Function, 2026 to 2036
- Global Market Analysis and Forecast, By Application, 2021 to 2036
- Introduction / Key Findings
- Historical Market Size Value (USD Million) & Volume (Unit) Analysis By Application, 2021 to 2025
- Current and Future Market Size Value (USD Million) & Volume (Unit) Analysis and Forecast By Application, 2026 to 2036
- Water Treatment
- Textiles
- Batteries
- Construction
- Personal Care
- Water Treatment
- Y-o-Y Growth Trend Analysis By Application, 2021 to 2025
- Absolute $ Opportunity Analysis By Application, 2026 to 2036
- Global Market Analysis and Forecast, By End-use Industry, 2021 to 2036
- Introduction / Key Findings
- Historical Market Size Value (USD Million) & Volume (Unit) Analysis By End-use Industry, 2021 to 2025
- Current and Future Market Size Value (USD Million) & Volume (Unit) Analysis and Forecast By End-use Industry, 2026 to 2036
- Industrial Manufacturing
- Automotive
- Electronics
- Packaging
- Agriculture
- Industrial Manufacturing
- Y-o-Y Growth Trend Analysis By End-use Industry, 2021 to 2025
- Absolute $ Opportunity Analysis By End-use Industry, 2026 to 2036
- Global Market Analysis and Forecast, By Region, 2021 to 2036
- Introduction
- Historical Market Size Value (USD Million) & Volume (Unit) Analysis By Region, 2021 to 2025
- Current Market Size Value (USD Million) & Volume (Unit) Analysis and Forecast By Region, 2026 to 2036
- North America
- Latin America
- Western Europe
- Eastern Europe
- East Asia
- South Asia and Pacific
- Middle East & Africa
- Market Attractiveness Analysis By Region
- North America Market Analysis and Forecast, By Country, 2021 to 2036
- Historical Market Size Value (USD Million) & Volume (Unit) Trend Analysis By Market Taxonomy, 2021 to 2025
- Market Size Value (USD Million) & Volume (Unit) Forecast By Market Taxonomy, 2026 to 2036
- By Country
- USA
- Canada
- Mexico
- By Chemistry Type
- By Function
- By Application
- By End-use Industry
- By Country
- Market Attractiveness Analysis
- By Country
- By Chemistry Type
- By Function
- By Application
- By End-use Industry
- Key Takeaways
- Latin America Market Analysis and Forecast, By Country
- Historical Market Size Value (USD Million) & Volume (Unit) Trend Analysis By Market Taxonomy, 2021 to 2025
- Market Size Value (USD Million) & Volume (Unit) Forecast By Market Taxonomy, 2026 to 2036
- By Country
- Brazil
- Chile
- Rest of Latin America
- By Chemistry Type
- By Function
- By Application
- By End-use Industry
- By Country
- Market Attractiveness Analysis
- By Country
- By Chemistry Type
- By Function
- By Application
- By End-use Industry
- Key Takeaways
- Western Europe Market Analysis and Forecast, By Country
- Historical Market Size Value (USD Million) & Volume (Unit) Trend Analysis By Market Taxonomy, 2021 to 2025
- Market Size Value (USD Million) & Volume (Unit) Forecast By Market Taxonomy, 2026 to 2036
- By Country
- Germany
- UK
- Italy
- Spain
- France
- Nordic
- BENELUX
- Rest of Western Europe
- By Chemistry Type
- By Function
- By Application
- By End-use Industry
- By Country
- Market Attractiveness Analysis
- By Country
- By Chemistry Type
- By Function
- By Application
- By End-use Industry
- Key Takeaways
- Eastern Europe Market Analysis and Forecast, By Country
- Historical Market Size Value (USD Million) & Volume (Unit) Trend Analysis By Market Taxonomy, 2021 to 2025
- Market Size Value (USD Million) & Volume (Unit) Forecast By Market Taxonomy, 2026 to 2036
- By Country
- Russia
- Poland
- Hungary
- Balkan & Baltic
- Rest of Eastern Europe
- By Chemistry Type
- By Function
- By Application
- By End-use Industry
- By Country
- Market Attractiveness Analysis
- By Country
- By Chemistry Type
- By Function
- By Application
- By End-use Industry
- Key Takeaways
- East Asia Market Analysis and Forecast, By Country
- Historical Market Size Value (USD Million) & Volume (Unit) Trend Analysis By Market Taxonomy, 2021 to 2025
- Market Size Value (USD Million) & Volume (Unit) Forecast By Market Taxonomy, 2026 to 2036
- By Country
- China
- Japan
- South Korea
- By Chemistry Type
- By Function
- By Application
- By End-use Industry
- By Country
- Market Attractiveness Analysis
- By Country
- By Chemistry Type
- By Function
- By Application
- By End-use Industry
- Key Takeaways
- South Asia and Pacific Market Analysis and Forecast, By Country
- Historical Market Size Value (USD Million) & Volume (Unit) Trend Analysis By Market Taxonomy, 2021 to 2025
- Market Size Value (USD Million) & Volume (Unit) Forecast By Market Taxonomy, 2026 to 2036
- By Country
- India
- ASEAN
- Australia & New Zealand
- Rest of South Asia and Pacific
- By Chemistry Type
- By Function
- By Application
- By End-use Industry
- By Country
- Market Attractiveness Analysis
- By Country
- By Chemistry Type
- By Function
- By Application
- By End-use Industry
- Key Takeaways
- Middle East & Africa Market Analysis and Forecast, By Country
- Historical Market Size Value (USD Million) & Volume (Unit) Trend Analysis By Market Taxonomy, 2021 to 2025
- Market Size Value (USD Million) & Volume (Unit) Forecast By Market Taxonomy, 2026 to 2036
- By Country
- Kingdom of Saudi Arabia
- Other GCC Countries
- Türkiye
- South Africa
- Other African Union
- Rest of Middle East & Africa
- By Chemistry Type
- By Function
- By Application
- By End-use Industry
- By Country
- Market Attractiveness Analysis
- By Country
- By Chemistry Type
- By Function
- By Application
- By End-use Industry
- Key Takeaways
- Key Countries Market Analysis
- USA
- Pricing Analysis
- Market Share Analysis, 2025
- By Chemistry Type
- By Function
- By Application
- By End-use Industry
- Canada
- Pricing Analysis
- Market Share Analysis, 2025
- By Chemistry Type
- By Function
- By Application
- By End-use Industry
- Mexico
- Pricing Analysis
- Market Share Analysis, 2025
- By Chemistry Type
- By Function
- By Application
- By End-use Industry
- Brazil
- Pricing Analysis
- Market Share Analysis, 2025
- By Chemistry Type
- By Function
- By Application
- By End-use Industry
- Chile
- Pricing Analysis
- Market Share Analysis, 2025
- By Chemistry Type
- By Function
- By Application
- By End-use Industry
- Germany
- Pricing Analysis
- Market Share Analysis, 2025
- By Chemistry Type
- By Function
- By Application
- By End-use Industry
- UK
- Pricing Analysis
- Market Share Analysis, 2025
- By Chemistry Type
- By Function
- By Application
- By End-use Industry
- Italy
- Pricing Analysis
- Market Share Analysis, 2025
- By Chemistry Type
- By Function
- By Application
- By End-use Industry
- Spain
- Pricing Analysis
- Market Share Analysis, 2025
- By Chemistry Type
- By Function
- By Application
- By End-use Industry
- France
- Pricing Analysis
- Market Share Analysis, 2025
- By Chemistry Type
- By Function
- By Application
- By End-use Industry
- India
- Pricing Analysis
- Market Share Analysis, 2025
- By Chemistry Type
- By Function
- By Application
- By End-use Industry
- ASEAN
- Pricing Analysis
- Market Share Analysis, 2025
- By Chemistry Type
- By Function
- By Application
- By End-use Industry
- Australia & New Zealand
- Pricing Analysis
- Market Share Analysis, 2025
- By Chemistry Type
- By Function
- By Application
- By End-use Industry
- China
- Pricing Analysis
- Market Share Analysis, 2025
- By Chemistry Type
- By Function
- By Application
- By End-use Industry
- Japan
- Pricing Analysis
- Market Share Analysis, 2025
- By Chemistry Type
- By Function
- By Application
- By End-use Industry
- South Korea
- Pricing Analysis
- Market Share Analysis, 2025
- By Chemistry Type
- By Function
- By Application
- By End-use Industry
- Russia
- Pricing Analysis
- Market Share Analysis, 2025
- By Chemistry Type
- By Function
- By Application
- By End-use Industry
- Poland
- Pricing Analysis
- Market Share Analysis, 2025
- By Chemistry Type
- By Function
- By Application
- By End-use Industry
- Hungary
- Pricing Analysis
- Market Share Analysis, 2025
- By Chemistry Type
- By Function
- By Application
- By End-use Industry
- Kingdom of Saudi Arabia
- Pricing Analysis
- Market Share Analysis, 2025
- By Chemistry Type
- By Function
- By Application
- By End-use Industry
- Türkiye
- Pricing Analysis
- Market Share Analysis, 2025
- By Chemistry Type
- By Function
- By Application
- By End-use Industry
- South Africa
- Pricing Analysis
- Market Share Analysis, 2025
- By Chemistry Type
- By Function
- By Application
- By End-use Industry
- USA
- Market Structure Analysis
- Competition Dashboard
- Competition Benchmarking
- Market Share Analysis of Top Players
- By Regional
- By Chemistry Type
- By Function
- By Application
- By End-use Industry
- Emerging Startups
- Innovation Benchmarking
- Competition Analysis
- Competition Deep Dive
- Mitsubishi Chemical
- Overview
- Product Portfolio
- Profitability by Market Segments (Product/Region/Sales Channel)
- Sales Footprint
- Strategy Overview
- Marketing Strategy
- Product Strategy
- Channel Strategy
- DIC Corporation
- Kuraray
- AGC Chemicals
- Tosoh
- Sumitomo Chemical
- JERA
- Mitsui Chemicals
- Mitsubishi Chemical
- Case Studies
- Success Stories
- Recent Developments
- Competition Deep Dive
- Assumptions & Acronyms Used


