Home Infusion Therapy Devices Market Outlook and Forecast 2025 to 2035

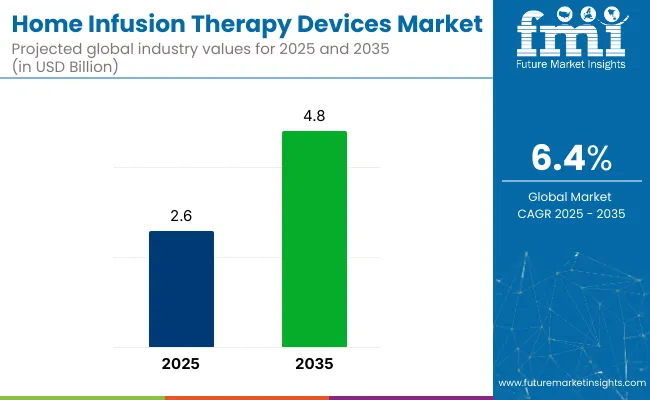
The global home infusion therapy devices market is valued at USD 2.6 billion in 2025 and is poised to reach USD 4.8 billion by 2035, registering a CAGR of 6.4%. This growth is expected to be driven by the rising prevalence of chronic illnesses such as cancer, diabetes, and immune disorders, alongside a strong global push toward home-based healthcare.
Quick Stats of Home Infusion Therapy Devices Market

  • Market Value (2025): USD 2.6 billion
  • Forecast Value (2035): USD 4.8 billion
  • Forecast CAGR: 6.4%
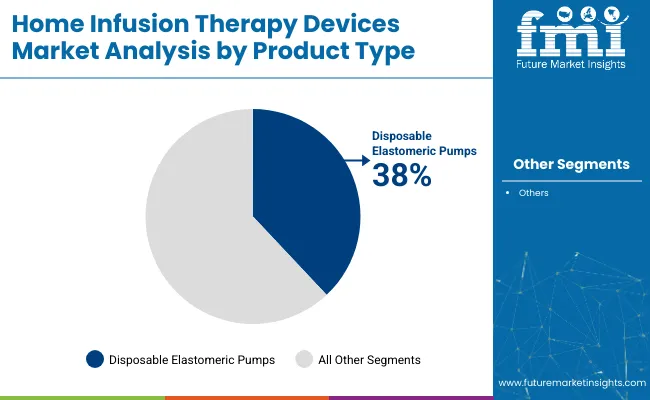
  • Product Type Leader in 2025: Disposable Elastomeric Pumps (38% market share)
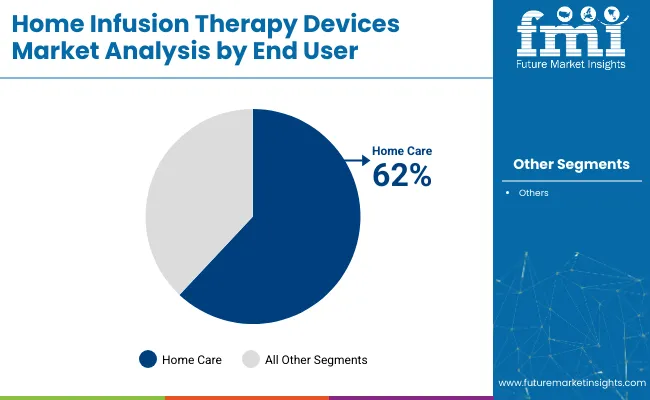
  • Top End-User Segment: Home Care Settings (62% market share)
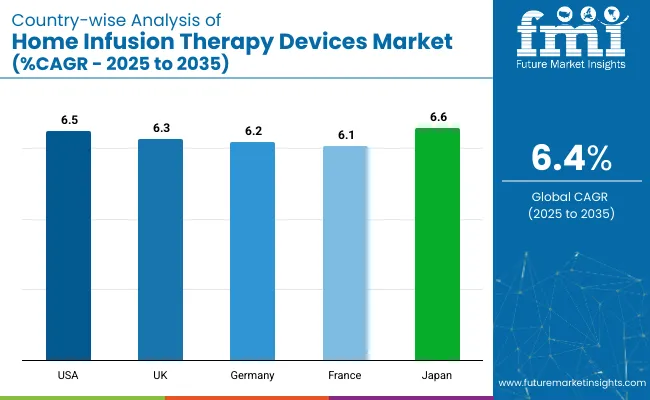
  • Key Growth Country: (Japan is the fastest-growing market with 6.6% CAGR)

Home Infusion Therapy Devices Market

Metric Value
Estimated Market Size (2025) USD 2.6 Billion
Projected Market Size (2035) USD 4.8 Billion
CAGR (2025 to 2035) 6.4%

Increased patient preference for comfort, reduced hospital visits, and cost-effective treatment alternatives have been positioning home infusion as a preferred therapeutic pathway in both developed and emerging markets. The shift toward decentralizing healthcare services has been reinforced by advancements in remote monitoring and the integration of telehealth services.

In 2025, the home infusion therapy devices market is expected to be led by disposable elastomeric pumps, which are projected to account for 38% of the total market share by device type, owing to their portability, cost-efficiency, and ease of use in antibiotic and chemotherapy delivery.

Simultaneously, home care settings are anticipated to dominate the end-user segment, capturing approximately 62% of the market share, driven by the growing demand for patient-centric, home-based treatment models. Among the countries analyzed, Japan is forecasted to register the highest CAGR of 6.6% between 2025 and 2035, supported by an aging population, robust investment in digital health infrastructure, and widespread adoption of AI-integrated infusion systems.

Challenges such as high device costs and regulatory hurdles are being addressed through flexible reimbursement models, improved compliance tracking, and the adoption of sustainable product materials. As smart healthcare ecosystems continue to evolve, the home infusion therapy devices market is expected to remain a pivotal segment in modern chronic care delivery.

Innovations in device technology have been prioritized, with manufacturers focusing on programmable infusion systems, IoT-enabled monitoring, and extended battery life. These advancements are being integrated to enhance treatment accuracy, reduce human error, and support remote supervision, enabling caregivers and healthcare providers to ensure safer and more efficient home-based infusion therapy.

Analyzing Home Infusion Therapy Devices Market by Top Investment Segments

The market is segmented into product type, application, end user, and region. By product type, the market is divided into disposable elastomeric pumps, insulin pumps, PCA pumps, electronic ambulatory pumps, and infusion system accessories. Based on application, the market is categorized into enteral nutrition, parenteral nutrition, chemotherapy, antibiotic administration, and others (pain management, hydration therapy, immune globulin therapy, and antiviral treatments).

In terms of end user, the market is segmented into home care settings and long-term care centers. Regionally, the market is classified into North America, Latin America, Western Europe, Eastern Europe, East Asia, South Asia & Pacific, and Middle East & Africa.

Disposable Elastomeric Pumps to Lead the Product Type Segment with 38% Market Share

Disposable elastomeric pumps are projected to lead the product type segment, accounting for 38% of the global market share by 2025. Their use has been encouraged by portability, cost-efficiency, and ease of operation in home-based settings for therapies such as antibiotics and chemotherapy.
  • A consistent flow rate has been delivered without the need for electronics.
  • Patient adherence has been supported through discreet and lightweight designs.
  • Basic training needs and lack of external power dependency have simplified usage.
  • These pumps have been used across various chronic care treatment protocols.

Home Infusion Therapy Devices Market Analysis By Product Type

Home Care Settings to Dominate the End User Segment with 62% Market Share

Home care settings are expected to account for 62% of the total market share in 2025, driven by rising demand for decentralized treatment, reduced hospitalization costs, and growing support for remote patient care models.
  • Comfort and autonomy have been offered to patients within home environments.
  • Insurance coverage and supportive regulations have enhanced adoption.
  • Remote monitoring systems and telemedicine platforms have been integrated.
  • The segment has catered to patients with chronic and post-acute care needs.

Home Infusion Therapy Devices Market Analysis By End User

Enteral Nutrition to Lead the Applications Segment with 34% Market Share

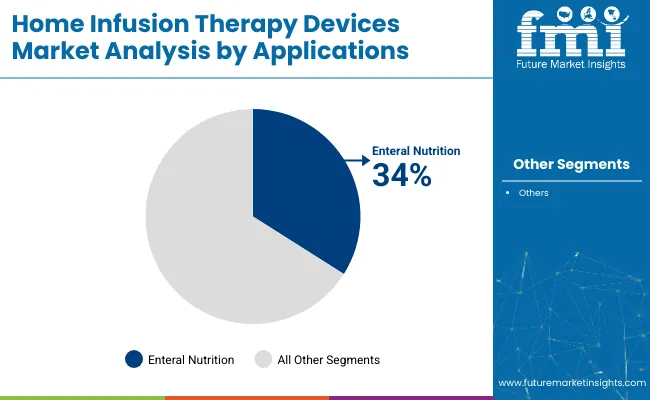
Enteral nutrition is projected to lead the application segment, accounting for 34% of the global market share, due to its applicability in managing long-term nutritional support for patients with gastrointestinal and neurological conditions.
  • Use has been observed in home recovery programs, geriatric care routines, and chronic illness management.
  • Device compatibility with feeding tubes and flow regulation mechanisms has been enhanced.
  • Market demand has been supported by growing awareness around home-based clinical nutrition.

Home Infusion Therapy Devices Market Analysis By Application

Top Home Infusion Therapy Devices Market Dynamics

The home infusion therapy devices market is being influenced by the growing shift toward home-based chronic care, the integration of smart infusion technologies, and efforts to minimize hospital stays. Demand has been supported by cost-effective treatment options, increased patient comfort, and expansion of digital health infrastructure.

Recent Trends in the Home Infusion Therapy Devices Market
  • Smart infusion pumps with real-time monitoring and IoT features have been increasingly adopted.
  • Wireless connectivity and cloud-based dosage tracking are being integrated into home-care models.
  • Use of biocompatible and recyclable device materials has been encouraged by sustainability goals.
  • Portable and battery-efficient infusion systems have been launched for extended in-home usage.

Challenges in the Home Infusion Therapy Devices Market

  • High initial costs of advanced infusion devices have been restricting access in low-income settings.
  • Compliance with evolving regional regulations (e.g., FDA, CE, ISO) has required significant investment.
  • Reimbursement disparities across regions have been limiting device uptake among certain populations.
  • User training and safety risks associated with home administration have posed implementation barriers.

Analyzing Top Countries Manufacturing and Supplying Home Infusion Therapy Devices

Home Infusion Therapy Devices Market Country Wise Analysis

USA Home Infusion Therapy Devices Market Analysis

The USA home infusion therapy devices market is expected to grow at a CAGR of 6.5% from 2025 to 2035. This expansion is being driven by a rising chronic disease burden, the integration of smart infusion technologies, and supportive reimbursement frameworks that are encouraging home-based treatment.

  • Advanced wearable infusion pumps have been adopted for cancer and diabetes care.
  • Remote monitoring systems are integrated for real-time patient supervision.
  • Favorable insurance policies are increasing device accessibility.
  • Telehealth adoption is accelerating home therapy delivery.

Home Infusion Therapy Devices Sales Analysis in the UK

The UK home infusion therapy devices market is projected to grow at a CAGR of 6.3% during the forecast period. Growth has been supported by the shift toward decentralized healthcare, the aging population, and government incentives promoting digital health infrastructure.

  • Investment has been directed toward portable IV therapy systems.
  • Telemedicine platforms are enabling wider adoption of home infusion.
  • Public and private partnerships are funding smart infusion device rollouts.
  • Precision drug delivery is being prioritized across care pathways.

Germany Home Infusion Therapy Devices Market Analysis

Germany’s home infusion therapy devices market is forecasted to expand at a CAGR of 6.2% from 2025 to 2035. Growth is being supported by robust healthcare infrastructure, high awareness of patient safety, and the country’s commitment to personalized medicine.

  • Home-based biologics administration is gaining traction.
  • Infusion systems are aligned with EU regulatory compliance.
  • High demand is observed in oncology and metabolic disorder treatment.
  • Collaboration between hospitals and homecare providers is strengthening.

Home Infusion Therapy Devices Demand Analysis IN fRANCE

The home infusion therapy devices market in France is anticipated to grow at a CAGR of 6.1% over the forecast period. Emphasis on quality care, environmental sustainability, and integrated treatment planning is encouraging adoption of home infusion systems, especially in long-term care and post-acute recovery.

  • Biocompatible and eco-friendly device materials are under development.
  • Healthcare professionals are being trained in home-based infusion protocols.
  • Demand for automated drug delivery systems is expanding.
  • Hybrid care models are being implemented for chronic disease management.

Japan Home Infusion Therapy Devices Market Analysis

Japan’s home infusion therapy devices market is projected to grow at a CAGR of 6.6% through 2035. With a rapidly aging population and advancements in medical technology, the country continues to prioritize home-based chronic care using precision-engineered, smart infusion systems.

  • AI-powered infusion pumps are being integrated for complex therapies.
  • Remote health platforms are supporting continuous monitoring.
  • Demand has risen from geriatric and cancer care segments.
  • Regulatory initiatives are promoting safer and more connected devices.

Leading Home Infusion Therapy Devices Suppliers and Distributors

The home infusion therapy devices market is considered moderately consolidated, with several international companies accounting for significant market shares, while regional manufacturers and niche technology players continue to introduce specialized solutions. Competitive positioning has been shaped by advancements in device connectivity, strategic collaborations with homecare providers, and expansion into emerging healthcare markets.

Tier-one firms such as Becton, Dickinson and Company (BD), Baxter International Inc., Fresenius Kabi AG, ICU Medical, Inc., and Smiths Medical have been focusing on smart infusion solutions, wireless integration, and ergonomic design improvements. These companies have invested in AI-enabled drug delivery systems, expanded their product portfolios through acquisitions, and partnered with telehealth providers to support remote monitoring and personalized infusion therapy.

Recent Home Infusion Therapy Devices Industry News

  • In January 2025, Johnson & Johnson signed a definite agreement with Intra-Cellular Therapies, Inc. to boost its product portfolio.
  • In June 2025, Nipro concluded a strategic partnership agreement with Samsung Bioepis for the commercialization of biosimilars in Japan.

Home Infusion Therapy Devices Market Report Scope

Report Attributes Details
Current Total Market Size (2025) USD 2.6 billion
Projected Market Size (2035) USD 4.8 billion
CAGR (2025 to 2035) 6.4%
Base Year for Estimation 2024
Historical Period 2020 to 2024
Projections Period 2025 to 2035
Market Analysis Parameters Revenue in USD billions / Volume in units
By Device Type Disposable Elastomeric Pumps, Insulin Pumps, PCA Pumps, Electronic Ambulatory Pumps, Infusion System Accessories
By Application Enteral Nutrition, Parenteral Nutrition, Chemotherapy, Antibiotic Administration, Others (Pain Management, Hydration Therapy, Immune Globulin Therapy, Antiviral Treatments)
By End User Home Care Settings, Long-Term Care Centers
Regions Covered North America, Latin America, Western Europe, Eastern Europe, East Asia, South Asia & Pacific, Middle East & Africa
Countries Covered United States, Canada, United Kingdom, Germany, France, Japan, South Korea, China, India, Australia
Key Players Becton, Dickinson and Company (BD), Baxter International Inc., Fresenius Kabi AG, ICU Medical, Inc., Smiths Medical, Nipro Corporation, Johnson & Johnson, F. Hoffmann-La Roche Ltd, Pfizer Inc., Terumo Corporation
Additional Attributes Dollar sales by value, market share analysis by region, and country-wise analysis

Home Infusion Therapy Devices Market Segmentation

By Product Type:

  • Disposable Elastomeric Pumps
  • Insulin Pumps
  • PCA Pumps
  • Electronic Ambulatory Pumps
  • Infusion System Accessories

By Applications:

  • Enteral Nutrition
  • Parenteral Nutrition
  • Chemotherapy
  • Antibiotic Administration
  • Others

By End User:

  • Home Care Settings
  • Long-Term Care Centers

By Region:

  • North America
  • Latin America
  • East Asia
  • South Asia & Pacific
  • Eastern Europe
  • Western Europe
  • Middle East & Africa

Table of Content

  1. Executive Summary
    • Global Market Outlook
    • Demand-side Trends
    • Supply-side Trends
    • Technology Roadmap Analysis
    • Analysis and Recommendations
  2. Market Overview
    • Market Coverage / Taxonomy
    • Market Definition / Scope / Limitations
  3. Market Background
    • Market Dynamics
      • Drivers
      • Restraints
      • Opportunity
      • Trends
    • Scenario Forecast
      • Demand in Optimistic Scenario
      • Demand in Likely Scenario
      • Demand in Conservative Scenario
    • Opportunity Map Analysis
    • Product Life Cycle Analysis
    • Supply Chain Analysis
      • Supply Side Participants and their Roles
        • Producers
        • Mid-Level Participants (Traders/ Agents/ Brokers)
        • Wholesalers and Distributors
      • Value Added and Value Created at Node in the Supply Chain
      • List of Raw Material Suppliers
      • List of Existing and Potential Buyer’s
    • Investment Feasibility Matrix
    • Value Chain Analysis
      • Profit Margin Analysis
      • Wholesalers and Distributors
      • Retailers
    • PESTLE and Porter’s Analysis
    • Regulatory Landscape
      • By Key Regions
      • By Key Countries
    • Regional Parent Market Outlook
    • Production and Consumption Statistics
    • Import and Export Statistics
  4. Global Market Analysis 2020 to 2024 and Forecast, 2025 to 2035
    • Historical Market Size Value (USD Billion) & Volume (Units) Analysis, 2020 to 2024
    • Current and Future Market Size Value (USD Billion) & Volume (Units) Projections, 2025 to 2035
      • Y-o-Y Growth Trend Analysis
      • Absolute USD Opportunity Analysis
  5. Global Market Pricing Analysis 2020 to 2024 and Forecast 2025 to 2035
  6. Global Market Analysis 2020 to 2024 and Forecast 2025 to 2035, By Product Type
    • Introduction / Key Findings
    • Historical Market Size Value (USD Billion) & Volume (Units) Analysis By Product Type, 2020 to 2024
    • Current and Future Market Size Value (USD Billion) & Volume (Units) Analysis and Forecast By Product Type, 2025 to 2035
      • Disposable Elastomeric Pumps
      • Insulin Pumps
      • PCA Pumps
      • Electronic Ambulatory Pumps
      • Infusion System Accessories
    • Y-o-Y Growth Trend Analysis By Product Type, 2020 to 2024
    • Absolute USD Opportunity Analysis By Product Type, 2025 to 2035
  7. Global Market Analysis 2020 to 2024 and Forecast 2025 to 2035, By Applications
    • Introduction / Key Findings
    • Historical Market Size Value (USD Billion) & Volume (Units) Analysis By Applications, 2020 to 2024
    • Current and Future Market Size Value (USD Billion) & Volume (Units) Analysis and Forecast By Applications, 2025 to 2035
      • Enteral Nutrition
      • Parenteral Nutrition
      • Chemotherapy
      • Antibiotic Administration
      • Others (Pain Management, Hydration Therapy, Immune Globulin Therapy, Antiviral Treatments)
    • Y-o-Y Growth Trend Analysis By Applications, 2020 to 2024
    • Absolute USD Opportunity Analysis By Applications, 2025 to 2035
  8. Global Market Analysis 2020 to 2024 and Forecast 2025 to 2035, By End User
    • Introduction / Key Findings
    • Historical Market Size Value (USD Billion) & Volume (Units) Analysis By End User, 2020 to 2024
    • Current and Future Market Size Value (USD Billion) & Volume (Units) Analysis and Forecast By End User, 2025 to 2035
      • Home Care Settings
      • Long-Term Care Centers
    • Y-o-Y Growth Trend Analysis By End User, 2020 to 2024
    • Absolute USD Opportunity Analysis By End User, 2025 to 2035
  9. Global Market Analysis 2020 to 2024 and Forecast 2025 to 2035, By Region
    • Introduction
    • Historical Market Size Value (USD Billion) & Volume (Units) Analysis By Region, 2020 to 2024
    • Current Market Size Value (USD Billion) & Volume (Units) Analysis and Forecast By Region, 2025 to 2035
      • North America
      • Latin America
      • Western Europe
      • Eastern Europe
      • East Asia
      • South Asia & Pacific
      • Middle East and Africa
    • Market Attractiveness Analysis By Region
  10. North America Market Analysis 2020 to 2024 and Forecast 2025 to 2035, By Country
    • Historical Market Size Value (USD Billion) & Volume (Units) Trend Analysis By Market Taxonomy, 2020 to 2024
    • Market Size Value (USD Billion) & Volume (Units) Forecast By Market Taxonomy, 2025 to 2035
      • By Country
        • U.S.
        • Canada
        • Mexico
      • By Product Type
      • By Applications
      • By End User
    • Market Attractiveness Analysis
      • By Country
      • By Product Type
      • By Applications
      • By End User
    • Key Takeaways
  11. Latin America Market Analysis 2020 to 2024 and Forecast 2025 to 2035, By Country
    • Historical Market Size Value (USD Billion) & Volume (Units) Trend Analysis By Market Taxonomy, 2020 to 2024
    • Market Size Value (USD Billion) & Volume (Units) Forecast By Market Taxonomy, 2025 to 2035
      • By Country
        • Brazil
        • Argentina
        • Rest of LATAM
      • By Product Type
      • By Applications
      • By End User
    • Market Attractiveness Analysis
      • By Country
      • By Product Type
      • By Applications
      • By End User
    • Key Takeaways
  12. Western Europe Market Analysis 2020 to 2024 and Forecast 2025 to 2035, By Country
    • Historical Market Size Value (USD Billion) & Volume (Units) Trend Analysis By Market Taxonomy, 2020 to 2024
    • Market Size Value (USD Billion) & Volume (Units) Forecast By Market Taxonomy, 2025 to 2035
      • By Country
        • Germany
        • Italy
        • France
        • UK
        • Spain
        • BENELUX
        • Nordic
        • Rest of W.Europe
      • By Product Type
      • By Applications
      • By End User
    • Market Attractiveness Analysis
      • By Country
      • By Product Type
      • By Applications
      • By End User
    • Key Takeaways
  13. Eastern Europe Market Analysis 2020 to 2024 and Forecast 2025 to 2035, By Country
    • Historical Market Size Value (USD Billion) & Volume (Units) Trend Analysis By Market Taxonomy, 2020 to 2024
    • Market Size Value (USD Billion) & Volume (Units) Forecast By Market Taxonomy, 2025 to 2035
      • By Country
        • Russia
        • Hungary
        • Poland
        • Balkan & Baltics
        • Rest of E. Europe
      • By Product Type
      • By Applications
      • By End User
    • Market Attractiveness Analysis
      • By Country
      • By Product Type
      • By Applications
      • By End User
    • Key Takeaways
  14. East Asia Market Analysis 2020 to 2024 and Forecast 2025 to 2035, By Country
    • Historical Market Size Value (USD Billion) & Volume (Units) Trend Analysis By Market Taxonomy, 2020 to 2024
    • Market Size Value (USD Billion) & Volume (Units) Forecast By Market Taxonomy, 2025 to 2035
      • By Country
        • China
        • Japan
        • South Korea
      • By Product Type
      • By Applications
      • By End User
    • Market Attractiveness Analysis
      • By Country
      • By Product Type
      • By Applications
      • By End User
    • Key Takeaways
  15. South Asia & Pacific Market Analysis 2020 to 2024 and Forecast 2025 to 2035, By Country
    • Historical Market Size Value (USD Billion) & Volume (Units) Trend Analysis By Market Taxonomy, 2020 to 2024
    • Market Size Value (USD Billion) & Volume (Units) Forecast By Market Taxonomy, 2025 to 2035
      • By Country
        • India
        • Australia & New Zealand
        • ASEAN
        • Rest of SAP
      • By Product Type
      • By Applications
      • By End User
    • Market Attractiveness Analysis
      • By Country
      • By Product Type
      • By Applications
      • By End User
    • Key Takeaways
  16. Middle East and Africa Market Analysis 2020 to 2024 and Forecast 2025 to 2035, By Country
    • Historical Market Size Value (USD Billion) & Volume (Units) Trend Analysis By Market Taxonomy, 2020 to 2024
    • Market Size Value (USD Billion) & Volume (Units) Forecast By Market Taxonomy, 2025 to 2035
      • By Country
        • GCC Countries
        • Northern Africa
        • South Africa
        • Turkiye
        • Rest of MEA
      • By Product Type
      • By Applications
      • By End User
    • Market Attractiveness Analysis
      • By Country
      • By Product Type
      • By Applications
      • By End User
    • Key Takeaways
  17. Key Countries Market Analysis
    • U.S.
      • Pricing Analysis
      • Market Share Analysis, 2024
        • By Product Type
        • By Applications
        • By End User
    • Canada
      • Pricing Analysis
      • Market Share Analysis, 2024
        • By Product Type
        • By Applications
        • By End User
    • Brazil
      • Pricing Analysis
      • Market Share Analysis, 2024
        • By Product Type
        • By Applications
        • By End User
    • Mexico
      • Pricing Analysis
      • Market Share Analysis, 2024
        • By Product Type
        • By Applications
        • By End User
    • Argentina
      • Pricing Analysis
      • Market Share Analysis, 2024
        • By Product Type
        • By Applications
        • By End User
  18. Market Structure Analysis
    • Competition Dashboard
    • Competition Benchmarking
    • Market Share Analysis of Top Players
      • By Regional
      • By Product Type
      • By Applications
      • By End User
  19. Competition Analysis
    • Competition Deep Dive
      • Baxter International Inc.
        • Overview
        • Product Portfolio
        • Profitability by Market Segments (Product/Age /Sales Channel/Region)
        • Sales Footprint
        • Strategy Overview
          • Marketing Strategy
          • Product Strategy
          • Channel Strategy
      • Fresenius Kabi AG
        • Overview
        • Product Portfolio
        • Profitability by Market Segments (Product/Age /Sales Channel/Region)
        • Sales Footprint
        • Strategy Overview
          • Marketing Strategy
          • Product Strategy
          • Channel Strategy
      • B. Braun Melsungen AG
        • Overview
        • Product Portfolio
        • Profitability by Market Segments (Product/Age /Sales Channel/Region)
        • Sales Footprint
        • Strategy Overview
          • Marketing Strategy
          • Product Strategy
          • Channel Strategy
      • Becton, Dickinson, and Company
        • Overview
        • Product Portfolio
        • Profitability by Market Segments (Product/Age /Sales Channel/Region)
        • Sales Footprint
        • Strategy Overview
          • Marketing Strategy
          • Product Strategy
          • Channel Strategy
      • Smith & Nephew PLC
        • Overview
        • Product Portfolio
        • Profitability by Market Segments (Product/Age /Sales Channel/Region)
        • Sales Footprint
        • Strategy Overview
          • Marketing Strategy
          • Product Strategy
          • Channel Strategy
      • Nipro Corporation
        • Overview
        • Product Portfolio
        • Profitability by Market Segments (Product/Age /Sales Channel/Region)
        • Sales Footprint
        • Strategy Overview
          • Marketing Strategy
          • Product Strategy
          • Channel Strategy
      • Pfizer Inc.
        • Overview
        • Product Portfolio
        • Profitability by Market Segments (Product/Age /Sales Channel/Region)
        • Sales Footprint
        • Strategy Overview
          • Marketing Strategy
          • Product Strategy
          • Channel Strategy
      • F. Hoffmann-La Roche Ltd
        • Overview
        • Product Portfolio
        • Profitability by Market Segments (Product/Age /Sales Channel/Region)
        • Sales Footprint
        • Strategy Overview
          • Marketing Strategy
          • Product Strategy
          • Channel Strategy
      • Johnson & Johnson
        • Overview
        • Product Portfolio
        • Profitability by Market Segments (Product/Age /Sales Channel/Region)
        • Sales Footprint
        • Strategy Overview
          • Marketing Strategy
          • Product Strategy
          • Channel Strategy
      • Terumo Corporation
        • Overview
        • Product Portfolio
        • Profitability by Market Segments (Product/Age /Sales Channel/Region)
        • Sales Footprint
        • Strategy Overview
          • Marketing Strategy
          • Product Strategy
          • Channel Strategy
  20. Assumptions & Acronyms Used
  21. Research Methodology

List of Tables

  • Table 1: Global Market Value (USD Billion) Forecast by Region, 2020-2035
  • Table 2: Global Market Volume (Units) Forecast by Region, 2020-2035
  • Table 3: Global Market Value (USD Billion) Forecast by Product Type, 2020-2035
  • Table 4: Global Market Volume (Units) Forecast by Product Type, 2020-2035
  • Table 5: Global Market Value (USD Billion) Forecast by Applications, 2020-2035
  • Table 6: Global Market Volume (Units) Forecast by Applications, 2020-2035
  • Table 7: Global Market Value (USD Billion) Forecast by End User, 2020-2035
  • Table 8: Global Market Volume (Units) Forecast by End User, 2020-2035
  • Table 9: North America Market Value (USD Billion) Forecast by Country, 2020-2035
  • Table 10: North America Market Volume (Units) Forecast by Country, 2020-2035
  • Table 11: North America Market Value (USD Billion) Forecast by Product Type, 2020-2035
  • Table 12: North America Market Volume (Units) Forecast by Product Type, 2020-2035
  • Table 13: North America Market Value (USD Billion) Forecast by Applications, 2020-2035
  • Table 14: North America Market Volume (Units) Forecast by Applications, 2020-2035
  • Table 15: North America Market Value (USD Billion) Forecast by End User, 2020-2035
  • Table 16: North America Market Volume (Units) Forecast by End User, 2020-2035
  • Table 17: Latin America Market Value (USD Billion) Forecast by Country, 2020-2035
  • Table 18: Latin America Market Volume (Units) Forecast by Country, 2020-2035
  • Table 19: Latin America Market Value (USD Billion) Forecast by Product Type, 2020-2035
  • Table 20: Latin America Market Volume (Units) Forecast by Product Type, 2020-2035
  • Table 21: Latin America Market Value (USD Billion) Forecast by Applications, 2020-2035
  • Table 22: Latin America Market Volume (Units) Forecast by Applications, 2020-2035
  • Table 23: Latin America Market Value (USD Billion) Forecast by End User, 2020-2035
  • Table 24: Latin America Market Volume (Units) Forecast by End User, 2020-2035
  • Table 25: Western Europe Market Value (USD Billion) Forecast by Country, 2020-2035
  • Table 26: Western Europe Market Volume (Units) Forecast by Country, 2020-2035
  • Table 27: Western Europe Market Value (USD Billion) Forecast by Product Type, 2020-2035
  • Table 28: Western Europe Market Volume (Units) Forecast by Product Type, 2020-2035
  • Table 29: Western Europe Market Value (USD Billion) Forecast by Applications, 2020-2035
  • Table 30: Western Europe Market Volume (Units) Forecast by Applications, 2020-2035
  • Table 31: Western Europe Market Value (USD Billion) Forecast by End User, 2020-2035
  • Table 32: Western Europe Market Volume (Units) Forecast by End User, 2020-2035
  • Table 33: Eastern Europe Market Value (USD Billion) Forecast by Country, 2020-2035
  • Table 34: Eastern Europe Market Volume (Units) Forecast by Country, 2020-2035
  • Table 35: Eastern Europe Market Value (USD Billion) Forecast by Product Type, 2020-2035
  • Table 36: Eastern Europe Market Volume (Units) Forecast by Product Type, 2020-2035
  • Table 37: Eastern Europe Market Value (USD Billion) Forecast by Applications, 2020-2035
  • Table 38: Eastern Europe Market Volume (Units) Forecast by Applications, 2020-2035
  • Table 39: Eastern Europe Market Value (USD Billion) Forecast by End User, 2020-2035
  • Table 40: Eastern Europe Market Volume (Units) Forecast by End User, 2020-2035
  • Table 41: East Asia Market Value (USD Billion) Forecast by Country, 2020-2035
  • Table 42: East Asia Market Volume (Units) Forecast by Country, 2020-2035
  • Table 43: East Asia Market Value (USD Billion) Forecast by Product Type, 2020-2035
  • Table 44: East Asia Market Volume (Units) Forecast by Product Type, 2020-2035
  • Table 45: East Asia Market Value (USD Billion) Forecast by Applications, 2020-2035
  • Table 46: East Asia Market Volume (Units) Forecast by Applications, 2020-2035
  • Table 47: East Asia Market Value (USD Billion) Forecast by End User, 2020-2035
  • Table 48: East Asia Market Volume (Units) Forecast by End User, 2020-2035
  • Table 49: South Asia & Pacific Market Value (USD Billion) Forecast by Country, 2020-2035
  • Table 50: South Asia & Pacific Market Volume (Units) Forecast by Country, 2020-2035
  • Table 51: South Asia & Pacific Market Value (USD Billion) Forecast by Product Type, 2020-2035
  • Table 52: South Asia & Pacific Market Volume (Units) Forecast by Product Type, 2020-2035
  • Table 53: South Asia & Pacific Market Value (USD Billion) Forecast by Applications, 2020-2035
  • Table 54: South Asia & Pacific Market Volume (Units) Forecast by Applications, 2020-2035
  • Table 55: South Asia & Pacific Market Value (USD Billion) Forecast by End User, 2020-2035
  • Table 56: South Asia & Pacific Market Volume (Units) Forecast by End User, 2020-2035
  • Table 57: Middle East and Africa Market Value (USD Billion) Forecast by Country, 2020-2035
  • Table 58: Middle East and Africa Market Volume (Units) Forecast by Country, 2020-2035
  • Table 59: Middle East and Africa Market Value (USD Billion) Forecast by Product Type, 2020-2035
  • Table 60: Middle East and Africa Market Volume (Units) Forecast by Product Type, 2020-2035
  • Table 61: Middle East and Africa Market Value (USD Billion) Forecast by Applications, 2020-2035
  • Table 62: Middle East and Africa Market Volume (Units) Forecast by Applications, 2020-2035
  • Table 63: Middle East and Africa Market Value (USD Billion) Forecast by End User, 2020-2035
  • Table 64: Middle East and Africa Market Volume (Units) Forecast by End User, 2020-2035

List of Figures

  • Figure 1: Global Market Volume (Units) Forecast 2020-2035
  • Figure 2: Global Market Pricing Analysis
  • Figure 3: Global Market Value (USD Billion) Forecast 2020-2035
  • Figure 4: Global Market Value Share and BPS Analysis by Product Type, 2025 and 2035
  • Figure 5: Global Market Y-o-Y Growth Comparison by Product Type, 2025-2035
  • Figure 6: Global Market Attractiveness Analysis by Product Type
  • Figure 7: Global Market Value Share and BPS Analysis by Applications, 2025 and 2035
  • Figure 8: Global Market Y-o-Y Growth Comparison by Applications, 2025-2035
  • Figure 9: Global Market Attractiveness Analysis by Applications
  • Figure 10: Global Market Value Share and BPS Analysis by End User, 2025 and 2035
  • Figure 11: Global Market Y-o-Y Growth Comparison by End User, 2025-2035
  • Figure 12: Global Market Attractiveness Analysis by End User
  • Figure 13: Global Market Value (USD Billion) Share and BPS Analysis by Region, 2025 and 2035
  • Figure 14: Global Market Y-o-Y Growth Comparison by Region, 2025-2035
  • Figure 15: Global Market Attractiveness Analysis by Region
  • Figure 16: North America Market Incremental USD Opportunity, 2025-2035
  • Figure 17: Latin America Market Incremental USD Opportunity, 2025-2035
  • Figure 18: Western Europe Market Incremental USD Opportunity, 2025-2035
  • Figure 19: Eastern Europe Market Incremental USD Opportunity, 2025-2035
  • Figure 20: East Asia Market Incremental USD Opportunity, 2025-2035
  • Figure 21: South Asia & Pacific Market Incremental USD Opportunity, 2025-2035
  • Figure 22: Middle East and Africa Market Incremental USD Opportunity, 2025-2035
  • Figure 23: North America Market Value Share and BPS Analysis by Country, 2025 and 2035
  • Figure 24: North America Market Value Share and BPS Analysis by Product Type, 2025 and 2035
  • Figure 25: North America Market Y-o-Y Growth Comparison by Product Type, 2025-2035
  • Figure 26: North America Market Attractiveness Analysis by Product Type
  • Figure 27: North America Market Value Share and BPS Analysis by Applications, 2025 and 2035
  • Figure 28: North America Market Y-o-Y Growth Comparison by Applications, 2025-2035
  • Figure 29: North America Market Attractiveness Analysis by Applications
  • Figure 30: North America Market Value Share and BPS Analysis by End User, 2025 and 2035
  • Figure 31: North America Market Y-o-Y Growth Comparison by End User, 2025-2035
  • Figure 32: North America Market Attractiveness Analysis by End User
  • Figure 33: Latin America Market Value Share and BPS Analysis by Country, 2025 and 2035
  • Figure 34: Latin America Market Value Share and BPS Analysis by Product Type, 2025 and 2035
  • Figure 35: Latin America Market Y-o-Y Growth Comparison by Product Type, 2025-2035
  • Figure 36: Latin America Market Attractiveness Analysis by Product Type
  • Figure 37: Latin America Market Value Share and BPS Analysis by Applications, 2025 and 2035
  • Figure 38: Latin America Market Y-o-Y Growth Comparison by Applications, 2025-2035
  • Figure 39: Latin America Market Attractiveness Analysis by Applications
  • Figure 40: Latin America Market Value Share and BPS Analysis by End User, 2025 and 2035
  • Figure 41: Latin America Market Y-o-Y Growth Comparison by End User, 2025-2035
  • Figure 42: Latin America Market Attractiveness Analysis by End User
  • Figure 43: Western Europe Market Value Share and BPS Analysis by Country, 2025 and 2035
  • Figure 44: Western Europe Market Value Share and BPS Analysis by Product Type, 2025 and 2035
  • Figure 45: Western Europe Market Y-o-Y Growth Comparison by Product Type, 2025-2035
  • Figure 46: Western Europe Market Attractiveness Analysis by Product Type
  • Figure 47: Western Europe Market Value Share and BPS Analysis by Applications, 2025 and 2035
  • Figure 48: Western Europe Market Y-o-Y Growth Comparison by Applications, 2025-2035
  • Figure 49: Western Europe Market Attractiveness Analysis by Applications
  • Figure 50: Western Europe Market Value Share and BPS Analysis by End User, 2025 and 2035
  • Figure 51: Western Europe Market Y-o-Y Growth Comparison by End User, 2025-2035
  • Figure 52: Western Europe Market Attractiveness Analysis by End User
  • Figure 53: Eastern Europe Market Value Share and BPS Analysis by Country, 2025 and 2035
  • Figure 54: Eastern Europe Market Value Share and BPS Analysis by Product Type, 2025 and 2035
  • Figure 55: Eastern Europe Market Y-o-Y Growth Comparison by Product Type, 2025-2035
  • Figure 56: Eastern Europe Market Attractiveness Analysis by Product Type
  • Figure 57: Eastern Europe Market Value Share and BPS Analysis by Applications, 2025 and 2035
  • Figure 58: Eastern Europe Market Y-o-Y Growth Comparison by Applications, 2025-2035
  • Figure 59: Eastern Europe Market Attractiveness Analysis by Applications
  • Figure 60: Eastern Europe Market Value Share and BPS Analysis by End User, 2025 and 2035
  • Figure 61: Eastern Europe Market Y-o-Y Growth Comparison by End User, 2025-2035
  • Figure 62: Eastern Europe Market Attractiveness Analysis by End User
  • Figure 63: East Asia Market Value Share and BPS Analysis by Country, 2025 and 2035
  • Figure 64: East Asia Market Value Share and BPS Analysis by Product Type, 2025 and 2035
  • Figure 65: East Asia Market Y-o-Y Growth Comparison by Product Type, 2025-2035
  • Figure 66: East Asia Market Attractiveness Analysis by Product Type
  • Figure 67: East Asia Market Value Share and BPS Analysis by Applications, 2025 and 2035
  • Figure 68: East Asia Market Y-o-Y Growth Comparison by Applications, 2025-2035
  • Figure 69: East Asia Market Attractiveness Analysis by Applications
  • Figure 70: East Asia Market Value Share and BPS Analysis by End User, 2025 and 2035
  • Figure 71: East Asia Market Y-o-Y Growth Comparison by End User, 2025-2035
  • Figure 72: East Asia Market Attractiveness Analysis by End User
  • Figure 73: South Asia & Pacific Market Value Share and BPS Analysis by Country, 2025 and 2035
  • Figure 74: South Asia & Pacific Market Value Share and BPS Analysis by Product Type, 2025 and 2035
  • Figure 75: South Asia & Pacific Market Y-o-Y Growth Comparison by Product Type, 2025-2035
  • Figure 76: South Asia & Pacific Market Attractiveness Analysis by Product Type
  • Figure 77: South Asia & Pacific Market Value Share and BPS Analysis by Applications, 2025 and 2035
  • Figure 78: South Asia & Pacific Market Y-o-Y Growth Comparison by Applications, 2025-2035
  • Figure 79: South Asia & Pacific Market Attractiveness Analysis by Applications
  • Figure 80: South Asia & Pacific Market Value Share and BPS Analysis by End User, 2025 and 2035
  • Figure 81: South Asia & Pacific Market Y-o-Y Growth Comparison by End User, 2025-2035
  • Figure 82: South Asia & Pacific Market Attractiveness Analysis by End User
  • Figure 83: Middle East and Africa Market Value Share and BPS Analysis by Country, 2025 and 2035
  • Figure 84: Middle East and Africa Market Value Share and BPS Analysis by Product Type, 2025 and 2035
  • Figure 85: Middle East and Africa Market Y-o-Y Growth Comparison by Product Type, 2025-2035
  • Figure 86: Middle East and Africa Market Attractiveness Analysis by Product Type
  • Figure 87: Middle East and Africa Market Value Share and BPS Analysis by Applications, 2025 and 2035
  • Figure 88: Middle East and Africa Market Y-o-Y Growth Comparison by Applications, 2025-2035
  • Figure 89: Middle East and Africa Market Attractiveness Analysis by Applications
  • Figure 90: Middle East and Africa Market Value Share and BPS Analysis by End User, 2025 and 2035
  • Figure 91: Middle East and Africa Market Y-o-Y Growth Comparison by End User, 2025-2035
  • Figure 92: Middle East and Africa Market Attractiveness Analysis by End User
  • Figure 93: Global Market - Tier Structure Analysis
  • Figure 94: Global Market - Company Share Analysis

Frequently Asked Questions

What is the projected size of home infusion therapy devices market by 2035?

The market is expected to reach USD 4.8 billion by 2035.

At what rate is the home infusion therapy devices market poised to grow from 2025 to 2035?

The global market is projected to grow at a CAGR of 6.4% during this period.

Which device type holds the highest share in the home infusion therapy devices market in 2025?

Disposable elastomeric pumps are expected to lead with a 38% market share in 2025.

What is the projected share of home care settings in the end-user segment by 2025?

Home care settings are anticipated to account for 62% of the total market share in 2025.

Which country is projected to grow fastest in the home infusion therapy devices market?

Japan is anticipated to be the fastest-growing market with a CAGR of 6.6% through 2035.

Explore Similar Insights

Future Market Insights

Home Infusion Therapy Devices Market