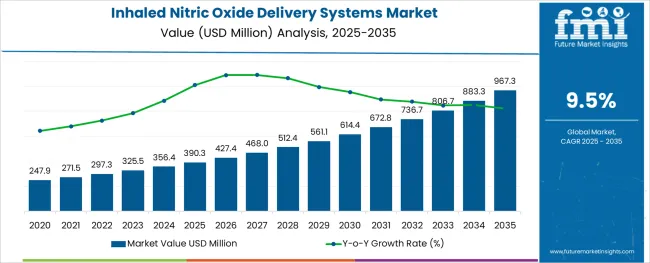
The Inhaled Nitric Oxide Delivery Systems Market is estimated to be valued at USD 390.3 million in 2025 and is projected to reach USD 967.3 million by 2035, registering a compound annual growth rate (CAGR) of 9.5% over the forecast period.

The alginic acid market is undergoing consistent growth, propelled by rising demand from food processing, pharmaceutical formulations, and cosmetic applications. A growing focus on natural and sustainable ingredients in manufacturing processes has positioned alginic acid as a preferred biopolymer across industries.
The market is further supported by its diverse functional benefits, including water retention, gelling, and stabilizing properties, which make it indispensable in high-performance formulations. Increased regulatory acceptance of alginates as safe additives and the push towards cleaner labeling in food and personal care products have reinforced their adoption.
Ongoing innovation in extraction technologies and the utilization of algae as a renewable resource are paving the way for cost-effective production and expanded applications, ensuring sustained market expansion in the coming years.
The market is segmented by Type, Application, End User, and Product Type and region. By Type, the market is divided into Pediatrics and Adult. In terms of Application, the market is classified into Hypoxic Respiratory Failure (HRF), Acute Hypoxemic Respiratory Failure (AHRF), and Other Applications. Based on End User, the market is segmented into Hospitals, Ambulatory Centres, and Clinics. By Product Type, the market is divided into Disposables and System. Regionally, the market is classified into North America, Latin America, Western Europe, Eastern Europe, Balkan & Baltic Countries, Russia & Belarus, Central Asia, East Asia, South Asia & Pacific, and the Middle East & Africa.
When segmented by salts, sodium alginate is expected to command 27.5% of the market revenue in 2025, marking it as the leading subsegment in this category. This leadership has been driven by its superior solubility, ease of incorporation into formulations, and versatility in a wide range of applications.
Its ability to form stable gels and maintain viscosity under varying conditions has made it highly sought after in both food and pharmaceutical sectors. Manufacturers have prioritized sodium alginate due to its consistent performance, cost-effectiveness, and regulatory acceptance, which have collectively strengthened its position.
The segment’s prominence has also been enhanced by its adaptability to evolving consumer preferences for plant-derived and sustainable ingredients, reinforcing its market share.
Segmented by end user industry, the food industry is projected to hold 33.0% of the market revenue in 2025, positioning it as the most prominent sector. This dominance has been shaped by the industry’s increasing reliance on alginic acid and its derivatives to deliver desirable textures, stabilize emulsions, and improve shelf life of processed foods.
As consumer demand for clean label and natural additives has intensified, the food sector has responded by integrating alginates into bakery, dairy, and confectionery products. Enhanced production efficiency and compliance with food safety standards have further encouraged widespread use.
The segment’s leadership has also been supported by product differentiation strategies where alginates contribute to premium quality and innovation, securing their role in modern food formulations.
When analyzed by functionality, thickening agents are forecast to account for 29.0% of the market revenue in 2025, establishing themselves as the dominant functional category. This preeminence has been underpinned by the growing need for consistent texture and viscosity in a wide array of end products.
Alginic acid’s natural origin and high efficiency in creating uniform, stable thickness without altering taste or color have solidified its appeal. The demand for thickeners in both edible and topical applications has expanded, with manufacturers leveraging its rheological properties to meet performance and regulatory requirements.
The functionality’s leading share has also been reinforced by the ability to deliver cost savings through lower dosages and its compatibility with other ingredients, securing its position as an indispensable component in formulation strategies.

North America holds the largest market for Inhaled Nitric Oxide Delivery Systems and is likely to grow at a rapid pace in the next 10 years. This growth is because of the increasing cases of HRF in the region. In addition to this, the rising adoption of INO therapy, the presence of advanced medical infrastructure, and favorable government initiatives are expected to bolster growth avenues in the market.
Asthma affects more than 25 million people in the USA. 12 million adults have not yet received a COPD diagnosis, despite there being 14.8 million adults with the condition. In the USA, phase two and phase three clinical trials of inhaled nitric oxide for acute respiratory distress syndrome use the inhaled nitric oxide delivery method on a regular basis.
In 2024, more than 300,000 deaths from respiratory disorders were recorded in Canada. Five significant respiratory disorders, including asthma, chronic obstructive pulmonary disease (COPD), lung cancer, tuberculosis (TB), and cystic fibrosis, afflict the majority of Canadians. As these illnesses become more prevalent, the need for inhaled nitric oxide delivery systems in the area is growing along with them.
Asia Pacific has the fasted growing market for Inhaled Nitric Oxide Delivery Systems. This is mainly due to the increasing pollution and growing pediatric population in the region.
In Asia Pacific, China accounts for the largest share of the market for Inhaled Nitric Oxide Delivery Systems followed by India. This is because COPD is rapidly becoming recognized as a severe health issue in China. According to estimations, 8.2% of Chinese people have COPD, and the disease's death rate is around 1.6%.
In India, respiratory infections caused 41,996,260 illnesses and 3,740 deaths in 2020, according to the National Health Portal of India. Severe acute respiratory infections (SARI) are one of the leading causes of death in children under the age of five, accounting for 18% of the global population in India. As a result, there is a sharp rise in the demand for inhaled nitric oxide delivery systems in the country.

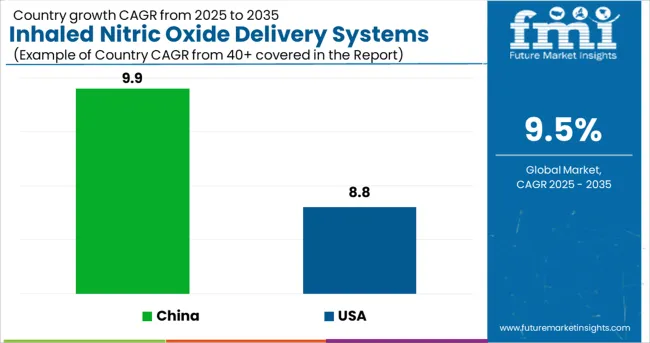
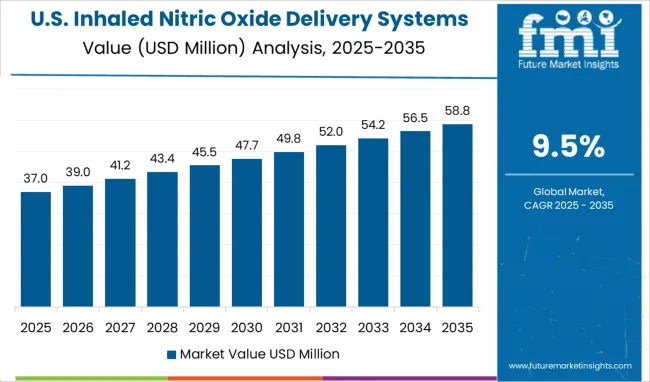
The USA holds the largest market for Inhaled Nitric Oxide Delivery Systems, which is projected to reach a valuation of USD 967.3 million by 2035. From 2020 to 2024, the market in the US grew at a CAGR of 8.8%. Between 2025 and 2035, the US is expected to be a market with a USD 153.7 million absolute dollar opportunity.
Since there are between 64.2 and 78.9 cases of ARDS per 100,000 people per year in the US, there exists a significant demand for Inhaled Nitric Oxide Delivery systems. Around 25% of ARDS patients are initially categorized as mild, with the remaining 75% being categorized as moderate or severe. A sickness that is moderate or severe develops in one-third of mild cases.
A further estimate places the annual number of term and late-preterm newborns in the USA with HRF at 80,000. In neonatal intensive care units (NICUs), respiratory morbidity affects about 15% of term newborns and 29% of late-preterm infants. These are the key reasons for the increasing demand for Inhaled Nitric Oxide Delivery Systems in the country.
In 2024, the market size of China is comparatively small. It was the second-largest Inhaled Nitric Oxide Delivery Systems Market after the US. The market in the country is expected to reach a valuation of USD 88.4 million by 2035. From 2020 to 2024, the market in China experienced a CAGR of 9.9% and is expected to experience a CAGR of 10.7% with an absolute dollar opportunity of USD 56.4 million.
With the increasing number of smokers in the country, respiratory diseases are also becoming quite common. In China, almost 1 million people know of COPD, which presents a significant opportunity for INO delivery systems marketers, as inhalation of nitric oxide has been clinically proven to improve the oxygenation of arterial blood flow and limit the amount of mechanical-assisted breathing treatments in patients with the severe acute respiratory syndrome (SARS).
The inhaled nitric oxide delivery systems market in the UK was held at USD 356.4 million in 2024. The market is projected to reach a valuation of USD 37.4 million by 2035. The UK market is expected to witness an absolute dollar opportunity of USD 24 million.
The inhaled nitric oxide delivery systems market in Japan is estimated at USD 390.3 million in 2025. The market in the country is projected to reach a valuation of USD 21.2 million by 2035. From 2025 to 2035, the market is expected to gross an absolute dollar opportunity of USD 12.1 million, growing at a CAGR of 8.8%.
Inhaled Nitric Oxide Delivery Systems are used the most among pediatrics. From 2020 to 2024, the use of INO Delivery Systems among pediatrics experienced a CAGR of 8.9% and is expected to witness a CAGR of 9.8% in the next ten years.
Inhaled nitric oxide has been significantly effective in the treatment of neonatal diseases such as hypoxic respiratory failure (HRF). In the USA alone, over 25,000 to 30,000 newborn HRF cases are recorded each year, wherein Inhaled Nitric Oxide Delivery System is used for treatment to cure more than half of them.
Inhaled Nitric Oxide Delivery Systems are used the most in the treatment of Hypoxic Respiratory Failure. The use of the INO delivery system in the treatment of HRF from the year 2020 to 2024 experienced a CAGR of 8.8% and is projected to experience a CAGR of 9.6% from 2025 to 2035.
In 2024, the treatment of Hypoxic Respiratory Failure using Inhaled Nitric Oxide Delivery Systems made up 80.2% of the overall market. Around 2% of all live births and those affected by HRF is also responsible for more than 33% of all neonatal deaths. The death of 18 out of every 1,000 newborns, the majority of whom are born prematurely in the USA, is due to the HRF. According to studies, Inhaled Nitric Oxide is used as the first line of treatment for HRF and it can be used for more than 10 days without causing complications.
The Inhaled Nitric Oxide Delivery Systems market is moderately competitive and has numerous players. With the growing demand for Inhaled Nitric Oxide Systems, new players are also entering the market. The key companies operating in the Inhaled Nitric Oxide Delivery Systems Market are Mallinckrodt Pharmaceuticals, Getinge, VERO Biotech, LINDE, Beyond Air, SLE, NU MED, Bellerophon Therapeutics, Air Liquide Healthcare, and Circassia Pharmaceuticals.
Some of the recent developments by the key providers of Inhaled Nitric Oxide Delivery Systems are as follows:
The global inhaled nitric oxide delivery systems market is estimated to be valued at USD 390.3 million in 2025.
It is projected to reach USD 967.3 million by 2035.
The market is expected to grow at a 9.5% CAGR between 2025 and 2035.
The key product types are pediatrics and adult.
hypoxic respiratory failure (hrf) segment is expected to dominate with a 48.6% industry share in 2025.


Our Research Products

The "Full Research Suite" delivers actionable market intel, deep dives on markets or technologies, so clients act faster, cut risk, and unlock growth.

The Leaderboard benchmarks and ranks top vendors, classifying them as Established Leaders, Leading Challengers, or Disruptors & Challengers.

Locates where complements amplify value and substitutes erode it, forecasting net impact by horizon

We deliver granular, decision-grade intel: market sizing, 5-year forecasts, pricing, adoption, usage, revenue, and operational KPIs—plus competitor tracking, regulation, and value chains—across 60 countries broadly.

Spot the shifts before they hit your P&L. We track inflection points, adoption curves, pricing moves, and ecosystem plays to show where demand is heading, why it is changing, and what to do next across high-growth markets and disruptive tech

Real-time reads of user behavior. We track shifting priorities, perceptions of today’s and next-gen services, and provider experience, then pace how fast tech moves from trial to adoption, blending buyer, consumer, and channel inputs with social signals (#WhySwitch, #UX).

Partner with our analyst team to build a custom report designed around your business priorities. From analysing market trends to assessing competitors or crafting bespoke datasets, we tailor insights to your needs.
Supplier Intelligence
Discovery & Profiling
Capacity & Footprint
Performance & Risk
Compliance & Governance
Commercial Readiness
Who Supplies Whom
Scorecards & Shortlists
Playbooks & Docs
Category Intelligence
Definition & Scope
Demand & Use Cases
Cost Drivers
Market Structure
Supply Chain Map
Trade & Policy
Operating Norms
Deliverables
Buyer Intelligence
Account Basics
Spend & Scope
Procurement Model
Vendor Requirements
Terms & Policies
Entry Strategy
Pain Points & Triggers
Outputs
Pricing Analysis
Benchmarks
Trends
Should-Cost
Indexation
Landed Cost
Commercial Terms
Deliverables
Brand Analysis
Positioning & Value Prop
Share & Presence
Customer Evidence
Go-to-Market
Digital & Reputation
Compliance & Trust
KPIs & Gaps
Outputs
Full Research Suite comprises of:
Market outlook & trends analysis
Interviews & case studies
Strategic recommendations
Vendor profiles & capabilities analysis
5-year forecasts
8 regions and 60+ country-level data splits
Market segment data splits
12 months of continuous data updates
DELIVERED AS:
PDF EXCEL ONLINE
Nitric Oxide Asthma Testing Market - Growth, Demand & Forecast 2025 to 2035
IOL Delivery Systems Market Size and Share Forecast Outlook 2025 to 2035
Gas Delivery Systems Market Growth - Trends & Forecast 2025 to 2035
Stent Delivery Systems Market Size and Share Forecast Outlook 2025 to 2035
Novel Drug Delivery Systems in Cancer Therapy Market Analysis – Growth & Forecast 2024-2034
Microneedle Drug Delivery Systems Market Report - Growth & Forecast 2025 to 2035
Dental Anesthesia Delivery Systems Market
Gastro-retentive Drug Delivery Systems Market - Trends & Demand 2025 to 2035
Delivery Management Software Market Size and Share Forecast Outlook 2025 to 2035
Systems Administration Management Tools Market Size and Share Forecast Outlook 2025 to 2035
Delivery Tracking Platform Market Size and Share Forecast Outlook 2025 to 2035
Nitric Acid Market Growth - Trends & Forecast 2025 to 2035
VRF Systems Market Growth - Trends & Forecast 2025 to 2035
Zinc Oxide Block Market Size and Share Forecast Outlook 2025 to 2035
Zinc Oxide Market Forecast and Outlook 2025 to 2035
Zinc Oxide Sunscreens Market Size and Share Forecast Outlook 2025 to 2035
Zinc Oxide for Sunscreens Market Analysis - Size, Share, and Forecast Outlook 2025 to 2035
Drug Delivery Technology Market is segmented by route of administration, and end user from 2025 to 2035
Drug Delivery Solutions Market Insights - Growth & Forecast 2025 to 2035
Iron Oxide Market Report - Growth, Demand & Forecast 2025 to 2035

Thank you!
You will receive an email from our Business Development Manager. Please be sure to check your SPAM/JUNK folder too.
Chat With
MaRIA