Locomotive Market Size, Share, and Forecast Outlook 2025 to 2035

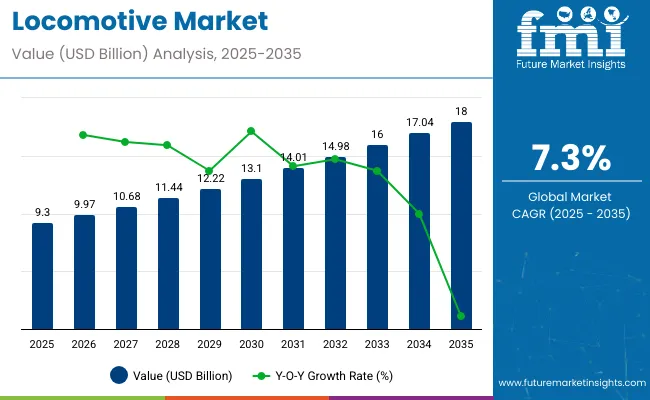
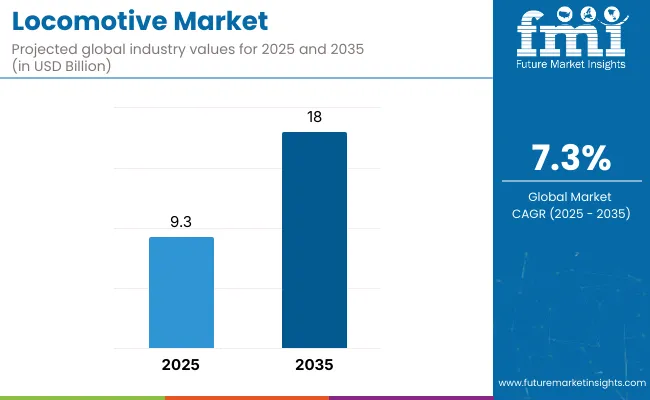
The global locomotive market is anticipated to reach USD 9.3 billion in 2025 and USD 18 billion by 2035, growing at a CAGR of 7.3%, representing a multiplying factor of approximately 1.94 over the decade. Growth is driven by rising rail freight demand, expansion of rail infrastructure, and modernization of passenger rail networks.
Locomotive Market 1

Quick stats of locomotive market

  • Locomotive Market size (2025): USD 9.3 billion
  • Projected Locomotive Market Size (2035): USD 18 billion
  • Forecast CAGR (2025 to 2035): 7.3%
  • Leading Segment in Locomotive Market(2025): Diesel
  • Key Growth Regions: North America, Europe, Asia Pacific
  • Top Key Players: CRRC Corporation Limited, Siemens AG, Alstom, Hitachi Ltd., Mitsubishi Heavy Industries Ltd.

Locomotive Market

Metric Value
Market Estimated Value in (2025E) USD 9.3 billion
Market Forecast Value in (2035F) USD 18 billion
Forecast CAGR (2025 to 2035) 7.3%

Investment in advanced locomotive technologies, including fuel-efficient engines, hybrid systems, and digital controls, supports long-term value accumulation. Market expansion is shaped by government initiatives, regional rail development, and a shift toward rail transport for both cargo and passengers.

The long-term value accumulation curve shows steady growth with phases of accelerated gains linked to technology adoption and network upgrades. Early stages reflect investments in fleet expansion and modernization, while mid-cycle periods benefit from efficiency improvements and regulatory incentives. By 2035, with a market value of 18 billion and nearly double the 2025 value, the curve is expected to steepen as advanced locomotives see broader adoption and rail networks integrate further. Strategic deployment of energy-efficient locomotives, digital monitoring systems, and optimized fleet management enables operators to navigate cyclical fluctuations while maximizing long-term returns, underlining the sector’s resilience and growth potential over the next decade.

The locomotive market is influenced by several core parent industries. Rail transport and operations account for about 45%, reflecting demand from freight and passenger operators. Engine and propulsion manufacturing contributes roughly 25%, covering diesel, electric, and hybrid engine systems. Rail infrastructure and signaling holds close to 15%, encompassing tracks, control systems, and electrification. Maintenance and repair services represent around 10%, supporting fleet reliability and lifecycle extension. Metal fabrication and component suppliers add approximately 5%, providing structural parts, bogies, and other critical assemblies.

The sector is advancing through electrification, hybrid propulsion, and automation. Manufacturers are increasingly introducing hybrid and battery-powered models to reduce emissions and energy costs. Digital solutions, including predictive maintenance, AI-driven performance monitoring, and remote diagnostics, are improving operational efficiency. Global operators are standardizing fleets to streamline maintenance and training while reducing costs. Lightweight materials, aerodynamic designs, and energy-efficient propulsion systems are gaining traction. Strategic alliances between rail operators, component suppliers, and technology providers are accelerating adoption of next-generation locomotives and integrating smart systems for safety, performance, and sustainability in long-haul freight and passenger services.

Top Locomotive Market Dynamics

The global locomotive market is projected to reach USD 9.3 billion in 2025 and USD 18 billion by 2035, growing at a CAGR of 7.3%. Diesel-electric locomotives continue to dominate, while electric and hybrid units are gaining traction in high-density freight and passenger corridors. Asia Pacific accounts for over 40% of new orders due to expanding rail networks and urban metro projects. Europe and North America focus on modernizing fleets with energy-efficient units. Increased freight demand, passenger mobility growth, and infrastructure upgrades support market expansion across major regions.

Driving Force Expansion of Freight and Passenger Networks

Rising industrial production and urbanization are driving locomotive demand for both freight and passenger applications. High-density freight routes are increasingly adopting electric traction to reduce fuel costs and emissions. Investment in high-speed rail projects in Asia and Europe is boosting the deployment of advanced passenger locomotives. Predictive maintenance and energy-efficient engines lower operational costs and reduce downtime, while government investments of USD 12-15 billion annually for rail modernization are fueling fleet replacement cycles.

  • Freight locomotives transport over 45% of raw materials in North America.
  • High-speed rail expansion in Asia is increasing passenger locomotive demand by nearly 8% annually.
  • Advanced traction technology lowers fuel consumption by up to 12%.

Growth Avenue Technological Integration and Electrification

The shift toward electric and hybrid locomotives is accelerating, with electric units expected to account for nearly 38% of new orders by 2030. Battery-electric and hydrogen fuel cell technologies are being trialed for regional passenger services. Digital fleet management and driver-assist systems optimize routing, predictive maintenance, and energy efficiency. Modular designs allow retrofitting older fleets, extending service life and reducing lifecycle costs.

  • Automation technology enhances safety and energy efficiency by 6-8%.
  • Electrification reduces fuel costs and emissions across dense corridors.
  • Digital platforms improve fleet monitoring, scheduling, and operational precision.

Emerging Trend Sustainable and High-Efficiency Operations

Locomotive manufacturers are focusing on energy-efficient designs, regenerative braking, and lightweight materials, reducing energy consumption by nearly 10%. Smart track integration and signaling systems improve operational efficiency on congested routes. Emerging markets are upgrading infrastructure to allow higher axle loads, increasing cargo capacity. Environmental compliance and efficiency improvements are driving adoption of modern locomotives while lowering operating costs.

  • Regenerative braking recovers 15-20% of energy previously lost as heat.
  • Aerodynamic designs reduce energy consumption and improve speed.
  • Infrastructure upgrades allow higher axle load capacity and cargo per trip.

Market Challenge High Capital Costs and Regulatory Compliance

New locomotives cost between USD 2.5 million for regional diesel units and over USD 12 million for high-speed electric trains. Maintenance, infrastructure adaptation, and emission compliance further raise total expenditure. Supply chain limitations for steel, electronics, and traction motors can delay production by 6-9 months. Fluctuating raw material and labor costs challenge operators aiming to modernize fleets while maintaining profitability.

  • Compliance with low-emission standards increases production costs.
  • Supply chain constraints can extend production timelines by several months.
  • Infrastructure adaptation for modern locomotives adds 15-18% to total expenditure.

Analyzing Locomotive Market by Top Investment Segments

The global locomotive market is primarily segmented by type, technology, component, and end-use. Diesel locomotives dominate regions with limited electrification, while electric locomotives are preferred on high-speed corridors. Traction motor efficiency and IGBT module adoption are central to fleet modernization, enhancing reliability and energy management. Freight operations are the largest end-use segment, driving locomotive production volumes. Manufacturers such as Siemens, CRRC, Alstom, Bombardier, and General Electric focus on high-horsepower engines, energy-efficient power electronics, and regenerative braking solutions.
Diesel leads Demand for Locomotives by Type

Locomotive Market By Type

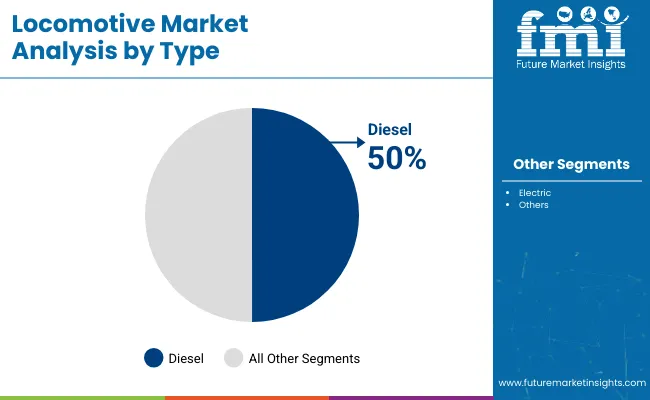
Diesel locomotives command 50% of the market, deployed mainly for freight and regional passenger transport. Electric locomotives hold 40% and are increasingly integrated into urban rail networks. Other types account for 10% and serve industrial or niche switching roles. Companies such as CRRC and General Electric operate diesel fleets capable of hauling 4,000-6,000 tons over 1,500 km per trip. Diesel engines continue to be cost-effective in regions without electrification, providing reliability and ease of maintenance. Fleet expansion is driven by increasing freight volumes and logistics requirements. Diesel locomotives are also being retrofitted with hybrid systems to reduce fuel consumption and emissions over long-haul routes.
  • Average diesel locomotive can transport 4,500 tons of cargo.
  • Freight corridors in Asia and North America utilize over 65% of diesel fleets.
  • Hybrid retrofits are projected to cover 12% of diesel fleets by 2026.

IGBT Module is likely to Dominate by Technology

Locomotive Market By Technology

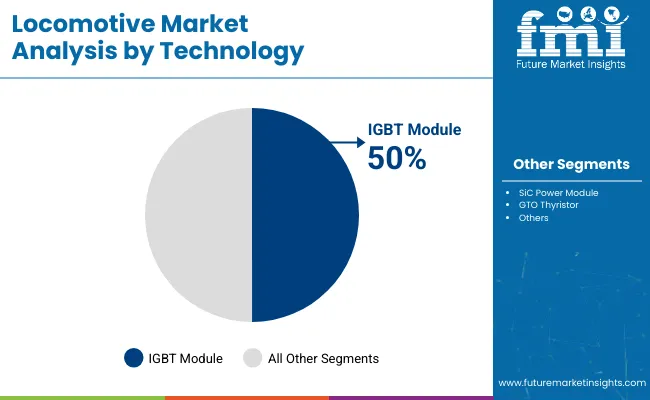
IGBT modules capture 50% share due to high voltage tolerance and efficiency in traction inverters, supporting both electric and hybrid diesel-electric locomotives. SiC modules are used in high-speed corridors, representing 30%, while GTO thyristors continue at 20%. IGBT modules improve acceleration, regenerative braking, and energy recovery efficiency. Siemens, Alstom, CRRC, and Hitachi are deploying IGBT-based systems in locomotives with traction outputs up to 6,000 kW. Market adoption is strongest in freight operations requiring precise control over power-intensive loads. Research indicates IGBT-equipped locomotives can cut energy loss by 18% compared with GTO-based systems.
  • Estimated 28,000 new IGBT modules will be shipped globally in 2025.
  • Adoption reduces traction inverter failures by approximately 22%.
  • Freight-heavy regions in Europe plan to upgrade over 40% of existing fleets.

Traction Motor leads Component Demand

Locomotive Market By Component

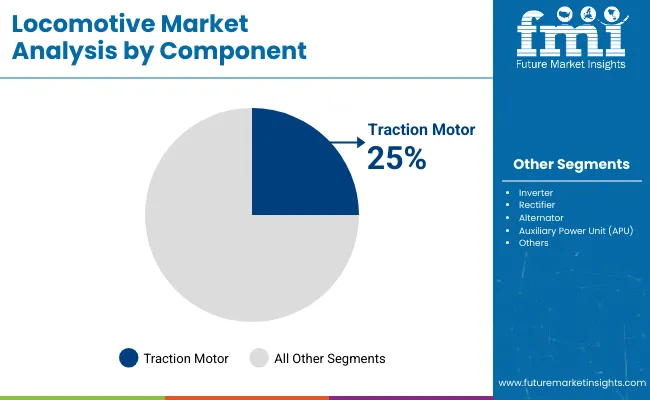
Traction motors hold 25% of component market share, converting electrical energy into mechanical motion for diesel, electric, and hybrid locomotives. Inverters follow at 20%, while rectifiers, alternators, and APUs each account for 15%. High-performance traction motors deliver torque ratings between 3,000-7,000 Nm, suitable for long-haul freight or passenger services at speeds of 80-200 km/h. Siemens, Bombardier, CRRC, and Alstom produce traction motors with enhanced thermal management and reduced weight for efficiency. Fleet operators report up to 10% reduction in maintenance cycles with upgraded motor designs. Manufacturing capacity is concentrated in Asia, Europe, and North America, reflecting regional rail investment patterns.
  • Over 60,000 traction motors projected to be produced globally in 2025.
  • Maintenance intervals extended by 15-20% with high-efficiency motors.
  • Thermal management systems improve motor lifespan by up to 12%.

Freight dominates Locomotive Market by End-Use

Locomotive Market By End Use

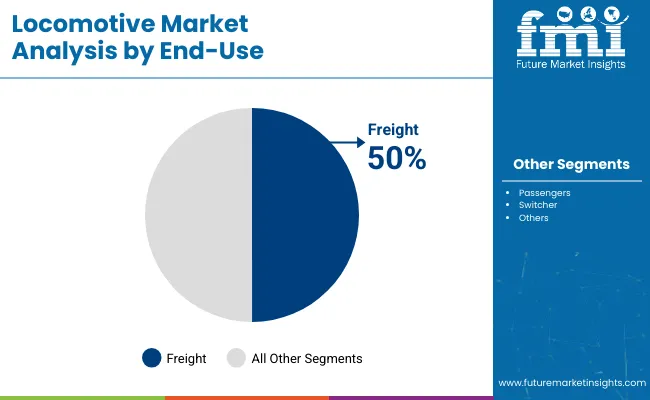
Freight locomotives account for 50% of demand, transporting bulk, intermodal, and industrial cargo. Passenger locomotives follow at 40%, while switcher locomotives represent 10%. High-powered locomotives of 3,500-4,500 horsepower are common on freight routes spanning 1,000-3,000 km. General Electric, CRRC, and Alstom maintain large fleets dedicated to freight, especially in North America and Asia. Fleet expansion focuses on high-capacity traction motors, IGBT modules, and regenerative braking for energy efficiency. Infrastructure development, such as upgraded freight corridors and intermodal terminals, further supports locomotive demand in industrially active regions.
  • 35% of freight locomotives operate in Asia, supporting mining and industrial supply chains.
  • Energy recovery systems in freight locomotives can save up to 5% fuel per year.
  • Intermodal freight locomotives typically handle 2-3 times the cargo volume of passenger units.

Top Countries Producing, Expanding, and Upgrading the Locomotive Market

Country Wise Locomotive Market

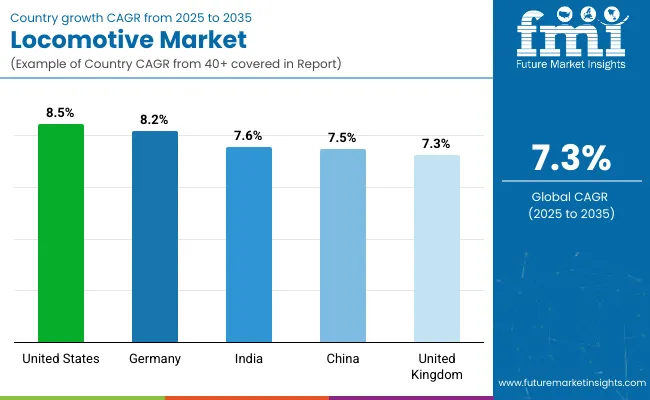
The global market is growing at a CAGR of 7.3% from 2025 to 2035. The United States leads at 8.5%, +16% above the global average, driven by OECD-supported fleet modernization and technological upgrades. Germany follows at 8.2%, +12% higher than the global rate, reflecting OECD investment in high-speed and freight locomotive improvements. India records 7.6%, +4% above the global CAGR, supported by BRICS-linked expansion in passenger and freight rail networks. China stands at 7.5%, +3% above the global rate, with BRICS-driven industrial rail and infrastructure projects accelerating demand. The United Kingdom matches the global rate at 7.3%, showing steady growth through OECD-backed network upgrades. The OECD markets are leading technology-focused expansion, while BRICS countries like India and China drive volume growth through infrastructure and industrial development.

Growth Analysis of Locomotive Market in the United States

The United States locomotive industry is projected to grow at a CAGR of 8.5%, exceeding the global 7.3%. Expansion is driven by freight demand, modernization of rail infrastructure, and government investments in electric and hybrid locomotives. High-volume cargo transport and regional logistics optimization contribute to increased fleet utilization. By 2030, the US is expected to account for around 20% of global locomotive demand. Technological adoption, including energy-efficient engines and predictive maintenance systems, supports accelerated growth. Despite rising competition from Asia and Europe, domestic investment in rail networks maintains a higher than average CAGR.

  • Freight transport projected to rise 5% annually
  • Electric and hybrid locomotive adoption expected to cover 30% of fleet by 2030
  • Predictive maintenance implementation projected to reduce downtime 10% per year

Locomotive Market Growth Outlook in Germany

The Demand of locomotives in Germany is expected to expand at a CAGR of 8.2%, above the global 7.3%. Growth is supported by strong freight and passenger rail demand, technological upgrades, and electrification programs. Germany is projected to account for nearly 12% of European locomotive demand by 2030. Investments focus on energy-efficient engines, digital train control, and network optimization. Regulatory frameworks promoting low-emission transport further accelerate modernization efforts. Fleet replacement programs and infrastructure upgrades support consistent growth, maintaining a CAGR above the global average.

  • Electrification of locomotive fleet projected at 40% by 2030
  • Freight network modernization expected to improve efficiency 6% annually
  • Digital train control adoption forecast to expand 25% by 2030

Future Forecast for Locomotive Market in India

India is projected to grow at a CAGR of 7.6%, slightly above the global 7.3%. Expansion is driven by freight corridor development, electrification projects, and increased passenger rail demand. By 2030, India is expected to account for roughly 10% of global locomotive demand. Government initiatives to modernize rail yards and introduce high-capacity locomotives support steady growth. Adoption of energy-efficient engines and predictive maintenance technologies enhances operational reliability. Despite infrastructure challenges and fleet limitations, market modernization programs keep growth slightly above global levels.

  • Freight corridor expansion projected to increase transport capacity 5% annually
  • Electrification of locomotives expected to reach 35% by 2030
  • Predictive maintenance implementation forecast to reduce breakdowns 8% per year

Locomotive Market Outlook in China

The Demand of locomotive in China is projected to grow at a CAGR of 7.5%, slightly above the global 7.3%. Growth is fueled by high freight transport volumes, expansion of high-speed rail networks, and modernization of locomotive fleets. By 2030, China is expected to represent around 25% of global demand. Investments in energy-efficient engines, hybrid systems, and predictive maintenance contribute to operational efficiency. Government-led infrastructure projects and increased domestic freight volumes maintain steady growth. Despite being marginally higher than global CAGR, market maturity and regulatory oversight moderate acceleration.

  • High-speed rail network expansion projected to increase 6% annually
  • Hybrid locomotive adoption expected to cover 20% of fleet by 2030
  • Predictive maintenance implementation forecast to improve uptime 7% per year

Future Outlook for Locomotive Market in the United Kingdom

The United Kingdom locomotive market is expected to expand at a CAGR of 7.3%, matching the global growth rate. Growth is driven by freight modernization, electrification programs, and maintenance upgrades. By 2030, the UK is expected to contribute approximately 5% of global locomotive demand. Investment in energy-efficient engines, digital signaling systems, and network optimization supports steady expansion. Regulatory compliance and emissions reduction initiatives influence operational strategies. Moderate fleet expansion combined with infrastructure improvements keeps growth aligned with global levels.
  • Electrification of locomotives projected at 30% by 2030
  • Digital signaling system adoption expected to improve efficiency 5% annually
  • Freight transport modernization forecast to increase capacity 4% per year

Leading Locomotive Manufacturers, Suppliers, Distributors

Locomotive Market By Company

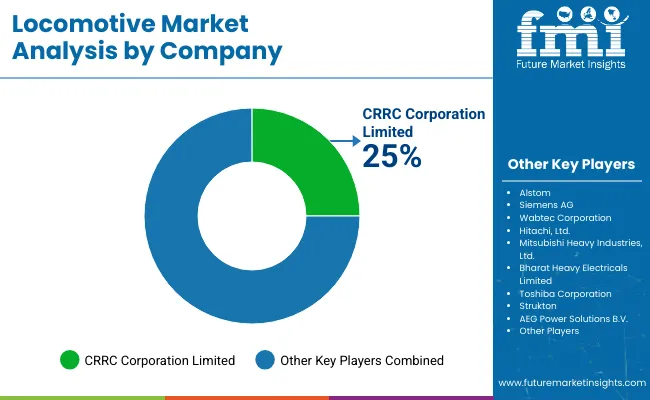
Top Player - CRRC Corporation Limited - 25%

The industry is shaped by a mix of established manufacturers and emerging players that focus on product diversification, fleet expansion, and strategic partnerships. CRRC Corporation Limited has strengthened its position through large-scale contracts with multiple railway operators and continuous development of high-capacity locomotives. Alstom and Siemens AG concentrate on advanced electric and diesel-electric locomotive offerings, while Wabtec Corporation emphasizes retrofit solutions and modernization services for older fleets. Hitachi, Ltd. and Mitsubishi Heavy Industries, Ltd. focus on regional projects and turnkey solutions, whereas Bharat Heavy Electricals Limited leverages its domestic manufacturing base to supply locomotives for national rail networks. Emerging players such as Strukton and Toshiba Corporation are exploring niche segments, including lightweight locomotives and modular designs, to gain a foothold in competitive markets.

Key strategies in this sector include research and development to improve efficiency, customized solutions for freight and passenger operations, and alliances with regional operators to expand global presence. AEG Power Solutions B.V. is investing in power management systems for locomotives, while Alstom recently launched new electric locomotive models for long-distance routes. These efforts illustrate how both established and emerging players are shaping the locomotive industry through innovation, targeted product launches, and strategic collaborations, ensuring they remain competitive in a rapidly evolving market.

Recent Industry News

  • In June 2025, Siemens launched the Charger B+AC, a battery-electric passenger locomotive for North American users.
  • In May 2025, Wabtec Corporation partnered with the Government of Guinea, Rio Tinto, and Chalco Iron Ore Holdings to develop a locomotive for the Simandou project.
  • In March 2025, Indian Railways introduced the EF-9K locomotive, capable of carrying 4,500 tonnes and reaching a top speed of 120 km/h.

Leading Players

  • Corporation Limited
  • Alstom
  • Siemens AG
  • Wabtec Corporation
  • Hitachi, Ltd.
  • Mitsubishi Heavy Industries, Ltd.
  • Bharat Heavy Electricals Limited
  • Toshiba Corporation
  • Strukton
  • AEG Power Solutions B.V

Report Scope

Report Attributes Details
Market Size (2025) USD 9.3 billion
Projected Market Size (2035) USD 18 billion
CAGR (2025 to 2035) 7.3%
Base Year for Estimation 2024
Historical Period 2020 to 2024
Projection Period 2025 to 2035
Quantitative Units USD billion for value
Type Segments Analyzed Diesel, Electric, Other
Technology Segments Analyzed IGBT Module, GTO Thyristor, SiC Power Module
Component Segments Analyzed Rectifier, Traction Motor, Alternator, Inverter, Auxiliary Power Unit (APU), Others
End-Use Segments Analyzed Freight, Passengers, Switcher
Regions Covered North America, Latin America, Western Europe, Eastern Europe, Asia Pacific, Middle East and Africa
Key Players AEG Power Solutions B.V., Alstom, Bharat Heavy Electricals Limited, Siemens AG, Strukton, Toshiba Corporation, Wabtec Corporation, CRRC Corporation Limited, Hitachi Ltd., Mitsubishi Heavy Industries Ltd.
Additional Attributes Dollar sales by locomotive type and application, demand dynamics across freight, passenger, and high-speed rail, regional trends across North America, Europe, and Asia-Pacific, innovation in electric and hybrid propulsion, digital control systems, environmental impact of emissions reduction, emerging use in automated and smart rail networks

Locomotive Market Analyzed by Key Investment Segments 

By Type:

  • Diesel
  • Electric
  • Other

By Technology:

  • IGBT Module
  • GTO Thyristor
  • SiC Power Module

By Component:

  • Rectifier
  • Traction Motor
  • Alternator
  • Inverter
  • Auxiliary Power Unit (APU)
  • Others

By End-Use:

  • Freight
  • Passengers
  • Switcher

By Region:

  • North America
  • Latin America
  • Western Europe
  • Eastern Europe
  • Asia Pacific
  • The Middle East and Africa

Table of Content

  1. Executive Summary
    • Global Market Outlook
    • Demand-side Trends
    • Supply-side Trends
    • Technology Roadmap Analysis
    • Analysis and Recommendations
  2. Market Overview
    • Market Coverage / Taxonomy
    • Market Definition / Scope / Limitations
  3. Market Background
    • Market Dynamics
      • Drivers
      • Restraints
      • Opportunity
      • Trends
    • Scenario Forecast
      • Demand in Optimistic Scenario
      • Demand in Likely Scenario
      • Demand in Conservative Scenario
    • Opportunity Map Analysis
    • Product Life Cycle Analysis
    • Supply Chain Analysis
      • Supply Side Participants and their Roles
        • Producers
        • Mid-Level Participants (Traders/ Agents/ Brokers)
        • Wholesalers and Distributors
      • Value Added and Value Created at Node in the Supply Chain
      • List of Raw Material Suppliers
      • List of Existing and Potential Buyer’s
    • Investment Feasibility Matrix
    • Value Chain Analysis
      • Profit Margin Analysis
      • Wholesalers and Distributors
      • Retailers
    • PESTLE and Porter’s Analysis
    • Regulatory Landscape
      • By Key Regions
      • By Key Countries
    • Regional Parent Market Outlook
    • Production and Consumption Statistics
    • Import and Export Statistics
  4. Global Market Analysis 2020 to 2024 and Forecast, 2025 to 2035
    • Historical Market Size Value (USD Billion) & Volume (Units) Analysis, 2020 to 2024
    • Current and Future Market Size Value (USD Billion) & Volume (Units) Projections, 2025 to 2035
      • Y-o-Y Growth Trend Analysis
      • Absolute $ Opportunity Analysis
  5. Global Market Pricing Analysis 2020 to 2024 and Forecast 2025 to 2035
  6. Global Market Analysis 2020 to 2024 and Forecast 2025 to 2035, By Type
    • Introduction / Key Findings
    • Historical Market Size Value (USD Billion) & Volume (Units) Analysis By Type, 2020 to 2024
    • Current and Future Market Size Value (USD Billion) & Volume (Units) Analysis and Forecast By Type, 2025 to 2035
      • Diesel
      • Electric
      • Other
    • Y-o-Y Growth Trend Analysis By Type, 2020 to 2024
    • Absolute $ Opportunity Analysis By Type, 2025 to 2035
  7. Global Market Analysis 2020 to 2024 and Forecast 2025 to 2035, By Technology
    • Introduction / Key Findings
    • Historical Market Size Value (USD Billion) & Volume (Units) Analysis By Technology, 2020 to 2024
    • Current and Future Market Size Value (USD Billion) & Volume (Units) Analysis and Forecast By Technology, 2025 to 2035
      • IGBT Module
      • SiC Power Module
      • GTO Thyristor
    • Y-o-Y Growth Trend Analysis By Technology, 2020 to 2024
    • Absolute $ Opportunity Analysis By Technology, 2025 to 2035
  8. Global Market Analysis 2020 to 2024 and Forecast 2025 to 2035, By Component
    • Introduction / Key Findings
    • Historical Market Size Value (USD Billion) & Volume (Units) Analysis By Component, 2020 to 2024
    • Current and Future Market Size Value (USD Billion) & Volume (Units) Analysis and Forecast By Component, 2025 to 2035
      • Traction Motor
      • Inverter
      • Rectifier
      • Alternator
      • Auxiliary Power Value (USD Billion) & Volume (Units) (APU)
      • Others
    • Y-o-Y Growth Trend Analysis By Component, 2020 to 2024
    • Absolute $ Opportunity Analysis By Component, 2025 to 2035
  9. Global Market Analysis 2020 to 2024 and Forecast 2025 to 2035, By End-Use
    • Introduction / Key Findings
    • Historical Market Size Value (USD Billion) & Volume (Units) Analysis By End-Use, 2020 to 2024
    • Current and Future Market Size Value (USD Billion) & Volume (Units) Analysis and Forecast By End-Use, 2025 to 2035
      • Freight
      • Passengers
      • Switcher
    • Y-o-Y Growth Trend Analysis By End-Use, 2020 to 2024
    • Absolute $ Opportunity Analysis By End-Use, 2025 to 2035
  10. Global Market Analysis 2020 to 2024 and Forecast 2025 to 2035, By Region
    • Introduction
    • Historical Market Size Value (USD Billion) & Volume (Units) Analysis By Region, 2020 to 2024
    • Current Market Size Value (USD Billion) & Volume (Units) Analysis and Forecast By Region, 2025 to 2035
      • North America
      • Latin America
      • Western Europe
      • Eastern Europe
      • East Asia
      • South Asia & Pacific
      • Middle East and Africa
    • Market Attractiveness Analysis By Region
  11. North America Market Analysis 2020 to 2024 and Forecast 2025 to 2035, By Country
    • Historical Market Size Value (USD Billion) & Volume (Units) Trend Analysis By Market Taxonomy, 2020 to 2024
    • Market Size Value (USD Billion) & Volume (Units) Forecast By Market Taxonomy, 2025 to 2035
      • By Country
        • USA
        • Canada
        • Mexico
      • By Type
      • By Technology
      • By Component
      • By End-Use
    • Market Attractiveness Analysis
      • By Country
      • By Type
      • By Technology
      • By Component
      • By End-Use
    • Key Takeaways
  12. Latin America Market Analysis 2020 to 2024 and Forecast 2025 to 2035, By Country
    • Historical Market Size Value (USD Billion) & Volume (Units) Trend Analysis By Market Taxonomy, 2020 to 2024
    • Market Size Value (USD Billion) & Volume (Units) Forecast By Market Taxonomy, 2025 to 2035
      • By Country
        • Brazil
        • Argentina
        • Rest of LATAM
      • By Type
      • By Technology
      • By Component
      • By End-Use
    • Market Attractiveness Analysis
      • By Country
      • By Type
      • By Technology
      • By Component
      • By End-Use
    • Key Takeaways
  13. Western Europe Market Analysis 2020 to 2024 and Forecast 2025 to 2035, By Country
    • Historical Market Size Value (USD Billion) & Volume (Units) Trend Analysis By Market Taxonomy, 2020 to 2024
    • Market Size Value (USD Billion) & Volume (Units) Forecast By Market Taxonomy, 2025 to 2035
      • By Country
        • Germany
        • Italy
        • France
        • UK
        • Spain
        • BENELUX
        • Nordic
        • Rest of W.Europe
      • By Type
      • By Technology
      • By Component
      • By End-Use
    • Market Attractiveness Analysis
      • By Country
      • By Type
      • By Technology
      • By Component
      • By End-Use
    • Key Takeaways
  14. Eastern Europe Market Analysis 2020 to 2024 and Forecast 2025 to 2035, By Country
    • Historical Market Size Value (USD Billion) & Volume (Units) Trend Analysis By Market Taxonomy, 2020 to 2024
    • Market Size Value (USD Billion) & Volume (Units) Forecast By Market Taxonomy, 2025 to 2035
      • By Country
        • Russia
        • Hungary
        • Poland
        • Balkan & Baltics
        • Rest of E. Europe
      • By Type
      • By Technology
      • By Component
      • By End-Use
    • Market Attractiveness Analysis
      • By Country
      • By Type
      • By Technology
      • By Component
      • By End-Use
    • Key Takeaways
  15. East Asia Market Analysis 2020 to 2024 and Forecast 2025 to 2035, By Country
    • Historical Market Size Value (USD Billion) & Volume (Units) Trend Analysis By Market Taxonomy, 2020 to 2024
    • Market Size Value (USD Billion) & Volume (Units) Forecast By Market Taxonomy, 2025 to 2035
      • By Country
        • China
        • Japan
        • South Korea
      • By Type
      • By Technology
      • By Component
      • By End-Use
    • Market Attractiveness Analysis
      • By Country
      • By Type
      • By Technology
      • By Component
      • By End-Use
    • Key Takeaways
  16. South Asia & Pacific Market Analysis 2020 to 2024 and Forecast 2025 to 2035, By Country
    • Historical Market Size Value (USD Billion) & Volume (Units) Trend Analysis By Market Taxonomy, 2020 to 2024
    • Market Size Value (USD Billion) & Volume (Units) Forecast By Market Taxonomy, 2025 to 2035
      • By Country
        • India
        • Australia & New Zealand
        • ASEAN
        • Rest of SAP
      • By Type
      • By Technology
      • By Component
      • By End-Use
    • Market Attractiveness Analysis
      • By Country
      • By Type
      • By Technology
      • By Component
      • By End-Use
    • Key Takeaways
  17. Middle East and Africa Market Analysis 2020 to 2024 and Forecast 2025 to 2035, By Country
    • Historical Market Size Value (USD Billion) & Volume (Units) Trend Analysis By Market Taxonomy, 2020 to 2024
    • Market Size Value (USD Billion) & Volume (Units) Forecast By Market Taxonomy, 2025 to 2035
      • By Country
        • GCC Countries
        • Northern Africa
        • South Africa
        • Turkiye
        • Rest of MEA
      • By Type
      • By Technology
      • By Component
      • By End-Use
    • Market Attractiveness Analysis
      • By Country
      • By Type
      • By Technology
      • By Component
      • By End-Use
    • Key Takeaways
  18. Key Countries Market Analysis
    • USA
      • Pricing Analysis
      • Market Share Analysis, 2024
        • By Type
        • By Technology
        • By Component
        • By End-Use
    • Canada
      • Pricing Analysis
      • Market Share Analysis, 2024
        • By Type
        • By Technology
        • By Component
        • By End-Use
    • Brazil
      • Pricing Analysis
      • Market Share Analysis, 2024
        • By Type
        • By Technology
        • By Component
        • By End-Use
    • Mexico
      • Pricing Analysis
      • Market Share Analysis, 2024
        • By Type
        • By Technology
        • By Component
        • By End-Use
    • Argentina
      • Pricing Analysis
      • Market Share Analysis, 2024
        • By Type
        • By Technology
        • By Component
        • By End-Use
  19. Market Structure Analysis
    • Competition Dashboard
    • Competition Benchmarking
    • Market Share Analysis of Top Players
      • By Regional
      • By Type
      • By Technology
      • By Component
      • By End-Use
  20. Competition Analysis
    • Competition Deep Dive
      • CRRC Corporation Limited
        • Overview
        • Product Portfolio
        • Profitability by Market Segments (Product/Age /Sales Channel/Region)
        • Sales Footprint
        • Strategy Overview
          • Marketing Strategy
          • Product Strategy
          • Channel Strategy
      • AEG Power Solutions B.V.
        • Overview
        • Product Portfolio
        • Profitability by Market Segments (Product/Age /Sales Channel/Region)
        • Sales Footprint
        • Strategy Overview
          • Marketing Strategy
          • Product Strategy
          • Channel Strategy
      • Alstom
        • Overview
        • Product Portfolio
        • Profitability by Market Segments (Product/Age /Sales Channel/Region)
        • Sales Footprint
        • Strategy Overview
          • Marketing Strategy
          • Product Strategy
          • Channel Strategy
      • Siemens AG
        • Overview
        • Product Portfolio
        • Profitability by Market Segments (Product/Age /Sales Channel/Region)
        • Sales Footprint
        • Strategy Overview
          • Marketing Strategy
          • Product Strategy
          • Channel Strategy
      • Wabtec Corporation
        • Overview
        • Product Portfolio
        • Profitability by Market Segments (Product/Age /Sales Channel/Region)
        • Sales Footprint
        • Strategy Overview
          • Marketing Strategy
          • Product Strategy
          • Channel Strategy
      • Hitachi, Ltd.
        • Overview
        • Product Portfolio
        • Profitability by Market Segments (Product/Age /Sales Channel/Region)
        • Sales Footprint
        • Strategy Overview
          • Marketing Strategy
          • Product Strategy
          • Channel Strategy
      • Mitsubishi Heavy Industries, Ltd.
        • Overview
        • Product Portfolio
        • Profitability by Market Segments (Product/Age /Sales Channel/Region)
        • Sales Footprint
        • Strategy Overview
          • Marketing Strategy
          • Product Strategy
          • Channel Strategy
      • Bharat Heavy Electricals Limited
        • Overview
        • Product Portfolio
        • Profitability by Market Segments (Product/Age /Sales Channel/Region)
        • Sales Footprint
        • Strategy Overview
          • Marketing Strategy
          • Product Strategy
          • Channel Strategy
      • Toshiba Corporation
        • Overview
        • Product Portfolio
        • Profitability by Market Segments (Product/Age /Sales Channel/Region)
        • Sales Footprint
        • Strategy Overview
          • Marketing Strategy
          • Product Strategy
          • Channel Strategy
      • Strukton
        • Overview
        • Product Portfolio
        • Profitability by Market Segments (Product/Age /Sales Channel/Region)
        • Sales Footprint
        • Strategy Overview
          • Marketing Strategy
          • Product Strategy
          • Channel Strategy
  21. Assumptions & Acronyms Used
  22. Research Methodology

List of Tables

  • Table 1: Global Market Value (USD Billion) Forecast by Region, 2020-2035
  • Table 2: Global Market Volume (Units) Forecast by Region, 2020-2035
  • Table 3: Global Market Value (USD Billion) Forecast by Type, 2020-2035
  • Table 4: Global Market Volume (Units) Forecast by Type, 2020-2035
  • Table 5: Global Market Value (USD Billion) Forecast by Technology, 2020-2035
  • Table 6: Global Market Volume (Units) Forecast by Technology, 2020-2035
  • Table 7: Global Market Value (USD Billion) Forecast by Component, 2020-2035
  • Table 8: Global Market Volume (Units) Forecast by Component, 2020-2035
  • Table 9: Global Market Value (USD Billion) Forecast by End-Use, 2020-2035
  • Table 10: Global Market Volume (Units) Forecast by End-Use, 2020-2035
  • Table 11: North America Market Value (USD Billion) Forecast by Country, 2020-2035
  • Table 12: North America Market Volume (Units) Forecast by Country, 2020-2035
  • Table 13: North America Market Value (USD Billion) Forecast by Type, 2020-2035
  • Table 14: North America Market Volume (Units) Forecast by Type, 2020-2035
  • Table 15: North America Market Value (USD Billion) Forecast by Technology, 2020-2035
  • Table 16: North America Market Volume (Units) Forecast by Technology, 2020-2035
  • Table 17: North America Market Value (USD Billion) Forecast by Component, 2020-2035
  • Table 18: North America Market Volume (Units) Forecast by Component, 2020-2035
  • Table 19: North America Market Value (USD Billion) Forecast by End-Use, 2020-2035
  • Table 20: North America Market Volume (Units) Forecast by End-Use, 2020-2035
  • Table 21: Latin America Market Value (USD Billion) Forecast by Country, 2020-2035
  • Table 22: Latin America Market Volume (Units) Forecast by Country, 2020-2035
  • Table 23: Latin America Market Value (USD Billion) Forecast by Type, 2020-2035
  • Table 24: Latin America Market Volume (Units) Forecast by Type, 2020-2035
  • Table 25: Latin America Market Value (USD Billion) Forecast by Technology, 2020-2035
  • Table 26: Latin America Market Volume (Units) Forecast by Technology, 2020-2035
  • Table 27: Latin America Market Value (USD Billion) Forecast by Component, 2020-2035
  • Table 28: Latin America Market Volume (Units) Forecast by Component, 2020-2035
  • Table 29: Latin America Market Value (USD Billion) Forecast by End-Use, 2020-2035
  • Table 30: Latin America Market Volume (Units) Forecast by End-Use, 2020-2035
  • Table 31: Western Europe Market Value (USD Billion) Forecast by Country, 2020-2035
  • Table 32: Western Europe Market Volume (Units) Forecast by Country, 2020-2035
  • Table 33: Western Europe Market Value (USD Billion) Forecast by Type, 2020-2035
  • Table 34: Western Europe Market Volume (Units) Forecast by Type, 2020-2035
  • Table 35: Western Europe Market Value (USD Billion) Forecast by Technology, 2020-2035
  • Table 36: Western Europe Market Volume (Units) Forecast by Technology, 2020-2035
  • Table 37: Western Europe Market Value (USD Billion) Forecast by Component, 2020-2035
  • Table 38: Western Europe Market Volume (Units) Forecast by Component, 2020-2035
  • Table 39: Western Europe Market Value (USD Billion) Forecast by End-Use, 2020-2035
  • Table 40: Western Europe Market Volume (Units) Forecast by End-Use, 2020-2035
  • Table 41: Eastern Europe Market Value (USD Billion) Forecast by Country, 2020-2035
  • Table 42: Eastern Europe Market Volume (Units) Forecast by Country, 2020-2035
  • Table 43: Eastern Europe Market Value (USD Billion) Forecast by Type, 2020-2035
  • Table 44: Eastern Europe Market Volume (Units) Forecast by Type, 2020-2035
  • Table 45: Eastern Europe Market Value (USD Billion) Forecast by Technology, 2020-2035
  • Table 46: Eastern Europe Market Volume (Units) Forecast by Technology, 2020-2035
  • Table 47: Eastern Europe Market Value (USD Billion) Forecast by Component, 2020-2035
  • Table 48: Eastern Europe Market Volume (Units) Forecast by Component, 2020-2035
  • Table 49: Eastern Europe Market Value (USD Billion) Forecast by End-Use, 2020-2035
  • Table 50: Eastern Europe Market Volume (Units) Forecast by End-Use, 2020-2035
  • Table 51: East Asia Market Value (USD Billion) Forecast by Country, 2020-2035
  • Table 52: East Asia Market Volume (Units) Forecast by Country, 2020-2035
  • Table 53: East Asia Market Value (USD Billion) Forecast by Type, 2020-2035
  • Table 54: East Asia Market Volume (Units) Forecast by Type, 2020-2035
  • Table 55: East Asia Market Value (USD Billion) Forecast by Technology, 2020-2035
  • Table 56: East Asia Market Volume (Units) Forecast by Technology, 2020-2035
  • Table 57: East Asia Market Value (USD Billion) Forecast by Component, 2020-2035
  • Table 58: East Asia Market Volume (Units) Forecast by Component, 2020-2035
  • Table 59: East Asia Market Value (USD Billion) Forecast by End-Use, 2020-2035
  • Table 60: East Asia Market Volume (Units) Forecast by End-Use, 2020-2035
  • Table 61: South Asia & Pacific Market Value (USD Billion) Forecast by Country, 2020-2035
  • Table 62: South Asia & Pacific Market Volume (Units) Forecast by Country, 2020-2035
  • Table 63: South Asia & Pacific Market Value (USD Billion) Forecast by Type, 2020-2035
  • Table 64: South Asia & Pacific Market Volume (Units) Forecast by Type, 2020-2035
  • Table 65: South Asia & Pacific Market Value (USD Billion) Forecast by Technology, 2020-2035
  • Table 66: South Asia & Pacific Market Volume (Units) Forecast by Technology, 2020-2035
  • Table 67: South Asia & Pacific Market Value (USD Billion) Forecast by Component, 2020-2035
  • Table 68: South Asia & Pacific Market Volume (Units) Forecast by Component, 2020-2035
  • Table 69: South Asia & Pacific Market Value (USD Billion) Forecast by End-Use, 2020-2035
  • Table 70: South Asia & Pacific Market Volume (Units) Forecast by End-Use, 2020-2035
  • Table 71: Middle East and Africa Market Value (USD Billion) Forecast by Country, 2020-2035
  • Table 72: Middle East and Africa Market Volume (Units) Forecast by Country, 2020-2035
  • Table 73: Middle East and Africa Market Value (USD Billion) Forecast by Type, 2020-2035
  • Table 74: Middle East and Africa Market Volume (Units) Forecast by Type, 2020-2035
  • Table 75: Middle East and Africa Market Value (USD Billion) Forecast by Technology, 2020-2035
  • Table 76: Middle East and Africa Market Volume (Units) Forecast by Technology, 2020-2035
  • Table 77: Middle East and Africa Market Value (USD Billion) Forecast by Component, 2020-2035
  • Table 78: Middle East and Africa Market Volume (Units) Forecast by Component, 2020-2035
  • Table 79: Middle East and Africa Market Value (USD Billion) Forecast by End-Use, 2020-2035
  • Table 80: Middle East and Africa Market Volume (Units) Forecast by End-Use, 2020-2035

List of Figures

  • Figure 1: Global Market Volume (Units) Forecast 2020-2035
  • Figure 2: Global Market Pricing Analysis
  • Figure 3: Global Market Value (USD Billion) Forecast 2020-2035
  • Figure 4: Global Market Value Share and BPS Analysis by Type, 2025 and 2035
  • Figure 5: Global Market Y-o-Y Growth Comparison by Type, 2025-2035
  • Figure 6: Global Market Attractiveness Analysis by Type
  • Figure 7: Global Market Value Share and BPS Analysis by Technology, 2025 and 2035
  • Figure 8: Global Market Y-o-Y Growth Comparison by Technology, 2025-2035
  • Figure 9: Global Market Attractiveness Analysis by Technology
  • Figure 10: Global Market Value Share and BPS Analysis by Component, 2025 and 2035
  • Figure 11: Global Market Y-o-Y Growth Comparison by Component, 2025-2035
  • Figure 12: Global Market Attractiveness Analysis by Component
  • Figure 13: Global Market Value Share and BPS Analysis by End-Use, 2025 and 2035
  • Figure 14: Global Market Y-o-Y Growth Comparison by End-Use, 2025-2035
  • Figure 15: Global Market Attractiveness Analysis by End-Use
  • Figure 16: Global Market Value (USD Billion) Share and BPS Analysis by Region, 2025 and 2035
  • Figure 17: Global Market Y-o-Y Growth Comparison by Region, 2025-2035
  • Figure 18: Global Market Attractiveness Analysis by Region
  • Figure 19: North America Market Incremental $ Opportunity, 2025-2035
  • Figure 20: Latin America Market Incremental $ Opportunity, 2025-2035
  • Figure 21: Western Europe Market Incremental $ Opportunity, 2025-2035
  • Figure 22: Eastern Europe Market Incremental $ Opportunity, 2025-2035
  • Figure 23: East Asia Market Incremental $ Opportunity, 2025-2035
  • Figure 24: South Asia & Pacific Market Incremental $ Opportunity, 2025-2035
  • Figure 25: Middle East and Africa Market Incremental $ Opportunity, 2025-2035
  • Figure 26: North America Market Value Share and BPS Analysis by Country, 2025 and 2035
  • Figure 27: North America Market Value Share and BPS Analysis by Type, 2025 and 2035
  • Figure 28: North America Market Y-o-Y Growth Comparison by Type, 2025-2035
  • Figure 29: North America Market Attractiveness Analysis by Type
  • Figure 30: North America Market Value Share and BPS Analysis by Technology, 2025 and 2035
  • Figure 31: North America Market Y-o-Y Growth Comparison by Technology, 2025-2035
  • Figure 32: North America Market Attractiveness Analysis by Technology
  • Figure 33: North America Market Value Share and BPS Analysis by Component, 2025 and 2035
  • Figure 34: North America Market Y-o-Y Growth Comparison by Component, 2025-2035
  • Figure 35: North America Market Attractiveness Analysis by Component
  • Figure 36: North America Market Value Share and BPS Analysis by End-Use, 2025 and 2035
  • Figure 37: North America Market Y-o-Y Growth Comparison by End-Use, 2025-2035
  • Figure 38: North America Market Attractiveness Analysis by End-Use
  • Figure 39: Latin America Market Value Share and BPS Analysis by Country, 2025 and 2035
  • Figure 40: Latin America Market Value Share and BPS Analysis by Type, 2025 and 2035
  • Figure 41: Latin America Market Y-o-Y Growth Comparison by Type, 2025-2035
  • Figure 42: Latin America Market Attractiveness Analysis by Type
  • Figure 43: Latin America Market Value Share and BPS Analysis by Technology, 2025 and 2035
  • Figure 44: Latin America Market Y-o-Y Growth Comparison by Technology, 2025-2035
  • Figure 45: Latin America Market Attractiveness Analysis by Technology
  • Figure 46: Latin America Market Value Share and BPS Analysis by Component, 2025 and 2035
  • Figure 47: Latin America Market Y-o-Y Growth Comparison by Component, 2025-2035
  • Figure 48: Latin America Market Attractiveness Analysis by Component
  • Figure 49: Latin America Market Value Share and BPS Analysis by End-Use, 2025 and 2035
  • Figure 50: Latin America Market Y-o-Y Growth Comparison by End-Use, 2025-2035
  • Figure 51: Latin America Market Attractiveness Analysis by End-Use
  • Figure 52: Western Europe Market Value Share and BPS Analysis by Country, 2025 and 2035
  • Figure 53: Western Europe Market Value Share and BPS Analysis by Type, 2025 and 2035
  • Figure 54: Western Europe Market Y-o-Y Growth Comparison by Type, 2025-2035
  • Figure 55: Western Europe Market Attractiveness Analysis by Type
  • Figure 56: Western Europe Market Value Share and BPS Analysis by Technology, 2025 and 2035
  • Figure 57: Western Europe Market Y-o-Y Growth Comparison by Technology, 2025-2035
  • Figure 58: Western Europe Market Attractiveness Analysis by Technology
  • Figure 59: Western Europe Market Value Share and BPS Analysis by Component, 2025 and 2035
  • Figure 60: Western Europe Market Y-o-Y Growth Comparison by Component, 2025-2035
  • Figure 61: Western Europe Market Attractiveness Analysis by Component
  • Figure 62: Western Europe Market Value Share and BPS Analysis by End-Use, 2025 and 2035
  • Figure 63: Western Europe Market Y-o-Y Growth Comparison by End-Use, 2025-2035
  • Figure 64: Western Europe Market Attractiveness Analysis by End-Use
  • Figure 65: Eastern Europe Market Value Share and BPS Analysis by Country, 2025 and 2035
  • Figure 66: Eastern Europe Market Value Share and BPS Analysis by Type, 2025 and 2035
  • Figure 67: Eastern Europe Market Y-o-Y Growth Comparison by Type, 2025-2035
  • Figure 68: Eastern Europe Market Attractiveness Analysis by Type
  • Figure 69: Eastern Europe Market Value Share and BPS Analysis by Technology, 2025 and 2035
  • Figure 70: Eastern Europe Market Y-o-Y Growth Comparison by Technology, 2025-2035
  • Figure 71: Eastern Europe Market Attractiveness Analysis by Technology
  • Figure 72: Eastern Europe Market Value Share and BPS Analysis by Component, 2025 and 2035
  • Figure 73: Eastern Europe Market Y-o-Y Growth Comparison by Component, 2025-2035
  • Figure 74: Eastern Europe Market Attractiveness Analysis by Component
  • Figure 75: Eastern Europe Market Value Share and BPS Analysis by End-Use, 2025 and 2035
  • Figure 76: Eastern Europe Market Y-o-Y Growth Comparison by End-Use, 2025-2035
  • Figure 77: Eastern Europe Market Attractiveness Analysis by End-Use
  • Figure 78: East Asia Market Value Share and BPS Analysis by Country, 2025 and 2035
  • Figure 79: East Asia Market Value Share and BPS Analysis by Type, 2025 and 2035
  • Figure 80: East Asia Market Y-o-Y Growth Comparison by Type, 2025-2035
  • Figure 81: East Asia Market Attractiveness Analysis by Type
  • Figure 82: East Asia Market Value Share and BPS Analysis by Technology, 2025 and 2035
  • Figure 83: East Asia Market Y-o-Y Growth Comparison by Technology, 2025-2035
  • Figure 84: East Asia Market Attractiveness Analysis by Technology
  • Figure 85: East Asia Market Value Share and BPS Analysis by Component, 2025 and 2035
  • Figure 86: East Asia Market Y-o-Y Growth Comparison by Component, 2025-2035
  • Figure 87: East Asia Market Attractiveness Analysis by Component
  • Figure 88: East Asia Market Value Share and BPS Analysis by End-Use, 2025 and 2035
  • Figure 89: East Asia Market Y-o-Y Growth Comparison by End-Use, 2025-2035
  • Figure 90: East Asia Market Attractiveness Analysis by End-Use
  • Figure 91: South Asia & Pacific Market Value Share and BPS Analysis by Country, 2025 and 2035
  • Figure 92: South Asia & Pacific Market Value Share and BPS Analysis by Type, 2025 and 2035
  • Figure 93: South Asia & Pacific Market Y-o-Y Growth Comparison by Type, 2025-2035
  • Figure 94: South Asia & Pacific Market Attractiveness Analysis by Type
  • Figure 95: South Asia & Pacific Market Value Share and BPS Analysis by Technology, 2025 and 2035
  • Figure 96: South Asia & Pacific Market Y-o-Y Growth Comparison by Technology, 2025-2035
  • Figure 97: South Asia & Pacific Market Attractiveness Analysis by Technology
  • Figure 98: South Asia & Pacific Market Value Share and BPS Analysis by Component, 2025 and 2035
  • Figure 99: South Asia & Pacific Market Y-o-Y Growth Comparison by Component, 2025-2035
  • Figure 100: South Asia & Pacific Market Attractiveness Analysis by Component
  • Figure 101: South Asia & Pacific Market Value Share and BPS Analysis by End-Use, 2025 and 2035
  • Figure 102: South Asia & Pacific Market Y-o-Y Growth Comparison by End-Use, 2025-2035
  • Figure 103: South Asia & Pacific Market Attractiveness Analysis by End-Use
  • Figure 104: Middle East and Africa Market Value Share and BPS Analysis by Country, 2025 and 2035
  • Figure 105: Middle East and Africa Market Value Share and BPS Analysis by Type, 2025 and 2035
  • Figure 106: Middle East and Africa Market Y-o-Y Growth Comparison by Type, 2025-2035
  • Figure 107: Middle East and Africa Market Attractiveness Analysis by Type
  • Figure 108: Middle East and Africa Market Value Share and BPS Analysis by Technology, 2025 and 2035
  • Figure 109: Middle East and Africa Market Y-o-Y Growth Comparison by Technology, 2025-2035
  • Figure 110: Middle East and Africa Market Attractiveness Analysis by Technology
  • Figure 111: Middle East and Africa Market Value Share and BPS Analysis by Component, 2025 and 2035
  • Figure 112: Middle East and Africa Market Y-o-Y Growth Comparison by Component, 2025-2035
  • Figure 113: Middle East and Africa Market Attractiveness Analysis by Component
  • Figure 114: Middle East and Africa Market Value Share and BPS Analysis by End-Use, 2025 and 2035
  • Figure 115: Middle East and Africa Market Y-o-Y Growth Comparison by End-Use, 2025-2035
  • Figure 116: Middle East and Africa Market Attractiveness Analysis by End-Use
  • Figure 117: Global Market - Tier Structure Analysis
  • Figure 118: Global Market - Company Share Analysis

Frequently Asked Questions

What is the market size of locomotive market in 2025?

The locomotive market is valued at USD 9.3 billion in 2025.

What is the projected market size of locomotive market in 2035?

The market is expected to reach USD 18 billion by 2035.

What is the forecast CAGR of locomotive market from 2025 to 2035?

The market is growing at a CAGR of 7.3% between 2025 and 2035.

Which segment leads the locomotive market in 2025?

Diesel locomotives account for the largest share at 50% in 2025.

Who is the top key player in locomotive market?

CRRC Corporation Limited holds the leading position with a 25% market share.

Explore Similar Insights

Future Market Insights

Locomotive Market

Chat With

MaRIA

Hi There, I am MaRIA, Your Market Research Intelligence Assistant. How may I help you?