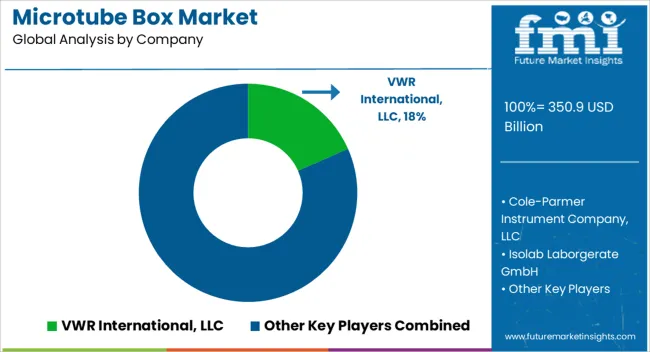
Microtube Box Market Outlook

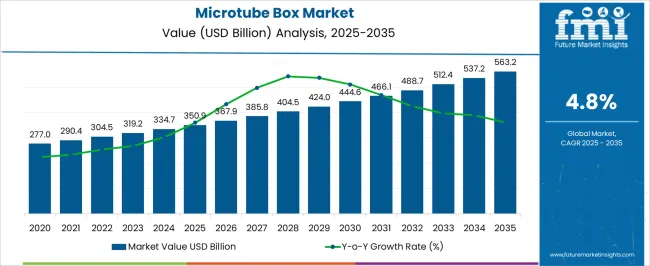
By 2033, the global microtube box market size is anticipated to have evolved to US$ 522.5 million, up from US$ 317.7 million in 2023. The microtube box sales are anticipated to advance at a CAGR of 5.1% from 2023 to 2033. The market share of micro tube boxes has increased due to expanding diagnostic activities and rising expenditures on research and development.

The adoption of microtube box is expanding because more people choose sustainable lives and low-waste habits. The emerging demand for attractive and recyclable microtube packaging in the chemical and pharmaceutical sectors aids the market expansion for microtube box. Adopting post-consumer recycled materials in manufacturing microtube boxes is a trend that escalates the market growth for microtube box.

Attributes Details
Market Value for 2023 US$ 317.7 million
Market Value for 2033 US$ 522.5 million
Market CAGR from 2023 to 2033 5.1%

Don't pay for what you don't need

Customize your report by selecting specific countries or regions and save 30%!

Market Forces Shaping the Microtube Box Demand

  • The microtube box manufacturers are increasingly relying on e-commerce as a sales channel. Reaching a larger consumer base requires an effective internet presence and distribution network.
  • The development of scientific research, particularly in areas like genomics, proteomics, and molecular biology, significantly impacts the microtube box market. The need for top-notch storage and organization options, such as microtube boxes, is still strong as these fields develop.
  • Due to the advantages of automation for laboratories in terms of efficiency and accuracy, the trend is growing. Microtube boxes in automated systems are essential for sample management, tracking, and retrieval, stimulating market expansion for microtube box.
  • Public and private biobanks are becoming more crucial for drug development and medical research. Microtube boxes are essential for organizing and storing biological samples, which motivates demand.

Emerging Opportunities in the Microtube Storage Market

  • The development of research and diagnostics, notably in genomics, proteomics, and molecular biology, has led to a steady rise in the microtube box sector. There is a significant and ongoing need to capitalize on as laboratories and research centers require these items.
  • Eco-friendly microtube boxes of recyclable or biodegradable materials are in greater demand due to the increased emphasis on environmental sustainability. A sizable opportunity may exist in creating and selling sustainable choices.
  • In highly regulated industries like pharmaceuticals or clinical research, having microtube boxes that adhere to industry and safety regulations can be a significant selling factor.
Ismail Sutaria
Ismail Sutaria

Principal Consultant

Talk to Analyst

Find your sweet spots for generating winning opportunities in this market.

The Microtube Box Market Faces Restrictive Forces

  • Customers frequently look for affordable solutions since the microtube box market is price-sensitive. Microtube box manufacturers may struggle to keep costs down while retaining quality.
  • With several microtube box suppliers, the market is quite competitive. Due to the fierce competition, profit margins may be reduced, and marketing efforts to differentiate items may advance.
  • Rising environmental awareness has resulted in a demand for more sustainable packaging procedures and materials. Microtube box manufacturers may be forced to make expensive investments in eco-friendly substitutes.
  • Reduced expenditure on research and development can impact the market for the microtube boxes used in scientific research. Economic instability or downturns can also have this effect.

Tracking the Microtube Box Market Path From 2018 to 2022 and Predicting the Future From 2023 to 2033

Short-term Analysis (From 2018 to 2022)

The microtube box market expanded gradually from 2018 to 2022, propelled by improvements in sample storage technologies and rising life science demand. The market experienced a low CAGR, with the accelerating adoption of automated storage systems and biobanking facilities sustaining growth.

Mid-term Analysis (From 2023 to 2028)

The microtube box market is anticipated to expand in the mid-term, between 2023 and 2028. The development of new materials, adopting environmentally friendly production techniques, and integrating data management systems ought to be significant forces.

Long-term Analysis (From 2028 to 2033)

The microtube box market is anticipated to grow at a robust CAGR between 2028 and 2033, looking out further. To serve the rising biotech and pharmaceutical sectors, market players for microtube box are likely to focus on creating intelligent, high-capacity storage solutions and cutting-edge designs. Eco-friendly and sustainable items are bound to grow.

Get the data you need at a Fraction of the cost

Personalize your report by choosing insights you need
and save 40%!

Category Wise Outlook

A detailed market segmentation analysis summarizes this portion of the study. Consumer demand for plastic and microtube box trends in the industry attracts more attention from manufacturers. Regarding capacity, the 51 to 100 Tube category commands the market.

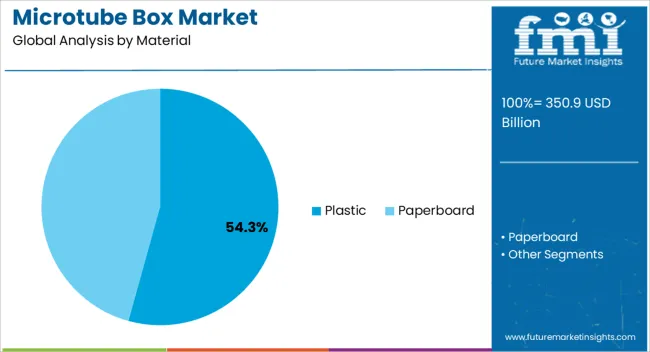
Plastic Microtube Boxes Lead the Market

Due to its strength, adaptability, and affordability, plastic dominates the microtube box market. Plastic microtube boxes are the best choice for various industries, including healthcare and research, since they provide the best defense against moisture and physical harm. Plastic boxes are suitable for freezing and heating since they can endure a greater range of temperatures.

Category Material
Leading Segment Plastic
Segment Share 82.8%

Plastic microtube boxes can be branded and labeled, which helps to distinguish products and build brand recognition. Reusing plastic boxes lowers waste and long-term costs. These characteristics make plastic the material of choice, offering an environmentally friendly answer to their packaging requirements, and boosting microtube boxes demand.

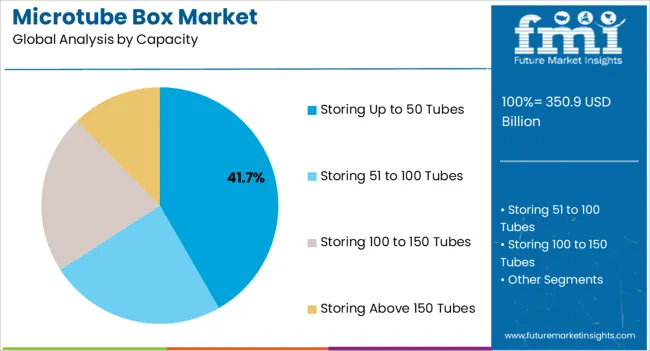
The Dominance of 51-100 Tubes Microtube Boxes in the Market

Due to its flexible capacity that meets various laboratory and storage needs, the 51 to 100 tubes segment commands the microtube box market share. The 51 to 100 tubes segment is famous for many enterprises since it balances space use with storage effectiveness. While keeping a small and influential form factor, the 51 to 100 tubes section offers enough storage for moderately sized collections.

Category Capacity
Leading Segment 51 to 100 Tube
Segment Share 42.4%

For its adaptability, it can satisfy the various needs of companies in multiple industries, increasing its market share as a preferred option. The popularity of the 51 to 100 tubes category is evidence of its capacity to satisfy the practical requirements of a wide range of customers, which underpins its market leadership.
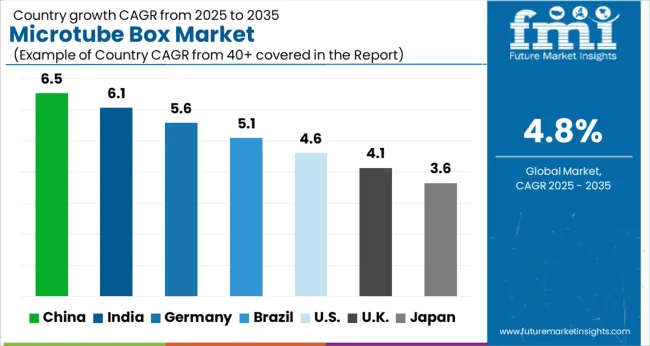
Country-wise Analysis

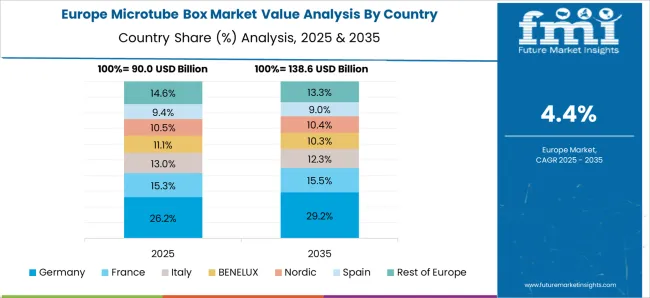
This part examines a thorough market analysis with information on various nations. Asia Pacific, Europe, and North America are all undergoing market growth. Europe has been developing consistently, followed by Asia Pacific, and North America has enormous opportunities for microtube box manufacturers.

The Evolving Landscape of the North America Microtube Box Sector

  • The booming life sciences and research sectors are the primary catalysts of the microtube box market in the United States.
  • Growth is fueled by escalating demand for sample storage solutions from laboratories and pharmaceutical industries.
  • Microtube box manufacturers continue to have chances owing to strict quality requirements and research breakthroughs.
Attributes Details
United States Market CAGR 3.2%
Canada Market CAGR 4.4%
  • With a significant emphasis on medical and biotechnology applications, Canada's microtube box industry is expanding consistently.
  • Canada's investment in research and development initiatives and increased clinical and research facilities offer a promising market environment for companies.

A Forward-Looking Perspective on the Europe Microtube Box Industry

  • The developed life sciences sector in the United Kingdom is distinctive for the microtube box market.
  • The demand for microtube boxes is stable due to ongoing research projects and technical advancements.
  • The expanding biotechnology and pharmaceutical industries in France are the primary drivers of the microtube box industry.
  • The need for superior storage solutions persists, especially with an emphasis on research and development.
  • Research institution-private company partnerships present new opportunities.
  • Italy's persistent commitment to scientific discovery and medical progress has impacted the Italy microtube box market.
  • In addition to a competitive market environment, there is space for business growth because storage solutions remain in high demand in healthcare and research facilities.
Attributes Details
United Kingdom Market CAGR 4.5%
France Market CAGR 3.7%
Italy Market CAGR 3.2%
Spain Market CAGR 2.9%
Germany Market CAGR 2.2%
  • The life sciences and healthcare industries represent significant growth in the microtube box market in Spain.
  • Due to the rise in biotech startups and research projects, there are opportunities for businesses that increase the need for dependable storage solutions.
  • The microtube box industry is booming due to Germany's well-known biotechnology and pharmaceutical sectors.
  • Germany constantly needs high-caliber storage choices with an emphasis on innovation and precision.
  • Collaboration with academic and research institutes has a lot of business advantages.

Economic Impact and Market Trends in the Asia Pacific Sector

  • The rising biotech and pharmaceutical sectors are the main drivers of China's microtube box market's rapid expansion.
  • China is a desirable market for microtube box providers because of its emphasis on research and development and its manufacturing skills.
  • The steady expansion of pharmaceutical firms and research labs in India is mainly accountable for the microtube box market. There are plenty of business opportunities because of the continued high demand for affordable and practical storage solutions.
  • Thailand's biotechnology and healthcare industries are expanding, which has led to the development of the microtube box industry.
  • Thailand's strategic position in Southeast Asia makes it a center for research and development in the area, opening doors for microtube box companies.
Attributes Details
India Market CAGR 7.7%
China Market CAGR 6.8%
Thailand Market CAGR 6.6%
Japan Market CAGR 3.5%
South Korea Market CAGR 5.9%
  • Japan's well-established life sciences and technology industries drive the demand for microtube boxes. The market is still profitable as long as it emphasizes accuracy and innovation.
  • Businesses may benefit from collaborating with regional research and medical organizations.
  • South Korea's superior healthcare and research sectors push the soaring microtube box industry.
  • The dedication of South Korea to scientific breakthroughs and the existence of multiple biotech firms fosters a climate ideal for microtube box businesses to flourish.

Competitive Landscape Analysis

The microtube box market's competitive landscape has a vibrant environment with several significant competitors contending for market share. Companies dominate the market, providing a variety of cutting-edge and excellent microtube boxes for use in laboratories and research. The market participants of microtube box compete on variables such as product quality, cost, and distribution systems.

To compete with established businesses, emerging ones propose novel features, materials, and eco-friendly choices. The microtube box industry is anticipated to become competitive as the need for sample storage solutions increases, promoting innovation and helping customers.

Latest Strides

Company Details
Tobin Scientific and Avantor to create a partnership
  • A pioneer in biopharma storage and logistics, Tobin Scientific and Avantor, a global distributor of vital goods and services, created a partnership.
  • The partnership provides complete solutions for moving labs, research facilities, and samples for United States biopharma clients, satisfying the growing need for specialized logistics.
  • Customers can concentrate on developing scientific research because of the partnership's ability to streamline transfers, reduce downtime, and meet quality standards.
  • Collaboration improves efficiency, security, and flexibility for biopharma and life science enterprises.
Labguru collaborates with Avantor
  • Labguru, a platform for research-to-production, and Avantor, a global supplier of lab supplies, have joined forces to simplify the lab purchasing process.
  • Integrating Inventory Manager from Avantor and Electronic Lab Notebook from Labguru, a single platform for scientists to access top-notch lab supplies is produced.
  • Researchers can save time and work more efficiently by streamlining inventory management and product ordering, which promotes science.
  • The partnership may benefit many scientists and researchers because Labguru's solutions cover many scientific disciplines.

Vital Microtube Box Manufacturers

  • VWR International, LLC
  • Medax International Inc
  • Cole-Parmer Instrument Company, LLC
  • Isolab Laborgerate GmbH
  • Ritter GmbH
  • Rose Plastic India Pvt. Ltd
  • Thermo Fisher Scientific Inc.
  • Bioline Technologies
  • MTM Molded Products Company
  • Ritter GmbH
  • Axil Scientific Pte Ltd

Key Segments

By Material:

  • Plastic
    • Polyethylene
    • Polycarbonate
    • Polyethylene Terephthalate
    • Polypropylene
    • Other Plastics (PVC, PS, etc.)
  • Paperboard

By Capacity:

  • Storing Up to 50 Tubes
  • Storing 51 to 100 Tubes
  • Storing 100 to 150 Tubes
  • Storing Above 150 Tubes

By Region:

  • North America
  • Latin America
  • Europe
  • East Asia
  • South Asia
  • Middle East and Africa
  • Oceania

Frequently Asked Questions

What is the Current Microtube Box Market Valuation?

The market to secure a valuation of US$ 317.7 million in 2023.

How Big Can the Microtube Box Market Be by 2033?

The market is estimated to reach US$ 522.5 million by 2033.

What is the Growth Potential of the Microtube Box Market?

Through 2033, the industry is anticipated to expand at a 5.1% CAGR.

Which Material Segment to Dominate in the Microtube Box Market?

The plastic sector is set to achieve a market share of 82.8%.

Which Capacity Segment to Lead the Microtube Box Market?

A 42.4% market share is expected for the 51 to 100 tube sectors.

Table of Content
1. Executive Summary
    1.1. Global Market Outlook
    1.2. Demand-side Trends
    1.3. Supply-side Trends
    1.4. Technology Roadmap Analysis
    1.5. Analysis and Recommendations
2. Market Overview
    2.1. Market Coverage / Taxonomy
    2.2. Market Definition / Scope / Limitations
3. Market Background
    3.1. Market Dynamics
        3.1.1. Drivers
        3.1.2. Restraints
        3.1.3. Opportunity
        3.1.4. Trends
    3.2. Scenario Forecast
        3.2.1. Demand in Optimistic Scenario
        3.2.2. Demand in Likely Scenario
        3.2.3. Demand in Conservative Scenario
    3.3. Opportunity Map Analysis
    3.4. Product Life Cycle Analysis
    3.5. Supply Chain Analysis
        3.5.1. Supply Side Participants and their Roles
            3.5.1.1. Producers
            3.5.1.2. Mid-Level Participants (Traders/ Agents/ Brokers)
            3.5.1.3. Wholesalers and Distributors
        3.5.2. Value Added and Value Created at Node in the Supply Chain
        3.5.3. List of Raw Material Suppliers
        3.5.4. List of Existing and Potential Buyer’s
    3.6. Investment Feasibility Matrix
    3.7. Value Chain Analysis
        3.7.1. Profit Margin Analysis
        3.7.2. Wholesalers and Distributors
        3.7.3. Retailers
    3.8. PESTLE and Porter’s Analysis
    3.9. Regulatory Landscape
        3.9.1. By Key Regions
        3.9.2. By Key Countries
    3.10. Regional Parent Market Outlook
    3.11. Production and Consumption Statistics
    3.12. Import and Export Statistics
4. Global Market Analysis 2018 to 2022 and Forecast, 2023 to 2033
    4.1. Historical Market Size Value (US$ Million) & Volume (Units) Analysis, 2018 to 2022
    4.2. Current and Future Market Size Value (US$ Million) & Volume (Units) Projections, 2023 to 2033
        4.2.1. Y-o-Y Growth Trend Analysis
        4.2.2. Absolute $ Opportunity Analysis
5. Global Market Analysis 2018 to 2022 and Forecast 2023 to 2033, By Material
    5.1. Introduction / Key Findings
    5.2. Historical Market Size Value (US$ Million) & Volume (Units) Analysis By Material, 2018 to 2022
    5.3. Current and Future Market Size Value (US$ Million) & Volume (Units) Analysis and Forecast By Material, 2023 to 2033
        5.3.1. Plastic
            5.3.1.1. Polyethylene
            5.3.1.2. Polycarbonate
            5.3.1.3. Polyethylene Terephthalate
            5.3.1.4. Polypropylene
            5.3.1.5. Other Plastics
        5.3.2. Paperboard
    5.4. Y-o-Y Growth Trend Analysis By Material, 2018 to 2022
    5.5. Absolute $ Opportunity Analysis By Material, 2023 to 2033
6. Global Market Analysis 2018 to 2022 and Forecast 2023 to 2033, By Capacity
    6.1. Introduction / Key Findings
    6.2. Historical Market Size Value (US$ Million) & Volume (Units) Analysis By Capacity, 2018 to 2022
    6.3. Current and Future Market Size Value (US$ Million) & Volume (Units) Analysis and Forecast By Capacity, 2023 to 2033
        6.3.1. Storing Up to 50 Tubes
        6.3.2. Storing 51 to 100 Tubes
        6.3.3. Storing 100 to 150 Tubes
        6.3.4. Storing Above 150 Tubes
    6.4. Y-o-Y Growth Trend Analysis By Capacity, 2018 to 2022
    6.5. Absolute $ Opportunity Analysis By Capacity, 2023 to 2033
7. Global Market Analysis 2018 to 2022 and Forecast 2023 to 2033, By Region
    7.1. Introduction
    7.2. Historical Market Size Value (US$ Million) & Volume (Units) Analysis By Region, 2018 to 2022
    7.3. Current Market Size Value (US$ Million) & Volume (Units) Analysis and Forecast By Region, 2023 to 2033
        7.3.1. North America
        7.3.2. Latin America
        7.3.3. Western Europe
        7.3.4. Eastern Europe
        7.3.5. South Asia and Pacific
        7.3.6. East Asia
        7.3.7. Middle East and Africa
    7.4. Market Attractiveness Analysis By Region
8. North America Market Analysis 2018 to 2022 and Forecast 2023 to 2033, By Country
    8.1. Historical Market Size Value (US$ Million) & Volume (Units) Trend Analysis By Market Taxonomy, 2018 to 2022
    8.2. Market Size Value (US$ Million) & Volume (Units) Forecast By Market Taxonomy, 2023 to 2033
        8.2.1. By Country
            8.2.1.1. USA
            8.2.1.2. Canada
        8.2.2. By Material
        8.2.3. By Capacity
    8.3. Market Attractiveness Analysis
        8.3.1. By Country
        8.3.2. By Material
        8.3.3. By Capacity
    8.4. Key Takeaways
9. Latin America Market Analysis 2018 to 2022 and Forecast 2023 to 2033, By Country
    9.1. Historical Market Size Value (US$ Million) & Volume (Units) Trend Analysis By Market Taxonomy, 2018 to 2022
    9.2. Market Size Value (US$ Million) & Volume (Units) Forecast By Market Taxonomy, 2023 to 2033
        9.2.1. By Country
            9.2.1.1. Brazil
            9.2.1.2. Mexico
            9.2.1.3. Rest of Latin America
        9.2.2. By Material
        9.2.3. By Capacity
    9.3. Market Attractiveness Analysis
        9.3.1. By Country
        9.3.2. By Material
        9.3.3. By Capacity
    9.4. Key Takeaways
10. Western Europe Market Analysis 2018 to 2022 and Forecast 2023 to 2033, By Country
    10.1. Historical Market Size Value (US$ Million) & Volume (Units) Trend Analysis By Market Taxonomy, 2018 to 2022
    10.2. Market Size Value (US$ Million) & Volume (Units) Forecast By Market Taxonomy, 2023 to 2033
        10.2.1. By Country
            10.2.1.1. Germany
            10.2.1.2. UK
            10.2.1.3. France
            10.2.1.4. Spain
            10.2.1.5. Italy
            10.2.1.6. Rest of Western Europe
        10.2.2. By Material
        10.2.3. By Capacity
    10.3. Market Attractiveness Analysis
        10.3.1. By Country
        10.3.2. By Material
        10.3.3. By Capacity
    10.4. Key Takeaways
11. Eastern Europe Market Analysis 2018 to 2022 and Forecast 2023 to 2033, By Country
    11.1. Historical Market Size Value (US$ Million) & Volume (Units) Trend Analysis By Market Taxonomy, 2018 to 2022
    11.2. Market Size Value (US$ Million) & Volume (Units) Forecast By Market Taxonomy, 2023 to 2033
        11.2.1. By Country
            11.2.1.1. Poland
            11.2.1.2. Russia
            11.2.1.3. Czech Republic
            11.2.1.4. Romania
            11.2.1.5. Rest of Eastern Europe
        11.2.2. By Material
        11.2.3. By Capacity
    11.3. Market Attractiveness Analysis
        11.3.1. By Country
        11.3.2. By Material
        11.3.3. By Capacity
    11.4. Key Takeaways
12. South Asia and Pacific Market Analysis 2018 to 2022 and Forecast 2023 to 2033, By Country
    12.1. Historical Market Size Value (US$ Million) & Volume (Units) Trend Analysis By Market Taxonomy, 2018 to 2022
    12.2. Market Size Value (US$ Million) & Volume (Units) Forecast By Market Taxonomy, 2023 to 2033
        12.2.1. By Country
            12.2.1.1. India
            12.2.1.2. Bangladesh
            12.2.1.3. Australia
            12.2.1.4. New Zealand
            12.2.1.5. Rest of South Asia and Pacific
        12.2.2. By Material
        12.2.3. By Capacity
    12.3. Market Attractiveness Analysis
        12.3.1. By Country
        12.3.2. By Material
        12.3.3. By Capacity
    12.4. Key Takeaways
13. East Asia Market Analysis 2018 to 2022 and Forecast 2023 to 2033, By Country
    13.1. Historical Market Size Value (US$ Million) & Volume (Units) Trend Analysis By Market Taxonomy, 2018 to 2022
    13.2. Market Size Value (US$ Million) & Volume (Units) Forecast By Market Taxonomy, 2023 to 2033
        13.2.1. By Country
            13.2.1.1. China
            13.2.1.2. Japan
            13.2.1.3. South Korea
        13.2.2. By Material
        13.2.3. By Capacity
    13.3. Market Attractiveness Analysis
        13.3.1. By Country
        13.3.2. By Material
        13.3.3. By Capacity
    13.4. Key Takeaways
14. Middle East and Africa Market Analysis 2018 to 2022 and Forecast 2023 to 2033, By Country
    14.1. Historical Market Size Value (US$ Million) & Volume (Units) Trend Analysis By Market Taxonomy, 2018 to 2022
    14.2. Market Size Value (US$ Million) & Volume (Units) Forecast By Market Taxonomy, 2023 to 2033
        14.2.1. By Country
            14.2.1.1. GCC Countries
            14.2.1.2. South Africa
            14.2.1.3. Israel
            14.2.1.4. Rest of MEA
        14.2.2. By Material
        14.2.3. By Capacity
    14.3. Market Attractiveness Analysis
        14.3.1. By Country
        14.3.2. By Material
        14.3.3. By Capacity
    14.4. Key Takeaways
15. Key Countries Market Analysis
    15.1. USA
        15.1.1. Pricing Analysis
        15.1.2. Market Share Analysis, 2022
            15.1.2.1. By Material
            15.1.2.2. By Capacity
    15.2. Canada
        15.2.1. Pricing Analysis
        15.2.2. Market Share Analysis, 2022
            15.2.2.1. By Material
            15.2.2.2. By Capacity
    15.3. Brazil
        15.3.1. Pricing Analysis
        15.3.2. Market Share Analysis, 2022
            15.3.2.1. By Material
            15.3.2.2. By Capacity
    15.4. Mexico
        15.4.1. Pricing Analysis
        15.4.2. Market Share Analysis, 2022
            15.4.2.1. By Material
            15.4.2.2. By Capacity
    15.5. Germany
        15.5.1. Pricing Analysis
        15.5.2. Market Share Analysis, 2022
            15.5.2.1. By Material
            15.5.2.2. By Capacity
    15.6. UK
        15.6.1. Pricing Analysis
        15.6.2. Market Share Analysis, 2022
            15.6.2.1. By Material
            15.6.2.2. By Capacity
    15.7. France
        15.7.1. Pricing Analysis
        15.7.2. Market Share Analysis, 2022
            15.7.2.1. By Material
            15.7.2.2. By Capacity
    15.8. Spain
        15.8.1. Pricing Analysis
        15.8.2. Market Share Analysis, 2022
            15.8.2.1. By Material
            15.8.2.2. By Capacity
    15.9. Italy
        15.9.1. Pricing Analysis
        15.9.2. Market Share Analysis, 2022
            15.9.2.1. By Material
            15.9.2.2. By Capacity
    15.10. Poland
        15.10.1. Pricing Analysis
        15.10.2. Market Share Analysis, 2022
            15.10.2.1. By Material
            15.10.2.2. By Capacity
    15.11. Russia
        15.11.1. Pricing Analysis
        15.11.2. Market Share Analysis, 2022
            15.11.2.1. By Material
            15.11.2.2. By Capacity
    15.12. Czech Republic
        15.12.1. Pricing Analysis
        15.12.2. Market Share Analysis, 2022
            15.12.2.1. By Material
            15.12.2.2. By Capacity
    15.13. Romania
        15.13.1. Pricing Analysis
        15.13.2. Market Share Analysis, 2022
            15.13.2.1. By Material
            15.13.2.2. By Capacity
    15.14. India
        15.14.1. Pricing Analysis
        15.14.2. Market Share Analysis, 2022
            15.14.2.1. By Material
            15.14.2.2. By Capacity
    15.15. Bangladesh
        15.15.1. Pricing Analysis
        15.15.2. Market Share Analysis, 2022
            15.15.2.1. By Material
            15.15.2.2. By Capacity
    15.16. Australia
        15.16.1. Pricing Analysis
        15.16.2. Market Share Analysis, 2022
            15.16.2.1. By Material
            15.16.2.2. By Capacity
    15.17. New Zealand
        15.17.1. Pricing Analysis
        15.17.2. Market Share Analysis, 2022
            15.17.2.1. By Material
            15.17.2.2. By Capacity
    15.18. China
        15.18.1. Pricing Analysis
        15.18.2. Market Share Analysis, 2022
            15.18.2.1. By Material
            15.18.2.2. By Capacity
    15.19. Japan
        15.19.1. Pricing Analysis
        15.19.2. Market Share Analysis, 2022
            15.19.2.1. By Material
            15.19.2.2. By Capacity
    15.20. South Korea
        15.20.1. Pricing Analysis
        15.20.2. Market Share Analysis, 2022
            15.20.2.1. By Material
            15.20.2.2. By Capacity
    15.21. GCC Countries
        15.21.1. Pricing Analysis
        15.21.2. Market Share Analysis, 2022
            15.21.2.1. By Material
            15.21.2.2. By Capacity
    15.22. South Africa
        15.22.1. Pricing Analysis
        15.22.2. Market Share Analysis, 2022
            15.22.2.1. By Material
            15.22.2.2. By Capacity
    15.23. Israel
        15.23.1. Pricing Analysis
        15.23.2. Market Share Analysis, 2022
            15.23.2.1. By Material
            15.23.2.2. By Capacity
16. Market Structure Analysis
    16.1. Competition Dashboard
    16.2. Competition Benchmarking
    16.3. Market Share Analysis of Top Players
        16.3.1. By Regional
        16.3.2. By Material
        16.3.3. By Capacity
17. Competition Analysis
    17.1. Competition Deep Dive
        17.1.1. VWR International, LLC
            17.1.1.1. Overview
            17.1.1.2. Product Portfolio
            17.1.1.3. Profitability by Market Segments
            17.1.1.4. Sales Footprint
            17.1.1.5. Strategy Overview
                17.1.1.5.1. Marketing Strategy
                17.1.1.5.2. Product Strategy
                17.1.1.5.3. Channel Strategy
        17.1.2. Cole-Parmer Instrument Company, LLC
            17.1.2.1. Overview
            17.1.2.2. Product Portfolio
            17.1.2.3. Profitability by Market Segments
            17.1.2.4. Sales Footprint
            17.1.2.5. Strategy Overview
                17.1.2.5.1. Marketing Strategy
                17.1.2.5.2. Product Strategy
                17.1.2.5.3. Channel Strategy
        17.1.3. Isolab Laborgerate GmbH
            17.1.3.1. Overview
            17.1.3.2. Product Portfolio
            17.1.3.3. Profitability by Market Segments
            17.1.3.4. Sales Footprint
            17.1.3.5. Strategy Overview
                17.1.3.5.1. Marketing Strategy
                17.1.3.5.2. Product Strategy
                17.1.3.5.3. Channel Strategy
        17.1.4. Bioline Technologies
            17.1.4.1. Overview
            17.1.4.2. Product Portfolio
            17.1.4.3. Profitability by Market Segments
            17.1.4.4. Sales Footprint
            17.1.4.5. Strategy Overview
                17.1.4.5.1. Marketing Strategy
                17.1.4.5.2. Product Strategy
                17.1.4.5.3. Channel Strategy
        17.1.5. MTM Molded Products Company
            17.1.5.1. Overview
            17.1.5.2. Product Portfolio
            17.1.5.3. Profitability by Market Segments
            17.1.5.4. Sales Footprint
            17.1.5.5. Strategy Overview
                17.1.5.5.1. Marketing Strategy
                17.1.5.5.2. Product Strategy
                17.1.5.5.3. Channel Strategy
        17.1.6. Axil Scientific Pte Ltd
            17.1.6.1. Overview
            17.1.6.2. Product Portfolio
            17.1.6.3. Profitability by Market Segments
            17.1.6.4. Sales Footprint
            17.1.6.5. Strategy Overview
                17.1.6.5.1. Marketing Strategy
                17.1.6.5.2. Product Strategy
                17.1.6.5.3. Channel Strategy
        17.1.7. Tarsons
            17.1.7.1. Overview
            17.1.7.2. Product Portfolio
            17.1.7.3. Profitability by Market Segments
            17.1.7.4. Sales Footprint
            17.1.7.5. Strategy Overview
                17.1.7.5.1. Marketing Strategy
                17.1.7.5.2. Product Strategy
                17.1.7.5.3. Channel Strategy
        17.1.8. Biotechnology Co., Ltd.
            17.1.8.1. Overview
            17.1.8.2. Product Portfolio
            17.1.8.3. Profitability by Market Segments
            17.1.8.4. Sales Footprint
            17.1.8.5. Strategy Overview
                17.1.8.5.1. Marketing Strategy
                17.1.8.5.2. Product Strategy
                17.1.8.5.3. Channel Strategy
        17.1.9. Heathrow Scientific
            17.1.9.1. Overview
            17.1.9.2. Product Portfolio
            17.1.9.3. Profitability by Market Segments
            17.1.9.4. Sales Footprint
            17.1.9.5. Strategy Overview
                17.1.9.5.1. Marketing Strategy
                17.1.9.5.2. Product Strategy
                17.1.9.5.3. Channel Strategy
        17.1.10. ZHEJIANG RUNLAB TECHNOLOGY CO., LTD
            17.1.10.1. Overview
            17.1.10.2. Product Portfolio
            17.1.10.3. Profitability by Market Segments
            17.1.10.4. Sales Footprint
            17.1.10.5. Strategy Overview
                17.1.10.5.1. Marketing Strategy
                17.1.10.5.2. Product Strategy
                17.1.10.5.3. Channel Strategy
18. Assumptions & Acronyms Used
19. Research Methodology
Recommendations

Packaging

Sterilization Box Market

August 2023

REP-GB-10202

250 pages

Packaging

Chipboard Box Market

October 2022

REP-GB-4950

250 pages

Explore Packaging Insights

View Reports
Future Market Insights

Microtube Box Market

Schedule a Call