Reports
- Global Locations -
Headquarters
Future Market Insights, Inc.
Christiana Corporate, 200
Continental Drive, Suite 401,
Newark, Delaware - 19713,
United States
Americas
Future Market Insights, Inc.
616 Corporate Way, Suite 2-9018,
Valley Cottage, NY 10989, United States
MEA
Future Market Insights
1602-6 Jumeirah Bay X2 Tower, Plot No: JLT-PH2-X2A,
Jumeirah Lakes Towers, Dubai,
United Arab Emirates
Europe
Future Market Insights
3rd Floor, 207 Regent Street,
W1B 3HH London
United Kingdom
Asia Pacific
Future Market Insights
Office No. 401-A, 4th Floor,
VANTAGE 9, S.No. 36/1/1,
Baner, Pune 411045, India
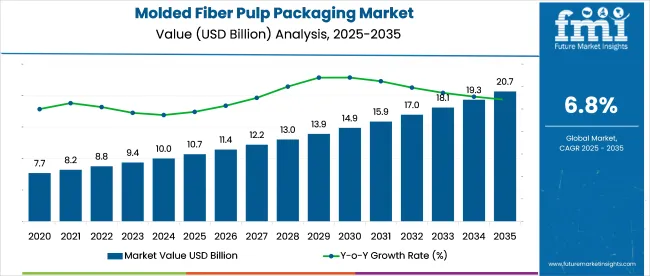
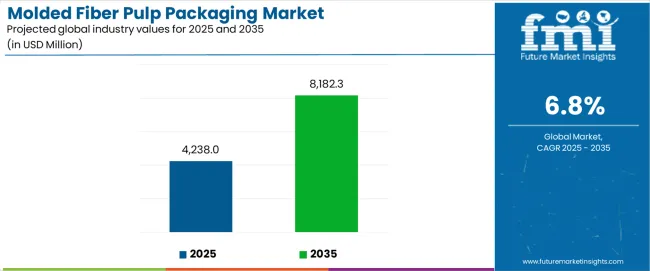
The molded fiber pulp packaging market is expected to be worth US$ 9.0 billion in 2024. In 2023, the market was valued at US$ 8.6 billion. The market is projected to grow at a CAGR of 5.4% from 2024 to 2034. The demand for molded fiber pulp packaging is predicted to reach US$ 15.1 billion by 2034.
Attributes | Details |
---|---|
Molded Fiber Pulp Packaging Market Value for 2024 | US$ 9.0 billion |
Projected Market Value for 2034 | US$ 15.1 billion |
Value-based CAGR for 2024 to 2034 | 5.4% |
Don't pay for what you don't need
Customize your report by selecting specific countries or regions and save 30%!
The molded fiber pulp packaging market size was US$ 7.6 billion in 2019. The market grew at a CAGR of 3.1% from 2019 to 2023.
The rise in sustainability and recyclable trends contributed to the increase in demand for molded fiber pulp packaging during the historical period. However, the pandemic halted proceedings for a number of industries that act as major end users in the market. With industries attaining normalcy post-pandemic, the market was back on the path to recovery. The market reached US$ 8.6 billion by 2023.
Market Value (2019) | US$ 7.6 billion |
---|---|
Historical CAGR (2019 to 2023) | 3.1% |
Historical Market Valuation (2023) | US$ 8.6 billion |
Long-term Analysis of the Molded Fiber Pulp Packaging Market
The molded fiber pulp packaging market is anticipated to be valued at US$ 9.0 billion in 2024. The market is expected to register a CAGR of 5.4% and reach US$ 15.1 billion by 2034.
The focus on sustainability is expected to drive up the market demand over the forecast period. Industrial manufacturers are catching on with the eco-friendly trends, and thus, it is not only consumers who are interested in eco-friendly packaging solutions. Increasing regulations around non-biodegradable materials are also contributing to the growth of the market.
Consumers are also inclined toward packaging solutions that are easy to handle. Thus, the lightweight properties of molded fiber pulp packaging are winning over consumers. The easy-to-handle nature of the material used in the packaging process is also driving product sales for industrial applications. By the end of the forecast period, the market value is estimated to have jumped to.
In addition to the molded fiber pulp packaging market, key attributes of two markets closely related to pulp packaging have been discussed in the section below. These markets are the molded fiber pulp cap market and the pulp molding machine market.
By looking at the markets together, the steady progress of markets related to molded pulp manufacturing can be inferred. Trends and challenges in the path of molded pulp packaging markets are also gleaned.
Molded Fiber Pulp Packaging Market:
Attributes | Molded Fiber Pulp Packaging Market |
---|---|
Value-based CAGR (2024 to 2034) | 5.4% |
Market Trends |
|
Restraint |
|
Growth Factors |
|
Molded Fiber Pulp Cap Market:
Attributes | Molded Fiber Pulp Cap Market |
---|---|
Value-based CAGR (2024 to 2034) | 4.6% |
Market Trend |
|
Restraint |
|
Growth Factor |
|
Pulp Molding Machine Market:
Attributes | Pulp Molding Machine Market |
---|---|
Value-based CAGR (2024 to 2034) | 3.7% |
Market Trend |
|
Restraint |
|
Growth Factor |
|
Get the data you need at a Fraction of the cost
Personalize your report by choosing insights you need
and save 40%!
Attributes | Details |
---|---|
Top Product Type | Trays |
Market Share in 2024 | 32.8% |
Trays are the common type of mold fiber pulp packaging product found in the market. In 2024, trays are expected to account for 32.8% of the market by product type.
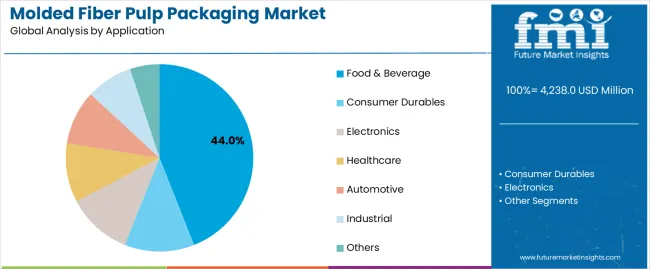
Trays are used in large quantities in the food & beverage industry. As the online delivery and takeaway sectors of the food & beverage industry have grown, trays are being used for storage and transport. With sustainability as a prime concern for many food eaters, trays made from molded fiber pulp are winning the vote of consumers.
Attributes | Details |
---|---|
Top Molded Pulp Type | Transfer Molded |
Market Share in 2024 | 52.8% |
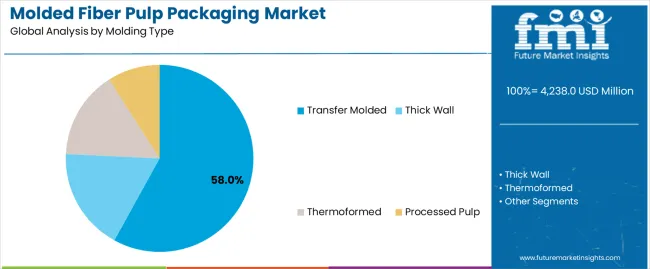
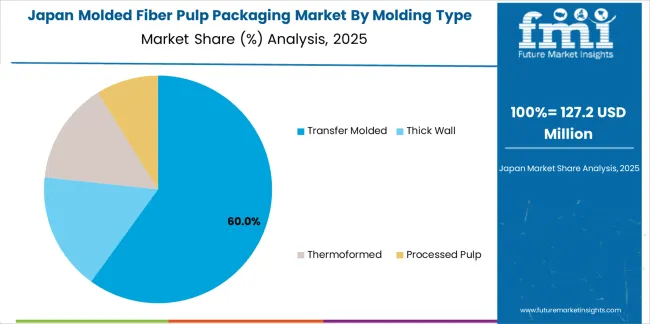
Transfer molded fiber products dominate the market, accounting for a 52.8% market share by molded pulp type.
The transfer molding process provides accuracy and efficiency to manufacturers. The rising use of transfer molded products in various industries is driving the market forward. Thus, transfer molded fiber pulp products are reigning supreme in the market.
The Asia Pacific has enticing growth prospects in the market. The rapid industrialization in the region is leading to a number of industries that use molded fiber pulp packaging to expand significantly. In addition, government initiatives regarding sustainability are helping the adoption of green packing materials like molded fiber pulp into packaging.
Europe is another region where the market is marked with possibilities. Growing sustainability concerns in the region are necessitating the adoption of sustainable packaging solutions from manufacturers. Thus, molded fiber pulp packaging is finding acceptance in Europe.
Countries | CAGR (2024 to 2034) |
---|---|
United Kingdom | 4.5% |
China | 6.8% |
Thailand | 6.6% |
South Korea | 5.9% |
India | 7.7% |
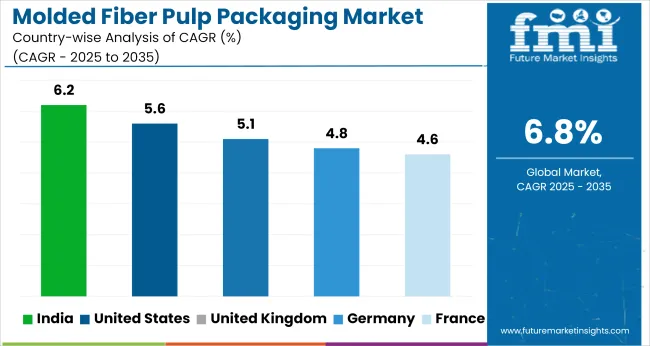
India is one of the most promising countries in the market. The CAGR for the market in India is expected to be 7.7% from 2024 to 2034.
The rapid rising industrialization accompanied by growing sustainability measures in India is expected to drive demand for molded fiber pulp packaging. The government is focused on phasing out the use of single-use plastic. Thus, sustainable packaging material like molded fiber pulp packaging has a positive outlook in India.
In China, the easy availability of raw materials and cheap labor are helping the market to advance rapidly. The vast country has several suppliers of raw materials for fiber packaging. Labor is also cheap and plentiful in China, owing to the large population pool to draw from. Thus, the market has a bright future in the country. The CAGR for the market in China is predicted to be 6.8% over the forecast period.
Thai manufacturers are relying on foreign collaborations to accelerate the demand for molded fiber pulp packaging solutions. Help is being sought from the key players in China and India to introduce new technology into the country for packaging.
For example, in September 2022, it was announced that Fang Thai Factory Ltd. had entered into a partnership with the Indian brand Ecosure Pulpmolding Technologies Ltd. to produce chemical-free fiber pulp. The resultant company is named FTF Candia Fiber Mold Packaging (Thailand) Co. Ltd and offers pulp-based sustainable packaging solutions. The CAGR for the market in Thailand is estimated to be 6.6% over the forecast period.
To contend with the decreasing demand for materials like plastic in packaging, companies in South Korea are introducing molded fiber pulp packaging solutions in the market. The market is expected to register a CAGR of 5.9% in South Korea over the forecast period.
For example, in July 2021, South Korean brand Moorim P&P introduced various products made from pulp molds, such as lunchbox containers and plates.
In the United Kingdom, innovation in technology is a prime concern for market players. The market is expected to register a CAGR of 4.5% through 2034 in the United Kingdom. For example, James Cropper produces molded fiber pulp from wood that is procured from regulated forests or the company’s own recycling plant. For the forecast period.
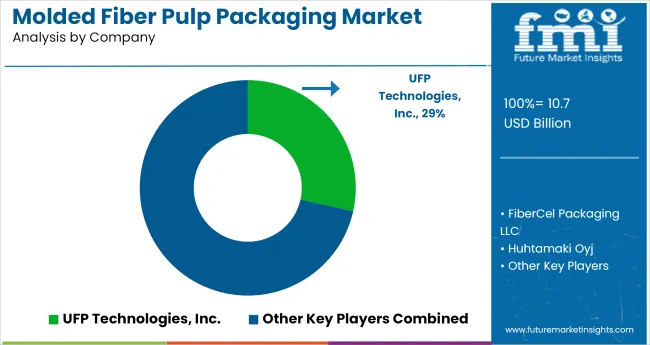
The market is fairly fragmented. There are several small-scale players and new entrants in the market. These players concentrate on the use of recyclable materials for the production of molded fiber packaging.
Companies are focusing on collaborations, especially with foreign players, in the market. By forging partnerships, companies aim to leverage each other’s capabilities and produce innovations. Easier procurement of raw materials and investments in technology are primary concerns among market players.
Recent Developments in the Molded Fiber Pulp Packaging Market
1. Executive Summary 1.1. Global Market Outlook 1.2. Demand-side Trends 1.3. Supply-side Trends 1.4. Technology Roadmap Analysis 1.5. Analysis and Recommendations 2. Market Overview 2.1. Market Coverage / Taxonomy 2.2. Market Definition / Scope / Limitations 3. Market Background 3.1. Market Dynamics 3.1.1. Drivers 3.1.2. Restraints 3.1.3. Opportunity 3.1.4. Trends 3.2. Scenario Forecast 3.2.1. Demand in Optimistic Scenario 3.2.2. Demand in Likely Scenario 3.2.3. Demand in Conservative Scenario 3.3. Opportunity Map Analysis 3.4. Product Life Cycle Analysis 3.5. Supply Chain Analysis 3.5.1. Supply Side Participants and their Roles 3.5.1.1. Producers 3.5.1.2. Mid-Level Participants (Traders/ Agents/ Brokers) 3.5.1.3. Wholesalers and Distributors 3.5.2. Value Added and Value Created at Node in the Supply Chain 3.5.3. List of Raw Material Suppliers 3.5.4. List of Existing and Potential Buyer’s 3.6. Investment Feasibility Matrix 3.7. Value Chain Analysis 3.7.1. Profit Margin Analysis 3.7.2. Wholesalers and Distributors 3.7.3. Retailers 3.8. PESTLE and Porter’s Analysis 3.9. Regulatory Landscape 3.9.1. By Key Regions 3.9.2. By Key Countries 3.10. Regional Parent Market Outlook 3.11. Production and Consumption Statistics 3.12. Import and Export Statistics 4. Global Market Analysis 2019 to 2023 and Forecast, 2024 to 2034 4.1. Historical Market Size Value (US$ Million) & Volume (Tons) Analysis, 2019 to 2023 4.2. Current and Future Market Size Value (US$ Million) & Volume (Tons) Projections, 2024 to 2034 4.2.1. Y-o-Y Growth Trend Analysis 4.2.2. Absolute $ Opportunity Analysis 5. Global Market Analysis 2019 to 2023 and Forecast 2024 to 2034, By Product Type 5.1. Introduction / Key Findings 5.2. Historical Market Size Value (US$ Million) & Volume (Tons) Analysis By Product Type, 2019 to 2023 5.3. Current and Future Market Size Value (US$ Million) & Volume (Tons) Analysis and Forecast By Product Type, 2024 to 2034 5.3.1. Trays 5.3.2. Drink Carriers 5.3.2.1. 2 Cups 5.3.2.2. 4 Cups 5.3.2.3. 6 Cups 5.3.2.4. More than 8 cups 5.3.3. Boxes 5.3.4. End Caps 5.3.5. Plates 5.3.6. Bowls 5.3.7. Cups 5.3.8. Clamshell Containers 5.4. Y-o-Y Growth Trend Analysis By Product Type, 2019 to 2023 5.5. Absolute $ Opportunity Analysis By Product Type, 2024 to 2034 6. Global Market Analysis 2019 to 2023 and Forecast 2024 to 2034, By Molded Pulp Type 6.1. Introduction / Key Findings 6.2. Historical Market Size Value (US$ Million) & Volume (Tons) Analysis By Molded Pulp Type, 2019 to 2023 6.3. Current and Future Market Size Value (US$ Million) & Volume (Tons) Analysis and Forecast By Molded Pulp Type, 2024 to 2034 6.3.1. Thick wall 6.3.2. Transfer Molded 6.3.3. Thermoformed Fiber 6.3.4. Processed Pulp 6.4. Y-o-Y Growth Trend Analysis By Molded Pulp Type, 2019 to 2023 6.5. Absolute $ Opportunity Analysis By Molded Pulp Type, 2024 to 2034 7. Global Market Analysis 2019 to 2023 and Forecast 2024 to 2034, By Application 7.1. Introduction / Key Findings 7.2. Historical Market Size Value (US$ Million) & Volume (Tons) Analysis By Application, 2019 to 2023 7.3. Current and Future Market Size Value (US$ Million) & Volume (Tons) Analysis and Forecast By Application, 2024 to 2034 7.3.1. Primary Packaging 7.3.2. Secondary Packaging 7.3.3. Edge Protectors 7.4. Y-o-Y Growth Trend Analysis By Application, 2019 to 2023 7.5. Absolute $ Opportunity Analysis By Application, 2024 to 2034 8. Global Market Analysis 2019 to 2023 and Forecast 2024 to 2034, By End Use 8.1. Introduction / Key Findings 8.2. Historical Market Size Value (US$ Million) & Volume (Tons) Analysis By End Use, 2019 to 2023 8.3. Current and Future Market Size Value (US$ Million) & Volume (Tons) Analysis and Forecast By End Use, 2024 to 2034 8.3.1. Consumer Durables 8.3.1.1. Mobile Phone 8.3.1.2. Television 8.3.1.3. Laptops 8.3.1.4. Tubelight & Bulbs 8.3.1.5. Other 8.3.2. Food & Beverage 8.3.2.1. Egg Packaging 8.3.2.1.1. 4 Eggs 8.3.2.1.2. 6 Eggs 8.3.2.1.3. 12 Eggs 8.3.2.1.4. 24 Eggs 8.3.2.1.5. More than 30 Eggs 8.3.2.2. Wine Packaging 8.3.2.2.1. 375 ml 8.3.2.2.2. 750 ml 8.3.2.2.3. 1.5 liters 8.3.2.3. Fruit Packaging 8.3.3. Cosmetics 8.3.4. Food Services 8.3.5. Healthcare 8.3.6. Automotive 8.3.7. Logistics 8.3.8. Others 8.4. Y-o-Y Growth Trend Analysis By End Use, 2019 to 2023 8.5. Absolute $ Opportunity Analysis By End Use, 2024 to 2034 9. Global Market Analysis 2019 to 2023 and Forecast 2024 to 2034, By Region 9.1. Introduction 9.2. Historical Market Size Value (US$ Million) & Volume (Tons) Analysis By Region, 2019 to 2023 9.3. Current Market Size Value (US$ Million) & Volume (Tons) Analysis and Forecast By Region, 2024 to 2034 9.3.1. North America 9.3.2. Latin America 9.3.3. Western Europe 9.3.4. Eastern Europe 9.3.5. South Asia and Pacific 9.3.6. East Asia 9.3.7. Middle East and Africa 9.4. Market Attractiveness Analysis By Region 10. North America Market Analysis 2019 to 2023 and Forecast 2024 to 2034, By Country 10.1. Historical Market Size Value (US$ Million) & Volume (Tons) Trend Analysis By Market Taxonomy, 2019 to 2023 10.2. Market Size Value (US$ Million) & Volume (Tons) Forecast By Market Taxonomy, 2024 to 2034 10.2.1. By Country 10.2.1.1. USA 10.2.1.2. Canada 10.2.2. By Product Type 10.2.3. By Molded Pulp Type 10.2.4. By Application 10.2.5. By End Use 10.3. Market Attractiveness Analysis 10.3.1. By Country 10.3.2. By Product Type 10.3.3. By Molded Pulp Type 10.3.4. By Application 10.3.5. By End Use 10.4. Key Takeaways 11. Latin America Market Analysis 2019 to 2023 and Forecast 2024 to 2034, By Country 11.1. Historical Market Size Value (US$ Million) & Volume (Tons) Trend Analysis By Market Taxonomy, 2019 to 2023 11.2. Market Size Value (US$ Million) & Volume (Tons) Forecast By Market Taxonomy, 2024 to 2034 11.2.1. By Country 11.2.1.1. Brazil 11.2.1.2. Mexico 11.2.1.3. Rest of Latin America 11.2.2. By Product Type 11.2.3. By Molded Pulp Type 11.2.4. By Application 11.2.5. By End Use 11.3. Market Attractiveness Analysis 11.3.1. By Country 11.3.2. By Product Type 11.3.3. By Molded Pulp Type 11.3.4. By Application 11.3.5. By End Use 11.4. Key Takeaways 12. Western Europe Market Analysis 2019 to 2023 and Forecast 2024 to 2034, By Country 12.1. Historical Market Size Value (US$ Million) & Volume (Tons) Trend Analysis By Market Taxonomy, 2019 to 2023 12.2. Market Size Value (US$ Million) & Volume (Tons) Forecast By Market Taxonomy, 2024 to 2034 12.2.1. By Country 12.2.1.1. Germany 12.2.1.2. UK 12.2.1.3. France 12.2.1.4. Spain 12.2.1.5. Italy 12.2.1.6. Rest of Western Europe 12.2.2. By Product Type 12.2.3. By Molded Pulp Type 12.2.4. By Application 12.2.5. By End Use 12.3. Market Attractiveness Analysis 12.3.1. By Country 12.3.2. By Product Type 12.3.3. By Molded Pulp Type 12.3.4. By Application 12.3.5. By End Use 12.4. Key Takeaways 13. Eastern Europe Market Analysis 2019 to 2023 and Forecast 2024 to 2034, By Country 13.1. Historical Market Size Value (US$ Million) & Volume (Tons) Trend Analysis By Market Taxonomy, 2019 to 2023 13.2. Market Size Value (US$ Million) & Volume (Tons) Forecast By Market Taxonomy, 2024 to 2034 13.2.1. By Country 13.2.1.1. Poland 13.2.1.2. Russia 13.2.1.3. Czech Republic 13.2.1.4. Romania 13.2.1.5. Rest of Eastern Europe 13.2.2. By Product Type 13.2.3. By Molded Pulp Type 13.2.4. By Application 13.2.5. By End Use 13.3. Market Attractiveness Analysis 13.3.1. By Country 13.3.2. By Product Type 13.3.3. By Molded Pulp Type 13.3.4. By Application 13.3.5. By End Use 13.4. Key Takeaways 14. South Asia and Pacific Market Analysis 2019 to 2023 and Forecast 2024 to 2034, By Country 14.1. Historical Market Size Value (US$ Million) & Volume (Tons) Trend Analysis By Market Taxonomy, 2019 to 2023 14.2. Market Size Value (US$ Million) & Volume (Tons) Forecast By Market Taxonomy, 2024 to 2034 14.2.1. By Country 14.2.1.1. India 14.2.1.2. Bangladesh 14.2.1.3. Australia 14.2.1.4. New Zealand 14.2.1.5. Rest of South Asia and Pacific 14.2.2. By Product Type 14.2.3. By Molded Pulp Type 14.2.4. By Application 14.2.5. By End Use 14.3. Market Attractiveness Analysis 14.3.1. By Country 14.3.2. By Product Type 14.3.3. By Molded Pulp Type 14.3.4. By Application 14.3.5. By End Use 14.4. Key Takeaways 15. East Asia Market Analysis 2019 to 2023 and Forecast 2024 to 2034, By Country 15.1. Historical Market Size Value (US$ Million) & Volume (Tons) Trend Analysis By Market Taxonomy, 2019 to 2023 15.2. Market Size Value (US$ Million) & Volume (Tons) Forecast By Market Taxonomy, 2024 to 2034 15.2.1. By Country 15.2.1.1. China 15.2.1.2. Japan 15.2.1.3. South Korea 15.2.2. By Product Type 15.2.3. By Molded Pulp Type 15.2.4. By Application 15.2.5. By End Use 15.3. Market Attractiveness Analysis 15.3.1. By Country 15.3.2. By Product Type 15.3.3. By Molded Pulp Type 15.3.4. By Application 15.3.5. By End Use 15.4. Key Takeaways 16. Middle East and Africa Market Analysis 2019 to 2023 and Forecast 2024 to 2034, By Country 16.1. Historical Market Size Value (US$ Million) & Volume (Tons) Trend Analysis By Market Taxonomy, 2019 to 2023 16.2. Market Size Value (US$ Million) & Volume (Tons) Forecast By Market Taxonomy, 2024 to 2034 16.2.1. By Country 16.2.1.1. GCC Countries 16.2.1.2. South Africa 16.2.1.3. Israel 16.2.1.4. Rest of MEA 16.2.2. By Product Type 16.2.3. By Molded Pulp Type 16.2.4. By Application 16.2.5. By End Use 16.3. Market Attractiveness Analysis 16.3.1. By Country 16.3.2. By Product Type 16.3.3. By Molded Pulp Type 16.3.4. By Application 16.3.5. By End Use 16.4. Key Takeaways 17. Key Countries Market Analysis 17.1. USA 17.1.1. Pricing Analysis 17.1.2. Market Share Analysis, 2023 17.1.2.1. By Product Type 17.1.2.2. By Molded Pulp Type 17.1.2.3. By Application 17.1.2.4. By End Use 17.2. Canada 17.2.1. Pricing Analysis 17.2.2. Market Share Analysis, 2023 17.2.2.1. By Product Type 17.2.2.2. By Molded Pulp Type 17.2.2.3. By Application 17.2.2.4. By End Use 17.3. Brazil 17.3.1. Pricing Analysis 17.3.2. Market Share Analysis, 2023 17.3.2.1. By Product Type 17.3.2.2. By Molded Pulp Type 17.3.2.3. By Application 17.3.2.4. By End Use 17.4. Mexico 17.4.1. Pricing Analysis 17.4.2. Market Share Analysis, 2023 17.4.2.1. By Product Type 17.4.2.2. By Molded Pulp Type 17.4.2.3. By Application 17.4.2.4. By End Use 17.5. Germany 17.5.1. Pricing Analysis 17.5.2. Market Share Analysis, 2023 17.5.2.1. By Product Type 17.5.2.2. By Molded Pulp Type 17.5.2.3. By Application 17.5.2.4. By End Use 17.6. UK 17.6.1. Pricing Analysis 17.6.2. Market Share Analysis, 2023 17.6.2.1. By Product Type 17.6.2.2. By Molded Pulp Type 17.6.2.3. By Application 17.6.2.4. By End Use 17.7. France 17.7.1. Pricing Analysis 17.7.2. Market Share Analysis, 2023 17.7.2.1. By Product Type 17.7.2.2. By Molded Pulp Type 17.7.2.3. By Application 17.7.2.4. By End Use 17.8. Spain 17.8.1. Pricing Analysis 17.8.2. Market Share Analysis, 2023 17.8.2.1. By Product Type 17.8.2.2. By Molded Pulp Type 17.8.2.3. By Application 17.8.2.4. By End Use 17.9. Italy 17.9.1. Pricing Analysis 17.9.2. Market Share Analysis, 2023 17.9.2.1. By Product Type 17.9.2.2. By Molded Pulp Type 17.9.2.3. By Application 17.9.2.4. By End Use 17.10. Poland 17.10.1. Pricing Analysis 17.10.2. Market Share Analysis, 2023 17.10.2.1. By Product Type 17.10.2.2. By Molded Pulp Type 17.10.2.3. By Application 17.10.2.4. By End Use 17.11. Russia 17.11.1. Pricing Analysis 17.11.2. Market Share Analysis, 2023 17.11.2.1. By Product Type 17.11.2.2. By Molded Pulp Type 17.11.2.3. By Application 17.11.2.4. By End Use 17.12. Czech Republic 17.12.1. Pricing Analysis 17.12.2. Market Share Analysis, 2023 17.12.2.1. By Product Type 17.12.2.2. By Molded Pulp Type 17.12.2.3. By Application 17.12.2.4. By End Use 17.13. Romania 17.13.1. Pricing Analysis 17.13.2. Market Share Analysis, 2023 17.13.2.1. By Product Type 17.13.2.2. By Molded Pulp Type 17.13.2.3. By Application 17.13.2.4. By End Use 17.14. India 17.14.1. Pricing Analysis 17.14.2. Market Share Analysis, 2023 17.14.2.1. By Product Type 17.14.2.2. By Molded Pulp Type 17.14.2.3. By Application 17.14.2.4. By End Use 17.15. Bangladesh 17.15.1. Pricing Analysis 17.15.2. Market Share Analysis, 2023 17.15.2.1. By Product Type 17.15.2.2. By Molded Pulp Type 17.15.2.3. By Application 17.15.2.4. By End Use 17.16. Australia 17.16.1. Pricing Analysis 17.16.2. Market Share Analysis, 2023 17.16.2.1. By Product Type 17.16.2.2. By Molded Pulp Type 17.16.2.3. By Application 17.16.2.4. By End Use 17.17. New Zealand 17.17.1. Pricing Analysis 17.17.2. Market Share Analysis, 2023 17.17.2.1. By Product Type 17.17.2.2. By Molded Pulp Type 17.17.2.3. By Application 17.17.2.4. By End Use 17.18. China 17.18.1. Pricing Analysis 17.18.2. Market Share Analysis, 2023 17.18.2.1. By Product Type 17.18.2.2. By Molded Pulp Type 17.18.2.3. By Application 17.18.2.4. By End Use 17.19. Japan 17.19.1. Pricing Analysis 17.19.2. Market Share Analysis, 2023 17.19.2.1. By Product Type 17.19.2.2. By Molded Pulp Type 17.19.2.3. By Application 17.19.2.4. By End Use 17.20. South Korea 17.20.1. Pricing Analysis 17.20.2. Market Share Analysis, 2023 17.20.2.1. By Product Type 17.20.2.2. By Molded Pulp Type 17.20.2.3. By Application 17.20.2.4. By End Use 17.21. GCC Countries 17.21.1. Pricing Analysis 17.21.2. Market Share Analysis, 2023 17.21.2.1. By Product Type 17.21.2.2. By Molded Pulp Type 17.21.2.3. By Application 17.21.2.4. By End Use 17.22. South Africa 17.22.1. Pricing Analysis 17.22.2. Market Share Analysis, 2023 17.22.2.1. By Product Type 17.22.2.2. By Molded Pulp Type 17.22.2.3. By Application 17.22.2.4. By End Use 17.23. Israel 17.23.1. Pricing Analysis 17.23.2. Market Share Analysis, 2023 17.23.2.1. By Product Type 17.23.2.2. By Molded Pulp Type 17.23.2.3. By Application 17.23.2.4. By End Use 18. Market Structure Analysis 18.1. Competition Dashboard 18.2. Competition Benchmarking 18.3. Market Share Analysis of Top Players 18.3.1. By Regional 18.3.2. By Product Type 18.3.3. By Molded Pulp Type 18.3.4. By Application 18.3.5. By End Use 19. Competition Analysis 19.1. Competition Deep Dive 19.1.1. UFP Technologies, Inc. 19.1.1.1. Overview 19.1.1.2. Product Portfolio 19.1.1.3. Profitability by Market Segments 19.1.1.4. Sales Footprint 19.1.1.5. Strategy Overview 19.1.1.5.1. Marketing Strategy 19.1.1.5.2. Product Strategy 19.1.1.5.3. Channel Strategy 19.1.2. FiberCel Packaging LLC 19.1.2.1. Overview 19.1.2.2. Product Portfolio 19.1.2.3. Profitability by Market Segments 19.1.2.4. Sales Footprint 19.1.2.5. Strategy Overview 19.1.2.5.1. Marketing Strategy 19.1.2.5.2. Product Strategy 19.1.2.5.3. Channel Strategy 19.1.3. Huhtamaki Oyj 19.1.3.1. Overview 19.1.3.2. Product Portfolio 19.1.3.3. Profitability by Market Segments 19.1.3.4. Sales Footprint 19.1.3.5. Strategy Overview 19.1.3.5.1. Marketing Strategy 19.1.3.5.2. Product Strategy 19.1.3.5.3. Channel Strategy 19.1.4. Pactiv LLC 19.1.4.1. Overview 19.1.4.2. Product Portfolio 19.1.4.3. Profitability by Market Segments 19.1.4.4. Sales Footprint 19.1.4.5. Strategy Overview 19.1.4.5.1. Marketing Strategy 19.1.4.5.2. Product Strategy 19.1.4.5.3. Channel Strategy 19.1.5. Henry Molded Products, Inc 19.1.5.1. Overview 19.1.5.2. Product Portfolio 19.1.5.3. Profitability by Market Segments 19.1.5.4. Sales Footprint 19.1.5.5. Strategy Overview 19.1.5.5.1. Marketing Strategy 19.1.5.5.2. Product Strategy 19.1.5.5.3. Channel Strategy 19.1.6. EnviroPAK Corporation 19.1.6.1. Overview 19.1.6.2. Product Portfolio 19.1.6.3. Profitability by Market Segments 19.1.6.4. Sales Footprint 19.1.6.5. Strategy Overview 19.1.6.5.1. Marketing Strategy 19.1.6.5.2. Product Strategy 19.1.6.5.3. Channel Strategy 19.1.7. Spectrum Lithograph Inc. 19.1.7.1. Overview 19.1.7.2. Product Portfolio 19.1.7.3. Profitability by Market Segments 19.1.7.4. Sales Footprint 19.1.7.5. Strategy Overview 19.1.7.5.1. Marketing Strategy 19.1.7.5.2. Product Strategy 19.1.7.5.3. Channel Strategy 19.1.8. ESCO Technologies Inc. 19.1.8.1. Overview 19.1.8.2. Product Portfolio 19.1.8.3. Profitability by Market Segments 19.1.8.4. Sales Footprint 19.1.8.5. Strategy Overview 19.1.8.5.1. Marketing Strategy 19.1.8.5.2. Product Strategy 19.1.8.5.3. Channel Strategy 19.1.9. ProtoPak Engineering Corporation 19.1.9.1. Overview 19.1.9.2. Product Portfolio 19.1.9.3. Profitability by Market Segments 19.1.9.4. Sales Footprint 19.1.9.5. Strategy Overview 19.1.9.5.1. Marketing Strategy 19.1.9.5.2. Product Strategy 19.1.9.5.3. Channel Strategy 19.1.10. Brodrene Hartmann A/S 19.1.10.1. Overview 19.1.10.2. Product Portfolio 19.1.10.3. Profitability by Market Segments 19.1.10.4. Sales Footprint 19.1.10.5. Strategy Overview 19.1.10.5.1. Marketing Strategy 19.1.10.5.2. Product Strategy 19.1.10.5.3. Channel Strategy 19.1.11. OrCon Industries Corporation 19.1.11.1. Overview 19.1.11.2. Product Portfolio 19.1.11.3. Profitability by Market Segments 19.1.11.4. Sales Footprint 19.1.11.5. Strategy Overview 19.1.11.5.1. Marketing Strategy 19.1.11.5.2. Product Strategy 19.1.11.5.3. Channel Strategy 19.1.12. Keiding, Inc. 19.1.12.1. Overview 19.1.12.2. Product Portfolio 19.1.12.3. Profitability by Market Segments 19.1.12.4. Sales Footprint 19.1.12.5. Strategy Overview 19.1.12.5.1. Marketing Strategy 19.1.12.5.2. Product Strategy 19.1.12.5.3. Channel Strategy 19.1.13. Pacific Pulp Molding, LLC 19.1.13.1. Overview 19.1.13.2. Product Portfolio 19.1.13.3. Profitability by Market Segments 19.1.13.4. Sales Footprint 19.1.13.5. Strategy Overview 19.1.13.5.1. Marketing Strategy 19.1.13.5.2. Product Strategy 19.1.13.5.3. Channel Strategy 19.1.14. Guangxi Qiaowang Pulp Packing Products Co, Ltd. 19.1.14.1. Overview 19.1.14.2. Product Portfolio 19.1.14.3. Profitability by Market Segments 19.1.14.4. Sales Footprint 19.1.14.5. Strategy Overview 19.1.14.5.1. Marketing Strategy 19.1.14.5.2. Product Strategy 19.1.14.5.3. Channel Strategy 19.1.15. Celluloses De La Loire 19.1.15.1. Overview 19.1.15.2. Product Portfolio 19.1.15.3. Profitability by Market Segments 19.1.15.4. Sales Footprint 19.1.15.5. Strategy Overview 19.1.15.5.1. Marketing Strategy 19.1.15.5.2. Product Strategy 19.1.15.5.3. Channel Strategy 19.1.16. Dynamic Fibre Moulding (PTY) Ltd. 19.1.16.1. Overview 19.1.16.2. Product Portfolio 19.1.16.3. Profitability by Market Segments 19.1.16.4. Sales Footprint 19.1.16.5. Strategy Overview 19.1.16.5.1. Marketing Strategy 19.1.16.5.2. Product Strategy 19.1.16.5.3. Channel Strategy 19.1.17. Primapack SAE 19.1.17.1. Overview 19.1.17.2. Product Portfolio 19.1.17.3. Profitability by Market Segments 19.1.17.4. Sales Footprint 19.1.17.5. Strategy Overview 19.1.17.5.1. Marketing Strategy 19.1.17.5.2. Product Strategy 19.1.17.5.3. Channel Strategy 20. Assumptions & Acronyms Used 21. Research Methodology
Don't pay for what you don't need
Customize your report by selecting specific countries or regions and save 30%!
Table 1: Global Market Value (US$ Million) Forecast by Region, 2019 to 2034 Table 2: Global Market Volume (Tons) Forecast by Region, 2019 to 2034 Table 3: Global Market Value (US$ Million) Forecast by Product Type, 2019 to 2034 Table 4: Global Market Volume (Tons) Forecast by Product Type, 2019 to 2034 Table 5: Global Market Value (US$ Million) Forecast by Molded Pulp Type, 2019 to 2034 Table 6: Global Market Volume (Tons) Forecast by Molded Pulp Type, 2019 to 2034 Table 7: Global Market Value (US$ Million) Forecast by Application, 2019 to 2034 Table 8: Global Market Volume (Tons) Forecast by Application, 2019 to 2034 Table 9: Global Market Value (US$ Million) Forecast by End Use, 2019 to 2034 Table 10: Global Market Volume (Tons) Forecast by End Use, 2019 to 2034 Table 11: North America Market Value (US$ Million) Forecast by Country, 2019 to 2034 Table 12: North America Market Volume (Tons) Forecast by Country, 2019 to 2034 Table 13: North America Market Value (US$ Million) Forecast by Product Type, 2019 to 2034 Table 14: North America Market Volume (Tons) Forecast by Product Type, 2019 to 2034 Table 15: North America Market Value (US$ Million) Forecast by Molded Pulp Type, 2019 to 2034 Table 16: North America Market Volume (Tons) Forecast by Molded Pulp Type, 2019 to 2034 Table 17: North America Market Value (US$ Million) Forecast by Application, 2019 to 2034 Table 18: North America Market Volume (Tons) Forecast by Application, 2019 to 2034 Table 19: North America Market Value (US$ Million) Forecast by End Use, 2019 to 2034 Table 20: North America Market Volume (Tons) Forecast by End Use, 2019 to 2034 Table 21: Latin America Market Value (US$ Million) Forecast by Country, 2019 to 2034 Table 22: Latin America Market Volume (Tons) Forecast by Country, 2019 to 2034 Table 23: Latin America Market Value (US$ Million) Forecast by Product Type, 2019 to 2034 Table 24: Latin America Market Volume (Tons) Forecast by Product Type, 2019 to 2034 Table 25: Latin America Market Value (US$ Million) Forecast by Molded Pulp Type, 2019 to 2034 Table 26: Latin America Market Volume (Tons) Forecast by Molded Pulp Type, 2019 to 2034 Table 27: Latin America Market Value (US$ Million) Forecast by Application, 2019 to 2034 Table 28: Latin America Market Volume (Tons) Forecast by Application, 2019 to 2034 Table 29: Latin America Market Value (US$ Million) Forecast by End Use, 2019 to 2034 Table 30: Latin America Market Volume (Tons) Forecast by End Use, 2019 to 2034 Table 31: Western Europe Market Value (US$ Million) Forecast by Country, 2019 to 2034 Table 32: Western Europe Market Volume (Tons) Forecast by Country, 2019 to 2034 Table 33: Western Europe Market Value (US$ Million) Forecast by Product Type, 2019 to 2034 Table 34: Western Europe Market Volume (Tons) Forecast by Product Type, 2019 to 2034 Table 35: Western Europe Market Value (US$ Million) Forecast by Molded Pulp Type, 2019 to 2034 Table 36: Western Europe Market Volume (Tons) Forecast by Molded Pulp Type, 2019 to 2034 Table 37: Western Europe Market Value (US$ Million) Forecast by Application, 2019 to 2034 Table 38: Western Europe Market Volume (Tons) Forecast by Application, 2019 to 2034 Table 39: Western Europe Market Value (US$ Million) Forecast by End Use, 2019 to 2034 Table 40: Western Europe Market Volume (Tons) Forecast by End Use, 2019 to 2034 Table 41: Eastern Europe Market Value (US$ Million) Forecast by Country, 2019 to 2034 Table 42: Eastern Europe Market Volume (Tons) Forecast by Country, 2019 to 2034 Table 43: Eastern Europe Market Value (US$ Million) Forecast by Product Type, 2019 to 2034 Table 44: Eastern Europe Market Volume (Tons) Forecast by Product Type, 2019 to 2034 Table 45: Eastern Europe Market Value (US$ Million) Forecast by Molded Pulp Type, 2019 to 2034 Table 46: Eastern Europe Market Volume (Tons) Forecast by Molded Pulp Type, 2019 to 2034 Table 47: Eastern Europe Market Value (US$ Million) Forecast by Application, 2019 to 2034 Table 48: Eastern Europe Market Volume (Tons) Forecast by Application, 2019 to 2034 Table 49: Eastern Europe Market Value (US$ Million) Forecast by End Use, 2019 to 2034 Table 50: Eastern Europe Market Volume (Tons) Forecast by End Use, 2019 to 2034 Table 51: South Asia and Pacific Market Value (US$ Million) Forecast by Country, 2019 to 2034 Table 52: South Asia and Pacific Market Volume (Tons) Forecast by Country, 2019 to 2034 Table 53: South Asia and Pacific Market Value (US$ Million) Forecast by Product Type, 2019 to 2034 Table 54: South Asia and Pacific Market Volume (Tons) Forecast by Product Type, 2019 to 2034 Table 55: South Asia and Pacific Market Value (US$ Million) Forecast by Molded Pulp Type, 2019 to 2034 Table 56: South Asia and Pacific Market Volume (Tons) Forecast by Molded Pulp Type, 2019 to 2034 Table 57: South Asia and Pacific Market Value (US$ Million) Forecast by Application, 2019 to 2034 Table 58: South Asia and Pacific Market Volume (Tons) Forecast by Application, 2019 to 2034 Table 59: South Asia and Pacific Market Value (US$ Million) Forecast by End Use, 2019 to 2034 Table 60: South Asia and Pacific Market Volume (Tons) Forecast by End Use, 2019 to 2034 Table 61: East Asia Market Value (US$ Million) Forecast by Country, 2019 to 2034 Table 62: East Asia Market Volume (Tons) Forecast by Country, 2019 to 2034 Table 63: East Asia Market Value (US$ Million) Forecast by Product Type, 2019 to 2034 Table 64: East Asia Market Volume (Tons) Forecast by Product Type, 2019 to 2034 Table 65: East Asia Market Value (US$ Million) Forecast by Molded Pulp Type, 2019 to 2034 Table 66: East Asia Market Volume (Tons) Forecast by Molded Pulp Type, 2019 to 2034 Table 67: East Asia Market Value (US$ Million) Forecast by Application, 2019 to 2034 Table 68: East Asia Market Volume (Tons) Forecast by Application, 2019 to 2034 Table 69: East Asia Market Value (US$ Million) Forecast by End Use, 2019 to 2034 Table 70: East Asia Market Volume (Tons) Forecast by End Use, 2019 to 2034 Table 71: Middle East and Africa Market Value (US$ Million) Forecast by Country, 2019 to 2034 Table 72: Middle East and Africa Market Volume (Tons) Forecast by Country, 2019 to 2034 Table 73: Middle East and Africa Market Value (US$ Million) Forecast by Product Type, 2019 to 2034 Table 74: Middle East and Africa Market Volume (Tons) Forecast by Product Type, 2019 to 2034 Table 75: Middle East and Africa Market Value (US$ Million) Forecast by Molded Pulp Type, 2019 to 2034 Table 76: Middle East and Africa Market Volume (Tons) Forecast by Molded Pulp Type, 2019 to 2034 Table 77: Middle East and Africa Market Value (US$ Million) Forecast by Application, 2019 to 2034 Table 78: Middle East and Africa Market Volume (Tons) Forecast by Application, 2019 to 2034 Table 79: Middle East and Africa Market Value (US$ Million) Forecast by End Use, 2019 to 2034 Table 80: Middle East and Africa Market Volume (Tons) Forecast by End Use, 2019 to 2034
Figure 1: Global Market Value (US$ Million) by Product Type, 2024 to 2034 Figure 2: Global Market Value (US$ Million) by Molded Pulp Type, 2024 to 2034 Figure 3: Global Market Value (US$ Million) by Application, 2024 to 2034 Figure 4: Global Market Value (US$ Million) by End Use, 2024 to 2034 Figure 5: Global Market Value (US$ Million) by Region, 2024 to 2034 Figure 6: Global Market Value (US$ Million) Analysis by Region, 2019 to 2034 Figure 7: Global Market Volume (Tons) Analysis by Region, 2019 to 2034 Figure 8: Global Market Value Share (%) and BPS Analysis by Region, 2024 to 2034 Figure 9: Global Market Y-o-Y Growth (%) Projections by Region, 2024 to 2034 Figure 10: Global Market Value (US$ Million) Analysis by Product Type, 2019 to 2034 Figure 11: Global Market Volume (Tons) Analysis by Product Type, 2019 to 2034 Figure 12: Global Market Value Share (%) and BPS Analysis by Product Type, 2024 to 2034 Figure 13: Global Market Y-o-Y Growth (%) Projections by Product Type, 2024 to 2034 Figure 14: Global Market Value (US$ Million) Analysis by Molded Pulp Type, 2019 to 2034 Figure 15: Global Market Volume (Tons) Analysis by Molded Pulp Type, 2019 to 2034 Figure 16: Global Market Value Share (%) and BPS Analysis by Molded Pulp Type, 2024 to 2034 Figure 17: Global Market Y-o-Y Growth (%) Projections by Molded Pulp Type, 2024 to 2034 Figure 18: Global Market Value (US$ Million) Analysis by Application, 2019 to 2034 Figure 19: Global Market Volume (Tons) Analysis by Application, 2019 to 2034 Figure 20: Global Market Value Share (%) and BPS Analysis by Application, 2024 to 2034 Figure 21: Global Market Y-o-Y Growth (%) Projections by Application, 2024 to 2034 Figure 22: Global Market Value (US$ Million) Analysis by End Use, 2019 to 2034 Figure 23: Global Market Volume (Tons) Analysis by End Use, 2019 to 2034 Figure 24: Global Market Value Share (%) and BPS Analysis by End Use, 2024 to 2034 Figure 25: Global Market Y-o-Y Growth (%) Projections by End Use, 2024 to 2034 Figure 26: Global Market Attractiveness by Product Type, 2024 to 2034 Figure 27: Global Market Attractiveness by Molded Pulp Type, 2024 to 2034 Figure 28: Global Market Attractiveness by Application, 2024 to 2034 Figure 29: Global Market Attractiveness by End Use, 2024 to 2034 Figure 30: Global Market Attractiveness by Region, 2024 to 2034 Figure 31: North America Market Value (US$ Million) by Product Type, 2024 to 2034 Figure 32: North America Market Value (US$ Million) by Molded Pulp Type, 2024 to 2034 Figure 33: North America Market Value (US$ Million) by Application, 2024 to 2034 Figure 34: North America Market Value (US$ Million) by End Use, 2024 to 2034 Figure 35: North America Market Value (US$ Million) by Country, 2024 to 2034 Figure 36: North America Market Value (US$ Million) Analysis by Country, 2019 to 2034 Figure 37: North America Market Volume (Tons) Analysis by Country, 2019 to 2034 Figure 38: North America Market Value Share (%) and BPS Analysis by Country, 2024 to 2034 Figure 39: North America Market Y-o-Y Growth (%) Projections by Country, 2024 to 2034 Figure 40: North America Market Value (US$ Million) Analysis by Product Type, 2019 to 2034 Figure 41: North America Market Volume (Tons) Analysis by Product Type, 2019 to 2034 Figure 42: North America Market Value Share (%) and BPS Analysis by Product Type, 2024 to 2034 Figure 43: North America Market Y-o-Y Growth (%) Projections by Product Type, 2024 to 2034 Figure 44: North America Market Value (US$ Million) Analysis by Molded Pulp Type, 2019 to 2034 Figure 45: North America Market Volume (Tons) Analysis by Molded Pulp Type, 2019 to 2034 Figure 46: North America Market Value Share (%) and BPS Analysis by Molded Pulp Type, 2024 to 2034 Figure 47: North America Market Y-o-Y Growth (%) Projections by Molded Pulp Type, 2024 to 2034 Figure 48: North America Market Value (US$ Million) Analysis by Application, 2019 to 2034 Figure 49: North America Market Volume (Tons) Analysis by Application, 2019 to 2034 Figure 50: North America Market Value Share (%) and BPS Analysis by Application, 2024 to 2034 Figure 51: North America Market Y-o-Y Growth (%) Projections by Application, 2024 to 2034 Figure 52: North America Market Value (US$ Million) Analysis by End Use, 2019 to 2034 Figure 53: North America Market Volume (Tons) Analysis by End Use, 2019 to 2034 Figure 54: North America Market Value Share (%) and BPS Analysis by End Use, 2024 to 2034 Figure 55: North America Market Y-o-Y Growth (%) Projections by End Use, 2024 to 2034 Figure 56: North America Market Attractiveness by Product Type, 2024 to 2034 Figure 57: North America Market Attractiveness by Molded Pulp Type, 2024 to 2034 Figure 58: North America Market Attractiveness by Application, 2024 to 2034 Figure 59: North America Market Attractiveness by End Use, 2024 to 2034 Figure 60: North America Market Attractiveness by Country, 2024 to 2034 Figure 61: Latin America Market Value (US$ Million) by Product Type, 2024 to 2034 Figure 62: Latin America Market Value (US$ Million) by Molded Pulp Type, 2024 to 2034 Figure 63: Latin America Market Value (US$ Million) by Application, 2024 to 2034 Figure 64: Latin America Market Value (US$ Million) by End Use, 2024 to 2034 Figure 65: Latin America Market Value (US$ Million) by Country, 2024 to 2034 Figure 66: Latin America Market Value (US$ Million) Analysis by Country, 2019 to 2034 Figure 67: Latin America Market Volume (Tons) Analysis by Country, 2019 to 2034 Figure 68: Latin America Market Value Share (%) and BPS Analysis by Country, 2024 to 2034 Figure 69: Latin America Market Y-o-Y Growth (%) Projections by Country, 2024 to 2034 Figure 70: Latin America Market Value (US$ Million) Analysis by Product Type, 2019 to 2034 Figure 71: Latin America Market Volume (Tons) Analysis by Product Type, 2019 to 2034 Figure 72: Latin America Market Value Share (%) and BPS Analysis by Product Type, 2024 to 2034 Figure 73: Latin America Market Y-o-Y Growth (%) Projections by Product Type, 2024 to 2034 Figure 74: Latin America Market Value (US$ Million) Analysis by Molded Pulp Type, 2019 to 2034 Figure 75: Latin America Market Volume (Tons) Analysis by Molded Pulp Type, 2019 to 2034 Figure 76: Latin America Market Value Share (%) and BPS Analysis by Molded Pulp Type, 2024 to 2034 Figure 77: Latin America Market Y-o-Y Growth (%) Projections by Molded Pulp Type, 2024 to 2034 Figure 78: Latin America Market Value (US$ Million) Analysis by Application, 2019 to 2034 Figure 79: Latin America Market Volume (Tons) Analysis by Application, 2019 to 2034 Figure 80: Latin America Market Value Share (%) and BPS Analysis by Application, 2024 to 2034 Figure 81: Latin America Market Y-o-Y Growth (%) Projections by Application, 2024 to 2034 Figure 82: Latin America Market Value (US$ Million) Analysis by End Use, 2019 to 2034 Figure 83: Latin America Market Volume (Tons) Analysis by End Use, 2019 to 2034 Figure 84: Latin America Market Value Share (%) and BPS Analysis by End Use, 2024 to 2034 Figure 85: Latin America Market Y-o-Y Growth (%) Projections by End Use, 2024 to 2034 Figure 86: Latin America Market Attractiveness by Product Type, 2024 to 2034 Figure 87: Latin America Market Attractiveness by Molded Pulp Type, 2024 to 2034 Figure 88: Latin America Market Attractiveness by Application, 2024 to 2034 Figure 89: Latin America Market Attractiveness by End Use, 2024 to 2034 Figure 90: Latin America Market Attractiveness by Country, 2024 to 2034 Figure 91: Western Europe Market Value (US$ Million) by Product Type, 2024 to 2034 Figure 92: Western Europe Market Value (US$ Million) by Molded Pulp Type, 2024 to 2034 Figure 93: Western Europe Market Value (US$ Million) by Application, 2024 to 2034 Figure 94: Western Europe Market Value (US$ Million) by End Use, 2024 to 2034 Figure 95: Western Europe Market Value (US$ Million) by Country, 2024 to 2034 Figure 96: Western Europe Market Value (US$ Million) Analysis by Country, 2019 to 2034 Figure 97: Western Europe Market Volume (Tons) Analysis by Country, 2019 to 2034 Figure 98: Western Europe Market Value Share (%) and BPS Analysis by Country, 2024 to 2034 Figure 99: Western Europe Market Y-o-Y Growth (%) Projections by Country, 2024 to 2034 Figure 100: Western Europe Market Value (US$ Million) Analysis by Product Type, 2019 to 2034 Figure 101: Western Europe Market Volume (Tons) Analysis by Product Type, 2019 to 2034 Figure 102: Western Europe Market Value Share (%) and BPS Analysis by Product Type, 2024 to 2034 Figure 103: Western Europe Market Y-o-Y Growth (%) Projections by Product Type, 2024 to 2034 Figure 104: Western Europe Market Value (US$ Million) Analysis by Molded Pulp Type, 2019 to 2034 Figure 105: Western Europe Market Volume (Tons) Analysis by Molded Pulp Type, 2019 to 2034 Figure 106: Western Europe Market Value Share (%) and BPS Analysis by Molded Pulp Type, 2024 to 2034 Figure 107: Western Europe Market Y-o-Y Growth (%) Projections by Molded Pulp Type, 2024 to 2034 Figure 108: Western Europe Market Value (US$ Million) Analysis by Application, 2019 to 2034 Figure 109: Western Europe Market Volume (Tons) Analysis by Application, 2019 to 2034 Figure 110: Western Europe Market Value Share (%) and BPS Analysis by Application, 2024 to 2034 Figure 111: Western Europe Market Y-o-Y Growth (%) Projections by Application, 2024 to 2034 Figure 112: Western Europe Market Value (US$ Million) Analysis by End Use, 2019 to 2034 Figure 113: Western Europe Market Volume (Tons) Analysis by End Use, 2019 to 2034 Figure 114: Western Europe Market Value Share (%) and BPS Analysis by End Use, 2024 to 2034 Figure 115: Western Europe Market Y-o-Y Growth (%) Projections by End Use, 2024 to 2034 Figure 116: Western Europe Market Attractiveness by Product Type, 2024 to 2034 Figure 117: Western Europe Market Attractiveness by Molded Pulp Type, 2024 to 2034 Figure 118: Western Europe Market Attractiveness by Application, 2024 to 2034 Figure 119: Western Europe Market Attractiveness by End Use, 2024 to 2034 Figure 120: Western Europe Market Attractiveness by Country, 2024 to 2034 Figure 121: Eastern Europe Market Value (US$ Million) by Product Type, 2024 to 2034 Figure 122: Eastern Europe Market Value (US$ Million) by Molded Pulp Type, 2024 to 2034 Figure 123: Eastern Europe Market Value (US$ Million) by Application, 2024 to 2034 Figure 124: Eastern Europe Market Value (US$ Million) by End Use, 2024 to 2034 Figure 125: Eastern Europe Market Value (US$ Million) by Country, 2024 to 2034 Figure 126: Eastern Europe Market Value (US$ Million) Analysis by Country, 2019 to 2034 Figure 127: Eastern Europe Market Volume (Tons) Analysis by Country, 2019 to 2034 Figure 128: Eastern Europe Market Value Share (%) and BPS Analysis by Country, 2024 to 2034 Figure 129: Eastern Europe Market Y-o-Y Growth (%) Projections by Country, 2024 to 2034 Figure 130: Eastern Europe Market Value (US$ Million) Analysis by Product Type, 2019 to 2034 Figure 131: Eastern Europe Market Volume (Tons) Analysis by Product Type, 2019 to 2034 Figure 132: Eastern Europe Market Value Share (%) and BPS Analysis by Product Type, 2024 to 2034 Figure 133: Eastern Europe Market Y-o-Y Growth (%) Projections by Product Type, 2024 to 2034 Figure 134: Eastern Europe Market Value (US$ Million) Analysis by Molded Pulp Type, 2019 to 2034 Figure 135: Eastern Europe Market Volume (Tons) Analysis by Molded Pulp Type, 2019 to 2034 Figure 136: Eastern Europe Market Value Share (%) and BPS Analysis by Molded Pulp Type, 2024 to 2034 Figure 137: Eastern Europe Market Y-o-Y Growth (%) Projections by Molded Pulp Type, 2024 to 2034 Figure 138: Eastern Europe Market Value (US$ Million) Analysis by Application, 2019 to 2034 Figure 139: Eastern Europe Market Volume (Tons) Analysis by Application, 2019 to 2034 Figure 140: Eastern Europe Market Value Share (%) and BPS Analysis by Application, 2024 to 2034 Figure 141: Eastern Europe Market Y-o-Y Growth (%) Projections by Application, 2024 to 2034 Figure 142: Eastern Europe Market Value (US$ Million) Analysis by End Use, 2019 to 2034 Figure 143: Eastern Europe Market Volume (Tons) Analysis by End Use, 2019 to 2034 Figure 144: Eastern Europe Market Value Share (%) and BPS Analysis by End Use, 2024 to 2034 Figure 145: Eastern Europe Market Y-o-Y Growth (%) Projections by End Use, 2024 to 2034 Figure 146: Eastern Europe Market Attractiveness by Product Type, 2024 to 2034 Figure 147: Eastern Europe Market Attractiveness by Molded Pulp Type, 2024 to 2034 Figure 148: Eastern Europe Market Attractiveness by Application, 2024 to 2034 Figure 149: Eastern Europe Market Attractiveness by End Use, 2024 to 2034 Figure 150: Eastern Europe Market Attractiveness by Country, 2024 to 2034 Figure 151: South Asia and Pacific Market Value (US$ Million) by Product Type, 2024 to 2034 Figure 152: South Asia and Pacific Market Value (US$ Million) by Molded Pulp Type, 2024 to 2034 Figure 153: South Asia and Pacific Market Value (US$ Million) by Application, 2024 to 2034 Figure 154: South Asia and Pacific Market Value (US$ Million) by End Use, 2024 to 2034 Figure 155: South Asia and Pacific Market Value (US$ Million) by Country, 2024 to 2034 Figure 156: South Asia and Pacific Market Value (US$ Million) Analysis by Country, 2019 to 2034 Figure 157: South Asia and Pacific Market Volume (Tons) Analysis by Country, 2019 to 2034 Figure 158: South Asia and Pacific Market Value Share (%) and BPS Analysis by Country, 2024 to 2034 Figure 159: South Asia and Pacific Market Y-o-Y Growth (%) Projections by Country, 2024 to 2034 Figure 160: South Asia and Pacific Market Value (US$ Million) Analysis by Product Type, 2019 to 2034 Figure 161: South Asia and Pacific Market Volume (Tons) Analysis by Product Type, 2019 to 2034 Figure 162: South Asia and Pacific Market Value Share (%) and BPS Analysis by Product Type, 2024 to 2034 Figure 163: South Asia and Pacific Market Y-o-Y Growth (%) Projections by Product Type, 2024 to 2034 Figure 164: South Asia and Pacific Market Value (US$ Million) Analysis by Molded Pulp Type, 2019 to 2034 Figure 165: South Asia and Pacific Market Volume (Tons) Analysis by Molded Pulp Type, 2019 to 2034 Figure 166: South Asia and Pacific Market Value Share (%) and BPS Analysis by Molded Pulp Type, 2024 to 2034 Figure 167: South Asia and Pacific Market Y-o-Y Growth (%) Projections by Molded Pulp Type, 2024 to 2034 Figure 168: South Asia and Pacific Market Value (US$ Million) Analysis by Application, 2019 to 2034 Figure 169: South Asia and Pacific Market Volume (Tons) Analysis by Application, 2019 to 2034 Figure 170: South Asia and Pacific Market Value Share (%) and BPS Analysis by Application, 2024 to 2034 Figure 171: South Asia and Pacific Market Y-o-Y Growth (%) Projections by Application, 2024 to 2034 Figure 172: South Asia and Pacific Market Value (US$ Million) Analysis by End Use, 2019 to 2034 Figure 173: South Asia and Pacific Market Volume (Tons) Analysis by End Use, 2019 to 2034 Figure 174: South Asia and Pacific Market Value Share (%) and BPS Analysis by End Use, 2024 to 2034 Figure 175: South Asia and Pacific Market Y-o-Y Growth (%) Projections by End Use, 2024 to 2034 Figure 176: South Asia and Pacific Market Attractiveness by Product Type, 2024 to 2034 Figure 177: South Asia and Pacific Market Attractiveness by Molded Pulp Type, 2024 to 2034 Figure 178: South Asia and Pacific Market Attractiveness by Application, 2024 to 2034 Figure 179: South Asia and Pacific Market Attractiveness by End Use, 2024 to 2034 Figure 180: South Asia and Pacific Market Attractiveness by Country, 2024 to 2034 Figure 181: East Asia Market Value (US$ Million) by Product Type, 2024 to 2034 Figure 182: East Asia Market Value (US$ Million) by Molded Pulp Type, 2024 to 2034 Figure 183: East Asia Market Value (US$ Million) by Application, 2024 to 2034 Figure 184: East Asia Market Value (US$ Million) by End Use, 2024 to 2034 Figure 185: East Asia Market Value (US$ Million) by Country, 2024 to 2034 Figure 186: East Asia Market Value (US$ Million) Analysis by Country, 2019 to 2034 Figure 187: East Asia Market Volume (Tons) Analysis by Country, 2019 to 2034 Figure 188: East Asia Market Value Share (%) and BPS Analysis by Country, 2024 to 2034 Figure 189: East Asia Market Y-o-Y Growth (%) Projections by Country, 2024 to 2034 Figure 190: East Asia Market Value (US$ Million) Analysis by Product Type, 2019 to 2034 Figure 191: East Asia Market Volume (Tons) Analysis by Product Type, 2019 to 2034 Figure 192: East Asia Market Value Share (%) and BPS Analysis by Product Type, 2024 to 2034 Figure 193: East Asia Market Y-o-Y Growth (%) Projections by Product Type, 2024 to 2034 Figure 194: East Asia Market Value (US$ Million) Analysis by Molded Pulp Type, 2019 to 2034 Figure 195: East Asia Market Volume (Tons) Analysis by Molded Pulp Type, 2019 to 2034 Figure 196: East Asia Market Value Share (%) and BPS Analysis by Molded Pulp Type, 2024 to 2034 Figure 197: East Asia Market Y-o-Y Growth (%) Projections by Molded Pulp Type, 2024 to 2034 Figure 198: East Asia Market Value (US$ Million) Analysis by Application, 2019 to 2034 Figure 199: East Asia Market Volume (Tons) Analysis by Application, 2019 to 2034 Figure 200: East Asia Market Value Share (%) and BPS Analysis by Application, 2024 to 2034 Figure 201: East Asia Market Y-o-Y Growth (%) Projections by Application, 2024 to 2034 Figure 202: East Asia Market Value (US$ Million) Analysis by End Use, 2019 to 2034 Figure 203: East Asia Market Volume (Tons) Analysis by End Use, 2019 to 2034 Figure 204: East Asia Market Value Share (%) and BPS Analysis by End Use, 2024 to 2034 Figure 205: East Asia Market Y-o-Y Growth (%) Projections by End Use, 2024 to 2034 Figure 206: East Asia Market Attractiveness by Product Type, 2024 to 2034 Figure 207: East Asia Market Attractiveness by Molded Pulp Type, 2024 to 2034 Figure 208: East Asia Market Attractiveness by Application, 2024 to 2034 Figure 209: East Asia Market Attractiveness by End Use, 2024 to 2034 Figure 210: East Asia Market Attractiveness by Country, 2024 to 2034 Figure 211: Middle East and Africa Market Value (US$ Million) by Product Type, 2024 to 2034 Figure 212: Middle East and Africa Market Value (US$ Million) by Molded Pulp Type, 2024 to 2034 Figure 213: Middle East and Africa Market Value (US$ Million) by Application, 2024 to 2034 Figure 214: Middle East and Africa Market Value (US$ Million) by End Use, 2024 to 2034 Figure 215: Middle East and Africa Market Value (US$ Million) by Country, 2024 to 2034 Figure 216: Middle East and Africa Market Value (US$ Million) Analysis by Country, 2019 to 2034 Figure 217: Middle East and Africa Market Volume (Tons) Analysis by Country, 2019 to 2034 Figure 218: Middle East and Africa Market Value Share (%) and BPS Analysis by Country, 2024 to 2034 Figure 219: Middle East and Africa Market Y-o-Y Growth (%) Projections by Country, 2024 to 2034 Figure 220: Middle East and Africa Market Value (US$ Million) Analysis by Product Type, 2019 to 2034 Figure 221: Middle East and Africa Market Volume (Tons) Analysis by Product Type, 2019 to 2034 Figure 222: Middle East and Africa Market Value Share (%) and BPS Analysis by Product Type, 2024 to 2034 Figure 223: Middle East and Africa Market Y-o-Y Growth (%) Projections by Product Type, 2024 to 2034 Figure 224: Middle East and Africa Market Value (US$ Million) Analysis by Molded Pulp Type, 2019 to 2034 Figure 225: Middle East and Africa Market Volume (Tons) Analysis by Molded Pulp Type, 2019 to 2034 Figure 226: Middle East and Africa Market Value Share (%) and BPS Analysis by Molded Pulp Type, 2024 to 2034 Figure 227: Middle East and Africa Market Y-o-Y Growth (%) Projections by Molded Pulp Type, 2024 to 2034 Figure 228: Middle East and Africa Market Value (US$ Million) Analysis by Application, 2019 to 2034 Figure 229: Middle East and Africa Market Volume (Tons) Analysis by Application, 2019 to 2034 Figure 230: Middle East and Africa Market Value Share (%) and BPS Analysis by Application, 2024 to 2034 Figure 231: Middle East and Africa Market Y-o-Y Growth (%) Projections by Application, 2024 to 2034 Figure 232: Middle East and Africa Market Value (US$ Million) Analysis by End Use, 2019 to 2034 Figure 233: Middle East and Africa Market Volume (Tons) Analysis by End Use, 2019 to 2034 Figure 234: Middle East and Africa Market Value Share (%) and BPS Analysis by End Use, 2024 to 2034 Figure 235: Middle East and Africa Market Y-o-Y Growth (%) Projections by End Use, 2024 to 2034 Figure 236: Middle East and Africa Market Attractiveness by Product Type, 2024 to 2034 Figure 237: Middle East and Africa Market Attractiveness by Molded Pulp Type, 2024 to 2034 Figure 238: Middle East and Africa Market Attractiveness by Application, 2024 to 2034 Figure 239: Middle East and Africa Market Attractiveness by End Use, 2024 to 2034 Figure 240: Middle East and Africa Market Attractiveness by Country, 2024 to 2034
Recommendations
Explore Packaging Insights
View Reports