Niacinamide Formulations Market Size and Share Forecast Outlook 2025 to 2035

The Niacinamide Formulations Market has been projected to be valued at approximately USD 2,251.3 million in 2025, with expansion anticipated to reach USD 7,305.6 million by 2035. This progression indicates an addition of over USD 5,000 million in revenues during the assessment decade, reflecting a compound annual growth rate of 12.5%. The pace of growth highlights how niacinamide has shifted from a niche active ingredient to a mainstream driver of skincare portfolios worldwide.
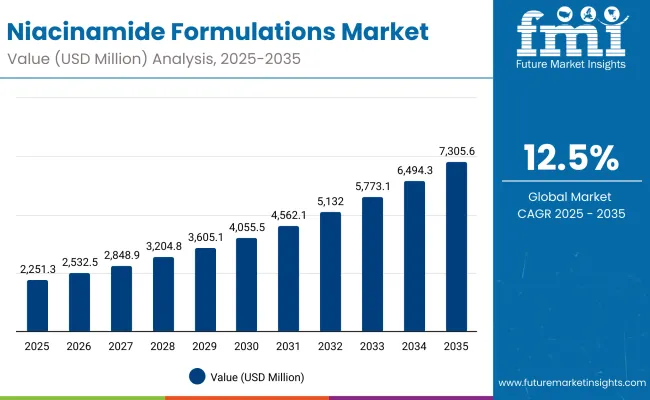
Quick Stats for Niacinamide Formulations Market

  • Niacinamide Formulations Market Value (2025): USD 2,251.3 Million
  • Niacinamide Formulations Market Forecast Value (2035): USD 7,305.6 Million
  • Niacinamide Formulations Market Forecast CAGR: 12.5%
  • Leading Segment in Niacinamide Formulations Market in 2025: Brightening (56.6%)
  • Key Growth Regions in the Niacinamide Formulations Market: Asia-Pacific, North America, Europe
  • Top Key Players in Niacinamide Formulations Market: The Ordinary (Deciem/Estée Lauder), Paula’s Choice, Olay (P&G), La Roche-Posay (L’Oréal), CeraVe (Unilever), Clinique (Estée Lauder), Murad, Kiehl’s, Bioderma

Niacinamide Formulations Market

Niacinamide Formulations Market Key Takeaways

Metric Value
Market Estimated Value in (2025E) USD 2,251.3 Million
Market Forecast Value in (2035F) USD 7,305.6 Million
Forecast CAGR (2025 to 2035) 12.50%

Between 2025 and 2030, revenues are expected to climb from USD 2,251.3 million to USD 4,055.5 million, contributing nearly 36% of the overall decade’s expansion. This early phase of growth will likely be reinforced by sustained adoption in brightening formulations, which are estimated to hold a 56.6% share in 2025, alongside the rising prominence of serums, accounting for 54.5% of product demand. During this period, dermatologist-tested claims are projected to consolidate consumer trust, capturing just over half of the global market.

The subsequent period from 2030 to 2035 is forecast to deliver even stronger gains, as the market rises from USD 4,055.5 million to USD 7,305.6 million, accounting for nearly two-fifths of the decade’s value increase. The acceleration is expected to be propelled by advanced multifunctional claims, deeper e-commerce penetration, and broader adoption across Asia-Pacific, where China and India are poised for double-digit growth rates. Competitive intensity will continue to shape the market, though opportunities will remain significant for brands capable of aligning science-backed innovation with consumer trust.

From 2020 to 2024, the Niacinamide Formulations Market advanced steadily, supported by growing demand for multifunctional skincare. During this period, competition was influenced by affordability and transparency, where The Ordinary built early dominance in niacinamide serums. Premium brands focused on clinical validation, while emerging clean-label players gained visibility through digital-first marketing.

Demand is expected to reach USD 2,251.3 Million in 2025, with revenue contributions shifting toward brightening formulations, serums, and dermatologist-tested claims. Established multinational brands are projected to face stronger competition from agile entrants offering digital personalization, subscription-based models, and hybrid positioning of skincare and cosmetic benefits. Competitive advantage is anticipated to move beyond product pricing toward ecosystem strength, clinical trust, and consumer engagement across digital platforms.

Why the Niacinamide Formulations Market is growing?

The growth of the Niacinamide Formulations Market is being driven by rising consumer awareness of multifunctional skincare solutions that address brightening, barrier repair, and anti-aging needs simultaneously. Increased demand for dermatologist-tested and science-backed products has reinforced consumer trust, encouraging broader adoption across both premium and mass-market segments. Expanding e-commerce penetration has created new avenues for distribution, enabling brands to reach wider audiences with targeted marketing and subscription-based models.

Strong growth momentum is also being observed in Asia-Pacific, where expanding middle-class populations in China and India are showing heightened interest in advanced skincare formulations. The appeal of serums as delivery formats is strengthening market dominance, supported by their effectiveness in providing concentrated benefits. Clean-label, vegan, and natural claims are being positioned as differentiators, driving premiumization trends across global markets. Continuous investment in innovation and diversification is expected to sustain growth, with increasing relevance across emerging channels and digitally influenced purchasing behavior.

Segmental Analysis

Brightening is expected to hold 56.6% of the Niacinamide Formulations Market in 2025, valued at USD 1,272.7 million, while other functions capture 43.4% with USD 977.8 million. This dominance reflects the rising consumer preference for skin tone correction, glow enhancement, and overall complexion uniformity. Brightening benefits have been positioned as essential across global markets, especially in Asia-Pacific, where fairness and radiance claims drive purchasing decisions. Other functions such as oil control and barrier support remain important but are projected to grow at a slower pace. The focus on multifunctional benefits is anticipated to further strengthen brightening’s leadership, with innovations that combine radiance with anti-aging and hydration, thereby expanding the long-term role of this function.
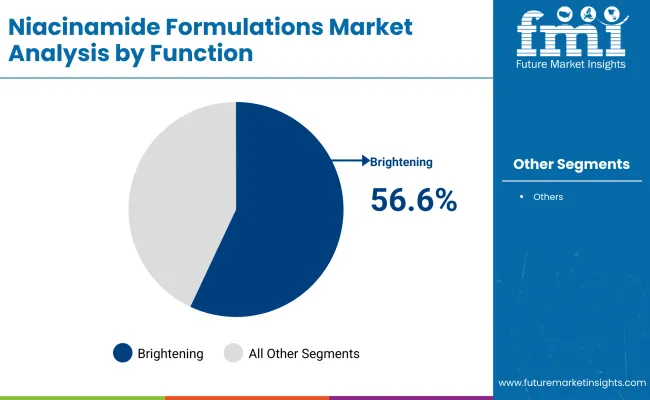
Insights into the Function Segment with Brightening Leading in Market Share

Niacinamide Formulations Market By Function

Segment Market Value Share, 2025
Brightening 56.6%
Others 43.4%

Brightening is expected to hold 56.6% of the Niacinamide Formulations Market in 2025, valued at USD 1,272.7 million, while other functions capture 43.4% with USD 977.8 million. This dominance reflects the rising consumer preference for skin tone correction, glow enhancement, and overall complexion uniformity. Brightening benefits have been positioned as essential across global markets, especially in Asia-Pacific, where fairness and radiance claims drive purchasing decisions. Other functions such as oil control and barrier support remain important but are projected to grow at a slower pace. The focus on multifunctional benefits is anticipated to further strengthen brightening’s leadership, with innovations that combine radiance with anti-aging and hydration, thereby expanding the long-term role of this function.
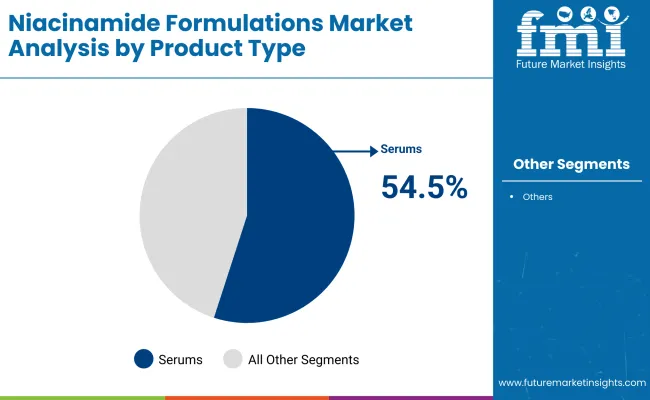
Insights into the Product Type Segment with Serums Driving Growth

Niacinamide Formulations Market By Product

Segment Market Value Share, 2025
Serums 54.5%
Others 45.5%

Serums are projected to command 54.5% of the market in 2025, generating USD 1,227.3 million, while other product types are expected to contribute 45.5%, equivalent to USD 1,023.3 million. The leadership of serums can be attributed to their high concentration of active niacinamide, rapid absorption, and alignment with multi-step skincare routines. These features have positioned serums as highly effective and trusted by consumers seeking targeted benefits. Other categories, including creams, lotions, and toners, continue to demonstrate solid demand, but their adoption is more price-sensitive and regionalized. As innovation in formulations accelerates, serums are forecast to retain dominance, supported by premiumization, personalized skincare trends, and rising penetration in e-commerce-driven channels across developed and emerging markets.
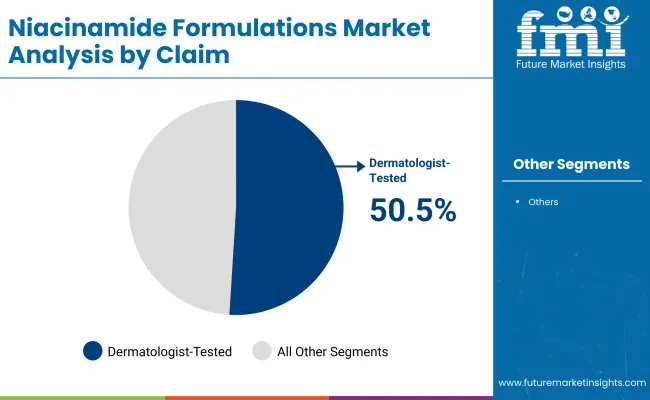
Insights into the Technology Segment with Focus on Laser Triangulation

Niacinamide Formulations Market By Claim

Segment Market Value Share, 2025
Dermatologist-tested 50.5%
Others 49.5%

Dermatologist-tested claims are set to hold 50.5% of global revenues in 2025, valued at USD 1,136.4 million, while other claims collectively represent 49.5% with USD 1,114.3 million. This slight edge demonstrates how scientific validation has become central to consumer trust in niacinamide formulations. Dermatologist-backed positioning enhances product credibility, addressing concerns about sensitivity, efficacy, and safety. While natural, vegan, and clean-label claims are gaining importance, their fragmented adoption has limited immediate dominance.

Nevertheless, these alternative claims are expected to evolve into strong differentiators over the forecast horizon. Dermatologist-tested formulations are anticipated to sustain leadership due to consumer reliance on evidence-based skincare, clinical testing transparency, and regulatory alignment, which collectively strengthen their competitive position in the market.

What are the Drivers, Restraints, and Key Trends of the Niacinamide Formulations Market?

The Niacinamide Formulations Market is being shaped by evolving consumer behaviors and technological integration in skincare. While adoption barriers remain, sustained growth is influenced by scientifically validated benefits, digital retail platforms, and evolving beauty standards across diverse demographics and geographies.

Clinical Validation as a Market Catalyst

Growth in the Niacinamide Formulations Market is being reinforced by increasing emphasis on clinical validation and dermatologist-backed endorsements. Consumers are progressively guided by evidence-based purchasing, where product credibility is determined by the extent of scientific testing and transparent claims. This driver is expected to elevate formulations positioned as safe, effective, and suitable for sensitive skin. Companies investing in independent trials and publishing results through credible dermatological associations are being rewarded with higher brand loyalty and premium pricing leverage. Over the forecast period, this dynamic is projected to transform niacinamide into a benchmark ingredient synonymous with clinically validated skincare solutions.

Digitalization of Skincare Journeys

A key trend shaping the Niacinamide Formulations Market is the digitalization of consumer skincare journeys. With the rapid rise of AI-driven skin analysis tools, personalized product recommendations are being delivered through mobile applications and e-commerce platforms. Niacinamide-based formulations are increasingly promoted through algorithms that align consumer profiles with targeted benefits such as brightening or barrier strengthening. Influencer collaborations and virtual try-on experiences are further embedding digital ecosystems into purchase decisions. This shift is expected to deepen consumer engagement, reduce trial-and-error cycles, and accelerate adoption across online channels. By 2035, digital ecosystems will likely serve as critical growth multipliers for the category.
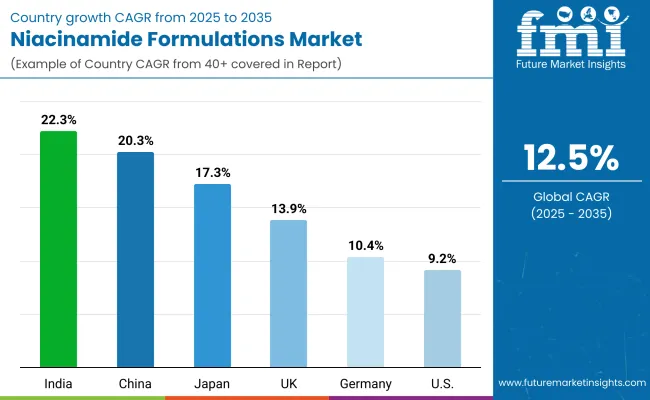
Analysis of Niacinamide Formulations Market By Key Countries

Niacinamide Formulations Market By Country

Countries CAGR
China 20.3%
USA 9.2%
India 22.3%
UK 13.9%
Germany 10.4%
Japan 17.3%

The Niacinamide Formulations Market is projected to display marked differences across geographies, shaped by evolving consumer preferences, income dynamics, and the maturity of skincare industries. India is expected to lead the global landscape with a CAGR of 22.3% during 2025-2035, reflecting the rapid expansion of middle-class purchasing power, the growing influence of digital retail, and the rising acceptance of premium skincare. China follows closely with an anticipated CAGR of 20.3%, supported by an advanced e-commerce ecosystem and strong consumer affinity for brightening formulations. Japan is projected to grow at 17.3%, where clinical trust and innovation in product claims are expected to sustain adoption.

In Europe, steady progress is forecast, with the UK advancing at 13.9% and Germany at 10.4%. These countries are expected to benefit from consumer emphasis on dermatologically validated products and premium-positioned serums. The USA, with a CAGR of 9.2%, demonstrates a more mature trajectory, where stable demand is being reinforced by strong brand presence and dermatologist-backed recommendations.

This regional outlook underscores how emerging Asian markets are expected to act as the engines of global growth, while Europe and North America maintain relevance through innovation, product diversification, and sustained consumer trust in niacinamide-based skincare.
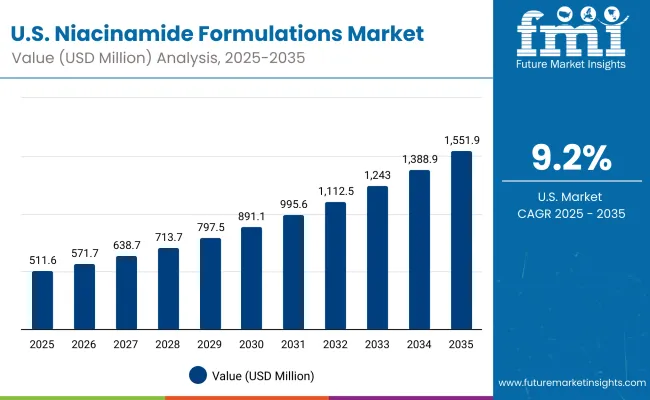
Sales Outlook for Niacinamide Formulations in the United States

Niacinamide Formulations Market Usa

Year USA Niacinamide Formulations Market (USD Million)
2025 511.66
2026 571.70
2027 638.79
2028 713.75
2029 797.51
2030 891.10
2031 995.67
2032 1,112.52
2033 1,243.07
2034 1,388.95
2035 1,551.94

The Niacinamide Formulations Market in the United States is projected to grow at a CAGR of 11.6% between 2025 and 2035, increasing from USD 511.7 million to USD 1,551.9 million. Expansion is expected to be driven by dermatologist-validated formulations, premium-positioned serums, and consumer confidence in multifunctional skincare benefits. Brightening functions are anticipated to account for the largest share, reinforced by high awareness of radiance-focused solutions.

The role of e-commerce platforms is forecast to expand significantly, offering greater reach, targeted promotions, and subscription-driven engagement models. Dermatologist-tested claims are expected to provide credibility, strengthening consumer loyalty and enabling brands to command premium pricing. While mature, the USA market continues to provide significant opportunities for innovation, particularly in barrier-support formulations and clean-label product lines.

  • CAGR of 11.6% reflects steady but reliable expansion within a mature skincare environment.
  • Brightening benefits are projected to sustain functional leadership across the decade.
  • Digital retail ecosystems and clinical validation will shape brand competitiveness.

Growth And Expansion Outlook For Niacinamide Formulations Market in the United Kingdom

The Niacinamide Formulations Market in the United Kingdom is projected to expand at a CAGR of 13.9% from 2025 to 2035, supported by strong consumer awareness and premium skincare adoption. Market expansion is expected to be reinforced by clinical validation, demand for serums, and an active e-commerce ecosystem. Brightening benefits are anticipated to dominate, while dermatologist-tested claims continue to build trust. Premiumization is expected to be a key driver, with brands leveraging innovation in textures and natural positioning to attract younger demographics.

  • CAGR of 13.9% underscores balanced growth across premium and mass skincare.
  • Dermatologist-tested claims are expected to shape purchasing decisions.
  • Serums are projected to maintain leadership in product formats.
  • E-commerce growth will enhance consumer engagement and cross-border access.

Growth and Expansion Outlook for Niacinamide Formulations Market in India

The Niacinamide Formulations Market in India is forecast to register the highest CAGR globally at 22.3% between 2025 and 2035, expanding rapidly through rising middle-class purchasing power and digital penetration. Growth is expected to be anchored by young, urban consumers embracing dermatologist-validated skincare and clean-label products. Serums are projected to be particularly dominant, driven by their perception as effective, affordable, and aspirational solutions. Retail innovation, digital-first launches, and regional influencer campaigns are anticipated to accelerate awareness and drive mass adoption.

  • CAGR of 22.3% positions India as the fastest-growing global market.
  • Serums are expected to dominate as the preferred delivery format.
  • Dermatologist-backed positioning will strengthen consumer trust.
  • Digital-first retail strategies will unlock mass adoption and brand loyalty.

Sales Outlook for Niacinamide Formulations in China

The Niacinamide Formulations Market in China is expected to grow at a CAGR of 20.3% between 2025 and 2035, reflecting strong consumer focus on brightening claims and digital-first purchasing behavior. Rapid adoption is being driven by an advanced e-commerce infrastructure, high brand competition, and the strong cultural relevance of skin radiance. Serums are forecast to hold the majority share, supported by heavy innovation and marketing campaigns. Strategic positioning around dermatologist-tested and multifunctional claims is projected to enhance brand equity, particularly among young professionals and urban women.
  • CAGR of 20.3% highlights China as a key global growth engine.
  • Brightening formulations are projected to dominate consumer demand.
  • Serums will maintain leadership due to efficacy and innovation.
  • E-commerce ecosystems will reinforce brand visibility and access.

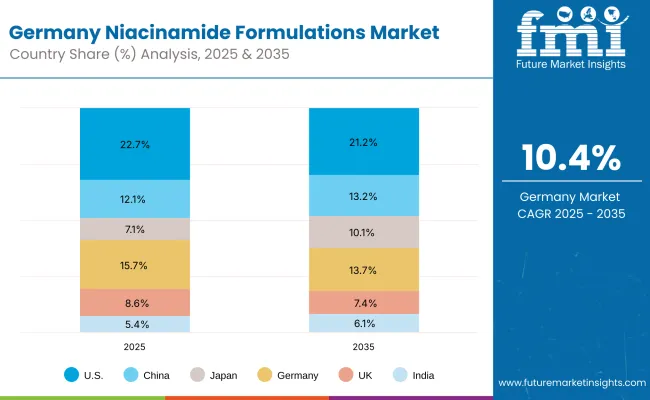
In-depth Analysis of Niacinamide Formulations in Germany

Niacinamide Formulations Market Germany

Countries 2025
USA 22.7%
China 12.1%
Japan 7.1%
Germany 15.7%
UK 8.6%
India 5.4%
Countries 2035
USA 21.2%
China 13.2%
Japan 10.1%
Germany 13.7%
UK 7.4%
India 6.1%

The Niacinamide Formulations Market in Germany is projected to expand at a CAGR of 10.4% from 2025 to 2035, supported by high trust in dermatologically validated skincare. The market is anticipated to benefit from regulatory rigor, which reinforces transparency and builds consumer confidence. Brightening and anti-aging applications are expected to lead adoption, with dermatologist-tested claims playing a pivotal role in purchasing decisions. Growth is also forecast to be driven by premium serums marketed through both pharmacies and digital channels.
  • CAGR of 10.4% reflects steady expansion in a mature European market.
  • Regulatory transparency will reinforce consumer confidence in products.
  • Brightening and anti-aging functions are expected to dominate demand.
  • Pharmacies and digital platforms will remain key retail channels.

Growth Outlook for Niacinamide Formulations Market in USA

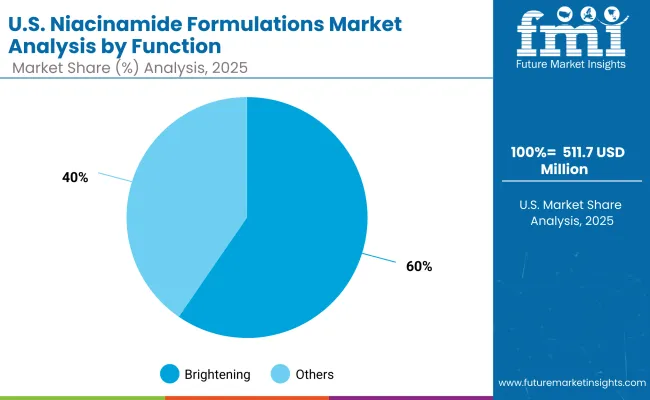
Niacinamide Formulations Market Usa 2

Segment Market Value Share, 2025
Brightening 59.6%
Others 40.4%

The Niacinamide Formulations Market in the United States is projected at USD 511.7 million in 2025. Brightening contributes 59.6% (USD 304.8 million), while other functions account for 40.4% (USD 206.9 million), reflecting a clear dominance of radiance-focused applications. This leadership stems from the high consumer demand for complexion-enhancing products, where efficacy is supported by dermatologist validation and clinical testing.

Brightening functions are being reinforced by cultural preferences for even-toned, luminous skin and their strong positioning in marketing narratives. Other functions, including anti-aging and skin barrier support, are expected to remain critical but secondary, as they are often bundled within multifunctional claims. Over the forecast horizon, increasing innovation in brightening formulations combined with digital retail strategies is projected to cement their leadership within the USA market.
  • Brightening dominates with 59.6% share, valued at USD 304.8 million in 2025.
  • Other functions retain 40.4% share, valued at USD 206.9 million.
  • Dermatologist-tested brightening claims are expected to sustain premium pricing.
  • Multifunctional formulations will continue to integrate brightening with anti-aging and barrier repair.

Opportunity Analysis of China Niacinamide Formulations Market

Niacinamide Formulations Market China

Segment Market Value Share, 2025
Serums 56.9%
Others 43.1%

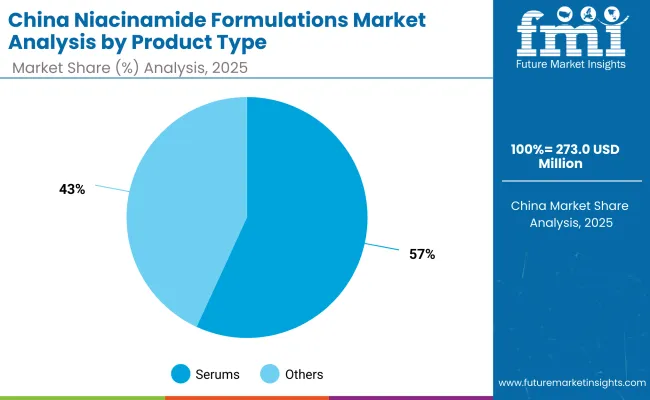
The Niacinamide Formulations Market in China is projected at USD 273.0 million in 2025. Serums contribute 56.9% (USD 155.2 million), while other product types account for 43.1% (USD 117.8 million), highlighting the growing consumer preference for high-efficacy formats. This leadership is being driven by the perception of serums as premium and result-oriented, making them highly relevant in China’s skincare routines. Rapid adoption is being reinforced by digital retail platforms, where serums are marketed as aspirational and science-backed solutions for brightening and overall skin health.

Other product categories such as creams, toners, and masks retain substantial traction but remain secondary due to their broader positioning and lower concentration levels. Over the forecast horizon, the dominance of serums is expected to be sustained through continuous innovation, premium packaging, and influencer-driven campaigns that resonate strongly with urban, tech-savvy consumers.

Key Insights
  • Serums lead with 56.9% share, valued at USD 155.2 million in 2025.
  • Other formats hold 43.1% share, valued at USD 117.8 million.
  • Digital platforms are central to serum adoption, driving consumer engagement.
  • Premiumization and multifunctional claims will reinforce serum dominance.

Competitive Landscape of Niacinamide Formulations Market

Niacinamide Formulations Market By Company

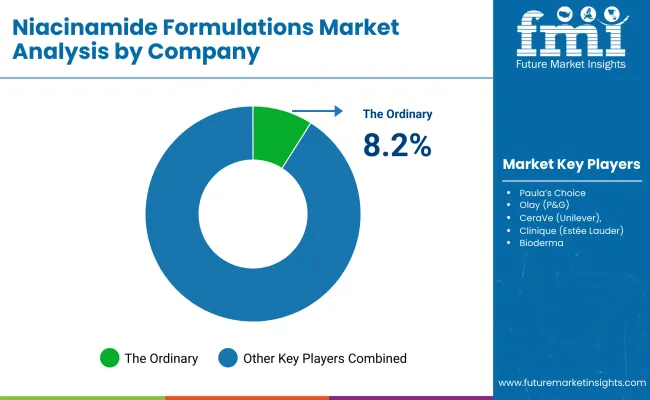
The Niacinamide Formulations Market is moderately fragmented, with global leaders, mid-sized innovators, and specialized skincare brands competing across diverse regions. The Ordinary, operated by Deciem (an Estée Lauder-owned company), is recognized as the most dominant global player, holding 8.2% of the market share in 2025. Its strong positioning is being supported by affordability, transparency in formulations, and early adoption of niacinamide serums as core offerings. In 2024, The Ordinary was estimated to hold a comparable share, cementing its influence as a benchmark brand in this category.

Alongside The Ordinary, other established multinationals such as Estée Lauder, L’Oréal, Procter & Gamble (Olay), Unilever (CeraVe), and Johnson & Johnson (Neutrogena) are highly relevant competitors in this market. These companies integrate niacinamide formulations across multiple brands, benefiting from diversified portfolios and extensive distribution networks. Their strategies emphasize clinical validation, dermatologist endorsements, and premium product lines that expand trust across global consumer bases.

Mid-sized innovators, including Paula’s Choice and La Roche-Posay, are building strong reputations by combining science-backed claims with digital-first marketing approaches. Competitive differentiation is shifting from product pricing alone toward dermatologist-tested positioning, clean-label innovation, and omnichannel presence. As adoption deepens, leading players are expected to compete more aggressively through product diversification, transparency, and digital retail strategies.

Key Developments in Niacinamide Formulations Market

  • Glow Recipe’s debut tinted serum blush, “Watermelon Glow Niacinamide Dewy Flush,” was released in February 2025. Infused with 3% niacinamide and jojoba-coated pigments, it was clinically tested to plump, brighten, and even skin tone, marking a novel fusion of skincare-active and cosmetic pigment.
  • In August 2025, Biossance unveiled its Squalane + Niacinamide Eye Serum, targeting puffiness and dark circles. Positioned as clean, barrier-supportive skincare, the eye serum integrated niacinamide’s soothing benefits with nourishing squalane to strengthen the delicate under-eye area

Scope of the Report

Item Value
Market Size 2025 USD 2,251.3 Million
Market Size 2035 USD 7,305.6 Million
CAGR (2025-2035) 12.50%
Function Brightening 56.6% (USD 1,272.7 Million), Others 43.4% (USD 977.8 Million)
Product Type Serums 54.5% (USD 1,227.3 Million), Others 45.5% (USD 1,023.3 Million)
Claim Dermatologist-tested 50.5% (USD 1,136.4 Million), Others 49.5% (USD 1,114.3 Million)
Key Countries CAGR India 22.3%, China 20.3%, Japan 17.3%, UK 13.9%, Germany 10.4%, USA 9.2%
Regions Covered North America, Europe, Asia-Pacific, Latin America, Middle East & Africa
Countries Covered United States, Canada, Germany, France, United Kingdom, China, Japan, India, Brazil, South Africa
Key Companies Profiled The Ordinary (Deciem/Estée Lauder), Paula’s Choice, Olay (P&G), La Roche-Posay (L’Oréal), CeraVe (Unilever), Clinique (Estée Lauder), Estée Lauder, Murad, Kiehl’s, Bioderma
Competitive Landscape The Ordinary 8.2% (Global Value Share 2025), Others 91.8%
Additional Attributes Growth led by brightening claims, serums, dermatologist-tested positioning, strong e-commerce channels, premiumization trends, Asia-Pacific expansion, digital-first marketing, clean-label innovation, multifunctional skincare positioning

Key Segments

By Function:

  • Brightening
  • Oil control
  • Anti-aging
  • Skin barrier strengthening

By Product Type:

  • Serums
  • Creams/lotions
  • Toners
  • Masks

By Channel:

  • E-commerce
  • Pharmacies
  • Specialty beauty stores
  • Mass retail

By Claim:

  • Clean-label
  • Vegan
  • Natural/organic
  • Dermatologist-tested

By Region:

  • North America
  • Latin America
  • Europe
  • East Asia
  • South Asia & Pacific
  • Middle East and Africa

Frequently Asked Questions

How big is the Niacinamide Formulations Market in 2025?

The global Niacinamide Formulations Market is estimated to be valued at USD 2,251.3 million in 2025, supported by strong consumer demand for multifunctional skincare solutions and dermatologist-tested claims.

What will be the size of the Niacinamide Formulations Market in 2035?

The market size for the Niacinamide Formulations Market is projected to reach USD 7,305.6 million by 2035, reflecting substantial expansion across key regions including Asia-Pacific, North America, and Europe.

How much will the Niacinamide Formulations Market grow between 2025 and 2035?

The Niacinamide Formulations Market is expected to grow at a CAGR of 12.5% between 2025 and 2035, adding over USD 5,000 million in incremental revenues over the forecast period.

What are the key product types in the Niacinamide Formulations Market?

The key product types in the Niacinamide Formulations Market are serums and other formats such as creams, lotions, and toners, with serums leading the segment at 54.5% share in 2025.

Which function segment will contribute the largest share in the Niacinamide Formulations Market in 2025?

In terms of function, the brightening segment is projected to command 56.6% share of the Niacinamide Formulations Market in 2025, reinforcing its dominance as the most preferred benefit among global consumers.

Table of Content

  1. Executive Summary
    • Global Market Outlook
    • Demand-side Trends
    • Supply-side Trends
    • Technology Roadmap Analysis
    • Analysis and Recommendations
  2. Market Overview
    • Market Coverage / Taxonomy
    • Market Definition / Scope / Limitations
  3. Market Background
    • Market Dynamics
      • Drivers
      • Restraints
      • Opportunity
      • Trends
    • Scenario Forecast
      • Demand in Optimistic Scenario
      • Demand in Likely Scenario
      • Demand in Conservative Scenario
    • Opportunity Map Analysis
    • Product Life Cycle Analysis
    • Supply Chain Analysis
      • Supply Side Participants and their Roles
        • Producers
        • Mid-Level Participants (Traders/ Agents/ Brokers)
        • Wholesalers and Distributors
      • Value Added and Value Created at Node in the Supply Chain
      • List of Raw Material Suppliers
      • List of Existing and Potential Buyer’s
    • Investment Feasibility Matrix
    • Value Chain Analysis
      • Profit Margin Analysis
      • Wholesalers and Distributors
      • Retailers
    • PESTLE and Porter’s Analysis
    • Regulatory Landscape
      • By Key Regions
      • By Key Countries
    • Regional Parent Market Outlook
    • Production and Consumption Statistics
    • Import and Export Statistics
  4. Global Market Analysis 2020 to 2024 and Forecast, 2025 to 2035
    • Historical Market Size Value (USD Million) & Volume (Units) Analysis, 2020 to 2024
    • Current and Future Market Size Value (USD Million) & Volume (Units) Projections, 2025 to 2035
      • Y-o-Y Growth Trend Analysis
      • Absolute $ Opportunity Analysis
  5. Global Market Analysis 2020 to 2024 and Forecast 2025 to 2035, By Function
    • Introduction / Key Findings
    • Historical Market Size Value (USD Million) & Volume (Units) Analysis By Function, 2020 to 2024
    • Current and Future Market Size Value (USD Million) & Volume (Units) Analysis and Forecast By Function, 2025 to 2035
      • Brightening
      • Oil control
      • Anti-aging
      • Skin barrier strengthening
    • Y-o-Y Growth Trend Analysis By Function, 2020 to 2024
    • Absolute $ Opportunity Analysis By Function, 2025 to 2035
  6. Global Market Analysis 2020 to 2024 and Forecast 2025 to 2035, By Product Type
    • Introduction / Key Findings
    • Historical Market Size Value (USD Million) & Volume (Units) Analysis By Product Type, 2020 to 2024
    • Current and Future Market Size Value (USD Million) & Volume (Units) Analysis and Forecast By Product Type, 2025 to 2035
      • Serums
      • Creams/lotions
      • Toners
      • Masks
    • Y-o-Y Growth Trend Analysis By Product Type, 2020 to 2024
    • Absolute $ Opportunity Analysis By Product Type, 2025 to 2035
  7. Global Market Analysis 2020 to 2024 and Forecast 2025 to 2035, By Channel
    • Introduction / Key Findings
    • Historical Market Size Value (USD Million) & Volume (Units) Analysis By Channel, 2020 to 2024
    • Current and Future Market Size Value (USD Million) & Volume (Units) Analysis and Forecast By Channel, 2025 to 2035
      • E-commerce
      • Pharmacies
      • Specialty beauty stores
      • Mass retail
    • Y-o-Y Growth Trend Analysis By Channel, 2020 to 2024
    • Absolute $ Opportunity Analysis By Channel, 2025 to 2035
  8. Global Market Analysis 2020 to 2024 and Forecast 2025 to 2035, By Claim
    • Introduction / Key Findings
    • Historical Market Size Value (USD Million) & Volume (Units) Analysis By Claim, 2020 to 2024
    • Current and Future Market Size Value (USD Million) & Volume (Units) Analysis and Forecast By Claim, 2025 to 2035
      • Clean-label
      • Vegan
      • Natural/organic
      • Dermatologist-tested
    • Y-o-Y Growth Trend Analysis By Claim, 2020 to 2024
    • Absolute $ Opportunity Analysis By Claim, 2025 to 2035
  9. Global Market Analysis 2020 to 2024 and Forecast 2025 to 2035, By Region
    • Introduction
    • Historical Market Size Value (USD Million) & Volume (Units) Analysis By Region, 2020 to 2024
    • Current Market Size Value (USD Million) & Volume (Units) Analysis and Forecast By Region, 2025 to 2035
      • North America
      • Latin America
      • Europe
      • East Asia
      • South Asia & Pacific
      • Middle East and Africa
    • Market Attractiveness Analysis By Region
  10. North America Market Analysis 2020 to 2024 and Forecast 2025 to 2035, By Country
    • Historical Market Size Value (USD Million) & Volume (Units) Trend Analysis By Market Taxonomy, 2020 to 2024
    • Market Size Value (USD Million) & Volume (Units) Forecast By Market Taxonomy, 2025 to 2035
      • By Country
        • USA
        • Canada
      • By Function
      • By Product Type
      • By Channel
      • By Claim
    • Market Attractiveness Analysis
      • By Country
      • By Function
      • By Product Type
      • By Channel
      • By Claim
    • Key Takeaways
  11. Latin America Market Analysis 2020 to 2024 and Forecast 2025 to 2035, By Country
    • Historical Market Size Value (USD Million) & Volume (Units) Trend Analysis By Market Taxonomy, 2020 to 2024
    • Market Size Value (USD Million) & Volume (Units) Forecast By Market Taxonomy, 2025 to 2035
      • By Country
        • Brazil
        • Mexico
        • Colombia
        • Rest of Latin America
      • By Function
      • By Product Type
      • By Channel
      • By Claim
    • Market Attractiveness Analysis
      • By Country
      • By Function
      • By Product Type
      • By Channel
      • By Claim
    • Key Takeaways
  12. Europe Market Analysis 2020 to 2024 and Forecast 2025 to 2035, By Country
    • Historical Market Size Value (USD Million) & Volume (Units) Trend Analysis By Market Taxonomy, 2020 to 2024
    • Market Size Value (USD Million) & Volume (Units) Forecast By Market Taxonomy, 2025 to 2035
      • By Country
        • Germany
        • UK
        • France
        • Italy
        • Spain
        • Belgium
        • Netherlands
        • Nordic
        • Switzerland
        • Russia
        • Poland
        • Rest of Europe
      • By Function
      • By Product Type
      • By Channel
      • By Claim
    • Market Attractiveness Analysis
      • By Country
      • By Function
      • By Product Type
      • By Channel
      • By Claim
    • Key Takeaways
  13. East Asia Market Analysis 2020 to 2024 and Forecast 2025 to 2035, By Country
    • Historical Market Size Value (USD Million) & Volume (Units) Trend Analysis By Market Taxonomy, 2020 to 2024
    • Market Size Value (USD Million) & Volume (Units) Forecast By Market Taxonomy, 2025 to 2035
      • By Country
        • China
        • Japan
        • South Korea
      • By Function
      • By Product Type
      • By Channel
      • By Claim
    • Market Attractiveness Analysis
      • By Country
      • By Function
      • By Product Type
      • By Channel
      • By Claim
    • Key Takeaways
  14. South Asia & Pacific Market Analysis 2020 to 2024 and Forecast 2025 to 2035, By Country
    • Historical Market Size Value (USD Million) & Volume (Units) Trend Analysis By Market Taxonomy, 2020 to 2024
    • Market Size Value (USD Million) & Volume (Units) Forecast By Market Taxonomy, 2025 to 2035
      • By Country
        • India
        • Thailand
        • Malaysia
        • Indonesia
        • Singapore
        • Vietnam
        • Australia
        • New Zealand
        • Rest of South Asia
      • By Function
      • By Product Type
      • By Channel
      • By Claim
    • Market Attractiveness Analysis
      • By Country
      • By Function
      • By Product Type
      • By Channel
      • By Claim
    • Key Takeaways
  15. Middle East and Africa Market Analysis 2020 to 2024 and Forecast 2025 to 2035, By Country
    • Historical Market Size Value (USD Million) & Volume (Units) Trend Analysis By Market Taxonomy, 2020 to 2024
    • Market Size Value (USD Million) & Volume (Units) Forecast By Market Taxonomy, 2025 to 2035
      • By Country
        • Turkey
        • UAE
        • Saudi Arabia
        • Israel
        • Other GCC Countries
        • North Africa
        • South Africa
      • By Function
      • By Product Type
      • By Channel
      • By Claim
    • Market Attractiveness Analysis
      • By Country
      • By Function
      • By Product Type
      • By Channel
      • By Claim
    • Key Takeaways
  16. Key Countries Market Analysis
    • USA
      • Pricing Analysis
      • Market Share Analysis, 2024
        • By Function
        • By Product Type
        • By Channel
        • By Claim
    • Canada
      • Pricing Analysis
      • Market Share Analysis, 2024
        • By Function
        • By Product Type
        • By Channel
        • By Claim
    • Brazil
      • Pricing Analysis
      • Market Share Analysis, 2024
        • By Function
        • By Product Type
        • By Channel
        • By Claim
    • Mexico
      • Pricing Analysis
      • Market Share Analysis, 2024
        • By Function
        • By Product Type
        • By Channel
        • By Claim
    • Colombia
      • Pricing Analysis
      • Market Share Analysis, 2024
        • By Function
        • By Product Type
        • By Channel
        • By Claim
    • Germany
      • Pricing Analysis
      • Market Share Analysis, 2024
        • By Function
        • By Product Type
        • By Channel
        • By Claim
    • UK
      • Pricing Analysis
      • Market Share Analysis, 2024
        • By Function
        • By Product Type
        • By Channel
        • By Claim
    • France
      • Pricing Analysis
      • Market Share Analysis, 2024
        • By Function
        • By Product Type
        • By Channel
        • By Claim
    • Italy
      • Pricing Analysis
      • Market Share Analysis, 2024
        • By Function
        • By Product Type
        • By Channel
        • By Claim
    • Spain
      • Pricing Analysis
      • Market Share Analysis, 2024
        • By Function
        • By Product Type
        • By Channel
        • By Claim
    • Belgium
      • Pricing Analysis
      • Market Share Analysis, 2024
        • By Function
        • By Product Type
        • By Channel
        • By Claim
    • Netherlands
      • Pricing Analysis
      • Market Share Analysis, 2024
        • By Function
        • By Product Type
        • By Channel
        • By Claim
    • Nordic
      • Pricing Analysis
      • Market Share Analysis, 2024
        • By Function
        • By Product Type
        • By Channel
        • By Claim
    • Switzerland
      • Pricing Analysis
      • Market Share Analysis, 2024
        • By Function
        • By Product Type
        • By Channel
        • By Claim
    • Russia
      • Pricing Analysis
      • Market Share Analysis, 2024
        • By Function
        • By Product Type
        • By Channel
        • By Claim
    • Poland
      • Pricing Analysis
      • Market Share Analysis, 2024
        • By Function
        • By Product Type
        • By Channel
        • By Claim
    • China
      • Pricing Analysis
      • Market Share Analysis, 2024
        • By Function
        • By Product Type
        • By Channel
        • By Claim
    • Japan
      • Pricing Analysis
      • Market Share Analysis, 2024
        • By Function
        • By Product Type
        • By Channel
        • By Claim
    • South Korea
      • Pricing Analysis
      • Market Share Analysis, 2024
        • By Function
        • By Product Type
        • By Channel
        • By Claim
    • India
      • Pricing Analysis
      • Market Share Analysis, 2024
        • By Function
        • By Product Type
        • By Channel
        • By Claim
    • Thailand
      • Pricing Analysis
      • Market Share Analysis, 2024
        • By Function
        • By Product Type
        • By Channel
        • By Claim
    • Indonesia
      • Pricing Analysis
      • Market Share Analysis, 2024
        • By Function
        • By Product Type
        • By Channel
        • By Claim
    • Australia
      • Pricing Analysis
      • Market Share Analysis, 2024
        • By Function
        • By Product Type
        • By Channel
        • By Claim
    • New Zealand
      • Pricing Analysis
      • Market Share Analysis, 2024
        • By Function
        • By Product Type
        • By Channel
        • By Claim
    • Turkey
      • Pricing Analysis
      • Market Share Analysis, 2024
        • By Function
        • By Product Type
        • By Channel
        • By Claim
    • UAE
      • Pricing Analysis
      • Market Share Analysis, 2024
        • By Function
        • By Product Type
        • By Channel
        • By Claim
    • Saudi Arabia
      • Pricing Analysis
      • Market Share Analysis, 2024
        • By Function
        • By Product Type
        • By Channel
        • By Claim
    • Israel
      • Pricing Analysis
      • Market Share Analysis, 2024
        • By Function
        • By Product Type
        • By Channel
        • By Claim
    • North Africa
      • Pricing Analysis
      • Market Share Analysis, 2024
        • By Function
        • By Product Type
        • By Channel
        • By Claim
    • South Africa
      • Pricing Analysis
      • Market Share Analysis, 2024
        • By Function
        • By Product Type
        • By Channel
        • By Claim
  17. Market Structure Analysis
    • Competition Dashboard
    • Competition Benchmarking
    • Market Share Analysis of Top Players
      • By Regional
      • By Function
      • By Product Type
      • By Channel
      • By Claim
  18. Competition Analysis
    • Competition Deep Dive
      • The Ordinary
        • Overview
        • Product Portfolio
        • Profitability by Market Segments (Product/Age /Sales Channel/Region)
        • Sales Footprint
        • Strategy Overview
          • Marketing Strategy
          • Product Strategy
          • Channel Strategy
      • Paula’s Choice
        • Overview
        • Product Portfolio
        • Profitability by Market Segments (Product/Age /Sales Channel/Region)
        • Sales Footprint
        • Strategy Overview
          • Marketing Strategy
          • Product Strategy
          • Channel Strategy
      • Olay
        • Overview
        • Product Portfolio
        • Profitability by Market Segments (Product/Age /Sales Channel/Region)
        • Sales Footprint
        • Strategy Overview
          • Marketing Strategy
          • Product Strategy
          • Channel Strategy
      • La Roche-Posay
        • Overview
        • Product Portfolio
        • Profitability by Market Segments (Product/Age /Sales Channel/Region)
        • Sales Footprint
        • Strategy Overview
          • Marketing Strategy
          • Product Strategy
          • Channel Strategy
      • CeraVe
        • Overview
        • Product Portfolio
        • Profitability by Market Segments (Product/Age /Sales Channel/Region)
        • Sales Footprint
        • Strategy Overview
          • Marketing Strategy
          • Product Strategy
          • Channel Strategy
      • Clinique
        • Overview
        • Product Portfolio
        • Profitability by Market Segments (Product/Age /Sales Channel/Region)
        • Sales Footprint
        • Strategy Overview
          • Marketing Strategy
          • Product Strategy
          • Channel Strategy
      • Estée Lauder
        • Overview
        • Product Portfolio
        • Profitability by Market Segments (Product/Age /Sales Channel/Region)
        • Sales Footprint
        • Strategy Overview
          • Marketing Strategy
          • Product Strategy
          • Channel Strategy
      • Murad
        • Overview
        • Product Portfolio
        • Profitability by Market Segments (Product/Age /Sales Channel/Region)
        • Sales Footprint
        • Strategy Overview
          • Marketing Strategy
          • Product Strategy
          • Channel Strategy
      • Kiehl’s
        • Overview
        • Product Portfolio
        • Profitability by Market Segments (Product/Age /Sales Channel/Region)
        • Sales Footprint
        • Strategy Overview
          • Marketing Strategy
          • Product Strategy
          • Channel Strategy
      • Bioderma
        • Overview
        • Product Portfolio
        • Profitability by Market Segments (Product/Age /Sales Channel/Region)
        • Sales Footprint
        • Strategy Overview
          • Marketing Strategy
          • Product Strategy
          • Channel Strategy
      • Others
        • Overview
        • Product Portfolio
        • Profitability by Market Segments (Product/Age /Sales Channel/Region)
        • Sales Footprint
        • Strategy Overview
          • Marketing Strategy
          • Product Strategy
          • Channel Strategy
  19. Assumptions & Acronyms Used
  20. Research Methodology

List of Tables

  • Table 1: Global Market Value (USD Million) Forecast by Region, 2020-2035
  • Table 2: Global Market Volume (Units) Forecast by Region, 2020-2035
  • Table 3: Global Market Value (USD Million) Forecast by Function, 2020-2035
  • Table 4: Global Market Volume (Units) Forecast by Function, 2020-2035
  • Table 5: Global Market Value (USD Million) Forecast by Product Type, 2020-2035
  • Table 6: Global Market Volume (Units) Forecast by Product Type, 2020-2035
  • Table 7: Global Market Value (USD Million) Forecast by Channel, 2020-2035
  • Table 8: Global Market Volume (Units) Forecast by Channel, 2020-2035
  • Table 9: Global Market Value (USD Million) Forecast by Claim, 2020-2035
  • Table 10: Global Market Volume (Units) Forecast by Claim, 2020-2035
  • Table 11: North America Market Value (USD Million) Forecast by Country, 2020-2035
  • Table 12: North America Market Volume (Units) Forecast by Country, 2020-2035
  • Table 13: North America Market Value (USD Million) Forecast by Function, 2020-2035
  • Table 14: North America Market Volume (Units) Forecast by Function, 2020-2035
  • Table 15: North America Market Value (USD Million) Forecast by Product Type, 2020-2035
  • Table 16: North America Market Volume (Units) Forecast by Product Type, 2020-2035
  • Table 17: North America Market Value (USD Million) Forecast by Channel, 2020-2035
  • Table 18: North America Market Volume (Units) Forecast by Channel, 2020-2035
  • Table 19: North America Market Value (USD Million) Forecast by Claim, 2020-2035
  • Table 20: North America Market Volume (Units) Forecast by Claim, 2020-2035
  • Table 21: Latin America Market Value (USD Million) Forecast by Country, 2020-2035
  • Table 22: Latin America Market Volume (Units) Forecast by Country, 2020-2035
  • Table 23: Latin America Market Value (USD Million) Forecast by Function, 2020-2035
  • Table 24: Latin America Market Volume (Units) Forecast by Function, 2020-2035
  • Table 25: Latin America Market Value (USD Million) Forecast by Product Type, 2020-2035
  • Table 26: Latin America Market Volume (Units) Forecast by Product Type, 2020-2035
  • Table 27: Latin America Market Value (USD Million) Forecast by Channel, 2020-2035
  • Table 28: Latin America Market Volume (Units) Forecast by Channel, 2020-2035
  • Table 29: Latin America Market Value (USD Million) Forecast by Claim, 2020-2035
  • Table 30: Latin America Market Volume (Units) Forecast by Claim, 2020-2035
  • Table 31: Europe Market Value (USD Million) Forecast by Country, 2020-2035
  • Table 32: Europe Market Volume (Units) Forecast by Country, 2020-2035
  • Table 33: Europe Market Value (USD Million) Forecast by Function, 2020-2035
  • Table 34: Europe Market Volume (Units) Forecast by Function, 2020-2035
  • Table 35: Europe Market Value (USD Million) Forecast by Product Type, 2020-2035
  • Table 36: Europe Market Volume (Units) Forecast by Product Type, 2020-2035
  • Table 37: Europe Market Value (USD Million) Forecast by Channel, 2020-2035
  • Table 38: Europe Market Volume (Units) Forecast by Channel, 2020-2035
  • Table 39: Europe Market Value (USD Million) Forecast by Claim, 2020-2035
  • Table 40: Europe Market Volume (Units) Forecast by Claim, 2020-2035
  • Table 41: East Asia Market Value (USD Million) Forecast by Country, 2020-2035
  • Table 42: East Asia Market Volume (Units) Forecast by Country, 2020-2035
  • Table 43: East Asia Market Value (USD Million) Forecast by Function, 2020-2035
  • Table 44: East Asia Market Volume (Units) Forecast by Function, 2020-2035
  • Table 45: East Asia Market Value (USD Million) Forecast by Product Type, 2020-2035
  • Table 46: East Asia Market Volume (Units) Forecast by Product Type, 2020-2035
  • Table 47: East Asia Market Value (USD Million) Forecast by Channel, 2020-2035
  • Table 48: East Asia Market Volume (Units) Forecast by Channel, 2020-2035
  • Table 49: East Asia Market Value (USD Million) Forecast by Claim, 2020-2035
  • Table 50: East Asia Market Volume (Units) Forecast by Claim, 2020-2035
  • Table 51: South Asia & Pacific Market Value (USD Million) Forecast by Country, 2020-2035
  • Table 52: South Asia & Pacific Market Volume (Units) Forecast by Country, 2020-2035
  • Table 53: South Asia & Pacific Market Value (USD Million) Forecast by Function, 2020-2035
  • Table 54: South Asia & Pacific Market Volume (Units) Forecast by Function, 2020-2035
  • Table 55: South Asia & Pacific Market Value (USD Million) Forecast by Product Type, 2020-2035
  • Table 56: South Asia & Pacific Market Volume (Units) Forecast by Product Type, 2020-2035
  • Table 57: South Asia & Pacific Market Value (USD Million) Forecast by Channel, 2020-2035
  • Table 58: South Asia & Pacific Market Volume (Units) Forecast by Channel, 2020-2035
  • Table 59: South Asia & Pacific Market Value (USD Million) Forecast by Claim, 2020-2035
  • Table 60: South Asia & Pacific Market Volume (Units) Forecast by Claim, 2020-2035
  • Table 61: Middle East and Africa Market Value (USD Million) Forecast by Country, 2020-2035
  • Table 62: Middle East and Africa Market Volume (Units) Forecast by Country, 2020-2035
  • Table 63: Middle East and Africa Market Value (USD Million) Forecast by Function, 2020-2035
  • Table 64: Middle East and Africa Market Volume (Units) Forecast by Function, 2020-2035
  • Table 65: Middle East and Africa Market Value (USD Million) Forecast by Product Type, 2020-2035
  • Table 66: Middle East and Africa Market Volume (Units) Forecast by Product Type, 2020-2035
  • Table 67: Middle East and Africa Market Value (USD Million) Forecast by Channel, 2020-2035
  • Table 68: Middle East and Africa Market Volume (Units) Forecast by Channel, 2020-2035
  • Table 69: Middle East and Africa Market Value (USD Million) Forecast by Claim, 2020-2035
  • Table 70: Middle East and Africa Market Volume (Units) Forecast by Claim, 2020-2035

List of Figures

  • Figure 1: Global Market Value (USD Million) by Function, 2025-2035
  • Figure 2: Global Market Value (USD Million) by Product Type, 2025-2035
  • Figure 3: Global Market Value (USD Million) by Channel, 2025-2035
  • Figure 4: Global Market Value (USD Million) by Claim, 2025-2035
  • Figure 5: Global Market Value (USD Million) by Region, 2025-2035
  • Figure 6: Global Market Value (USD Million) Analysis by Region, 2020-2035
  • Figure 7: Global Market Volume (Units) Analysis by Region, 2020-2035
  • Figure 8: Global Market Value Share (%) and BPS Analysis by Region, 2025-2035
  • Figure 9: Global Market Y-o-Y Growth (%) Projections by Region, 2025-2035
  • Figure 10: Global Market Value (USD Million) Analysis by Function, 2020-2035
  • Figure 11: Global Market Volume (Units) Analysis by Function, 2020-2035
  • Figure 12: Global Market Value Share (%) and BPS Analysis by Function, 2025-2035
  • Figure 13: Global Market Y-o-Y Growth (%) Projections by Function, 2025-2035
  • Figure 14: Global Market Value (USD Million) Analysis by Product Type, 2020-2035
  • Figure 15: Global Market Volume (Units) Analysis by Product Type, 2020-2035
  • Figure 16: Global Market Value Share (%) and BPS Analysis by Product Type, 2025-2035
  • Figure 17: Global Market Y-o-Y Growth (%) Projections by Product Type, 2025-2035
  • Figure 18: Global Market Value (USD Million) Analysis by Channel, 2020-2035
  • Figure 19: Global Market Volume (Units) Analysis by Channel, 2020-2035
  • Figure 20: Global Market Value Share (%) and BPS Analysis by Channel, 2025-2035
  • Figure 21: Global Market Y-o-Y Growth (%) Projections by Channel, 2025-2035
  • Figure 22: Global Market Value (USD Million) Analysis by Claim, 2020-2035
  • Figure 23: Global Market Volume (Units) Analysis by Claim, 2020-2035
  • Figure 24: Global Market Value Share (%) and BPS Analysis by Claim, 2025-2035
  • Figure 25: Global Market Y-o-Y Growth (%) Projections by Claim, 2025-2035
  • Figure 26: Global Market Attractiveness by Function, 2025-2035
  • Figure 27: Global Market Attractiveness by Product Type, 2025-2035
  • Figure 28: Global Market Attractiveness by Channel, 2025-2035
  • Figure 29: Global Market Attractiveness by Claim, 2025-2035
  • Figure 30: Global Market Attractiveness by Region, 2025-2035
  • Figure 31: North America Market Value (USD Million) by Function, 2025-2035
  • Figure 32: North America Market Value (USD Million) by Product Type, 2025-2035
  • Figure 33: North America Market Value (USD Million) by Channel, 2025-2035
  • Figure 34: North America Market Value (USD Million) by Claim, 2025-2035
  • Figure 35: North America Market Value (USD Million) by Country, 2025-2035
  • Figure 36: North America Market Value (USD Million) Analysis by Country, 2020-2035
  • Figure 37: North America Market Volume (Units) Analysis by Country, 2020-2035
  • Figure 38: North America Market Value Share (%) and BPS Analysis by Country, 2025-2035
  • Figure 39: North America Market Y-o-Y Growth (%) Projections by Country, 2025-2035
  • Figure 40: North America Market Value (USD Million) Analysis by Function, 2020-2035
  • Figure 41: North America Market Volume (Units) Analysis by Function, 2020-2035
  • Figure 42: North America Market Value Share (%) and BPS Analysis by Function, 2025-2035
  • Figure 43: North America Market Y-o-Y Growth (%) Projections by Function, 2025-2035
  • Figure 44: North America Market Value (USD Million) Analysis by Product Type, 2020-2035
  • Figure 45: North America Market Volume (Units) Analysis by Product Type, 2020-2035
  • Figure 46: North America Market Value Share (%) and BPS Analysis by Product Type, 2025-2035
  • Figure 47: North America Market Y-o-Y Growth (%) Projections by Product Type, 2025-2035
  • Figure 48: North America Market Value (USD Million) Analysis by Channel, 2020-2035
  • Figure 49: North America Market Volume (Units) Analysis by Channel, 2020-2035
  • Figure 50: North America Market Value Share (%) and BPS Analysis by Channel, 2025-2035
  • Figure 51: North America Market Y-o-Y Growth (%) Projections by Channel, 2025-2035
  • Figure 52: North America Market Value (USD Million) Analysis by Claim, 2020-2035
  • Figure 53: North America Market Volume (Units) Analysis by Claim, 2020-2035
  • Figure 54: North America Market Value Share (%) and BPS Analysis by Claim, 2025-2035
  • Figure 55: North America Market Y-o-Y Growth (%) Projections by Claim, 2025-2035
  • Figure 56: North America Market Attractiveness by Function, 2025-2035
  • Figure 57: North America Market Attractiveness by Product Type, 2025-2035
  • Figure 58: North America Market Attractiveness by Channel, 2025-2035
  • Figure 59: North America Market Attractiveness by Claim, 2025-2035
  • Figure 60: North America Market Attractiveness by Country, 2025-2035
  • Figure 61: Latin America Market Value (USD Million) by Function, 2025-2035
  • Figure 62: Latin America Market Value (USD Million) by Product Type, 2025-2035
  • Figure 63: Latin America Market Value (USD Million) by Channel, 2025-2035
  • Figure 64: Latin America Market Value (USD Million) by Claim, 2025-2035
  • Figure 65: Latin America Market Value (USD Million) by Country, 2025-2035
  • Figure 66: Latin America Market Value (USD Million) Analysis by Country, 2020-2035
  • Figure 67: Latin America Market Volume (Units) Analysis by Country, 2020-2035
  • Figure 68: Latin America Market Value Share (%) and BPS Analysis by Country, 2025-2035
  • Figure 69: Latin America Market Y-o-Y Growth (%) Projections by Country, 2025-2035
  • Figure 70: Latin America Market Value (USD Million) Analysis by Function, 2020-2035
  • Figure 71: Latin America Market Volume (Units) Analysis by Function, 2020-2035
  • Figure 72: Latin America Market Value Share (%) and BPS Analysis by Function, 2025-2035
  • Figure 73: Latin America Market Y-o-Y Growth (%) Projections by Function, 2025-2035
  • Figure 74: Latin America Market Value (USD Million) Analysis by Product Type, 2020-2035
  • Figure 75: Latin America Market Volume (Units) Analysis by Product Type, 2020-2035
  • Figure 76: Latin America Market Value Share (%) and BPS Analysis by Product Type, 2025-2035
  • Figure 77: Latin America Market Y-o-Y Growth (%) Projections by Product Type, 2025-2035
  • Figure 78: Latin America Market Value (USD Million) Analysis by Channel, 2020-2035
  • Figure 79: Latin America Market Volume (Units) Analysis by Channel, 2020-2035
  • Figure 80: Latin America Market Value Share (%) and BPS Analysis by Channel, 2025-2035
  • Figure 81: Latin America Market Y-o-Y Growth (%) Projections by Channel, 2025-2035
  • Figure 82: Latin America Market Value (USD Million) Analysis by Claim, 2020-2035
  • Figure 83: Latin America Market Volume (Units) Analysis by Claim, 2020-2035
  • Figure 84: Latin America Market Value Share (%) and BPS Analysis by Claim, 2025-2035
  • Figure 85: Latin America Market Y-o-Y Growth (%) Projections by Claim, 2025-2035
  • Figure 86: Latin America Market Attractiveness by Function, 2025-2035
  • Figure 87: Latin America Market Attractiveness by Product Type, 2025-2035
  • Figure 88: Latin America Market Attractiveness by Channel, 2025-2035
  • Figure 89: Latin America Market Attractiveness by Claim, 2025-2035
  • Figure 90: Latin America Market Attractiveness by Country, 2025-2035
  • Figure 91: Europe Market Value (USD Million) by Function, 2025-2035
  • Figure 92: Europe Market Value (USD Million) by Product Type, 2025-2035
  • Figure 93: Europe Market Value (USD Million) by Channel, 2025-2035
  • Figure 94: Europe Market Value (USD Million) by Claim, 2025-2035
  • Figure 95: Europe Market Value (USD Million) by Country, 2025-2035
  • Figure 96: Europe Market Value (USD Million) Analysis by Country, 2020-2035
  • Figure 97: Europe Market Volume (Units) Analysis by Country, 2020-2035
  • Figure 98: Europe Market Value Share (%) and BPS Analysis by Country, 2025-2035
  • Figure 99: Europe Market Y-o-Y Growth (%) Projections by Country, 2025-2035
  • Figure 100: Europe Market Value (USD Million) Analysis by Function, 2020-2035
  • Figure 101: Europe Market Volume (Units) Analysis by Function, 2020-2035
  • Figure 102: Europe Market Value Share (%) and BPS Analysis by Function, 2025-2035
  • Figure 103: Europe Market Y-o-Y Growth (%) Projections by Function, 2025-2035
  • Figure 104: Europe Market Value (USD Million) Analysis by Product Type, 2020-2035
  • Figure 105: Europe Market Volume (Units) Analysis by Product Type, 2020-2035
  • Figure 106: Europe Market Value Share (%) and BPS Analysis by Product Type, 2025-2035
  • Figure 107: Europe Market Y-o-Y Growth (%) Projections by Product Type, 2025-2035
  • Figure 108: Europe Market Value (USD Million) Analysis by Channel, 2020-2035
  • Figure 109: Europe Market Volume (Units) Analysis by Channel, 2020-2035
  • Figure 110: Europe Market Value Share (%) and BPS Analysis by Channel, 2025-2035
  • Figure 111: Europe Market Y-o-Y Growth (%) Projections by Channel, 2025-2035
  • Figure 112: Europe Market Value (USD Million) Analysis by Claim, 2020-2035
  • Figure 113: Europe Market Volume (Units) Analysis by Claim, 2020-2035
  • Figure 114: Europe Market Value Share (%) and BPS Analysis by Claim, 2025-2035
  • Figure 115: Europe Market Y-o-Y Growth (%) Projections by Claim, 2025-2035
  • Figure 116: Europe Market Attractiveness by Function, 2025-2035
  • Figure 117: Europe Market Attractiveness by Product Type, 2025-2035
  • Figure 118: Europe Market Attractiveness by Channel, 2025-2035
  • Figure 119: Europe Market Attractiveness by Claim, 2025-2035
  • Figure 120: Europe Market Attractiveness by Country, 2025-2035
  • Figure 121: East Asia Market Value (USD Million) by Function, 2025-2035
  • Figure 122: East Asia Market Value (USD Million) by Product Type, 2025-2035
  • Figure 123: East Asia Market Value (USD Million) by Channel, 2025-2035
  • Figure 124: East Asia Market Value (USD Million) by Claim, 2025-2035
  • Figure 125: East Asia Market Value (USD Million) by Country, 2025-2035
  • Figure 126: East Asia Market Value (USD Million) Analysis by Country, 2020-2035
  • Figure 127: East Asia Market Volume (Units) Analysis by Country, 2020-2035
  • Figure 128: East Asia Market Value Share (%) and BPS Analysis by Country, 2025-2035
  • Figure 129: East Asia Market Y-o-Y Growth (%) Projections by Country, 2025-2035
  • Figure 130: East Asia Market Value (USD Million) Analysis by Function, 2020-2035
  • Figure 131: East Asia Market Volume (Units) Analysis by Function, 2020-2035
  • Figure 132: East Asia Market Value Share (%) and BPS Analysis by Function, 2025-2035
  • Figure 133: East Asia Market Y-o-Y Growth (%) Projections by Function, 2025-2035
  • Figure 134: East Asia Market Value (USD Million) Analysis by Product Type, 2020-2035
  • Figure 135: East Asia Market Volume (Units) Analysis by Product Type, 2020-2035
  • Figure 136: East Asia Market Value Share (%) and BPS Analysis by Product Type, 2025-2035
  • Figure 137: East Asia Market Y-o-Y Growth (%) Projections by Product Type, 2025-2035
  • Figure 138: East Asia Market Value (USD Million) Analysis by Channel, 2020-2035
  • Figure 139: East Asia Market Volume (Units) Analysis by Channel, 2020-2035
  • Figure 140: East Asia Market Value Share (%) and BPS Analysis by Channel, 2025-2035
  • Figure 141: East Asia Market Y-o-Y Growth (%) Projections by Channel, 2025-2035
  • Figure 142: East Asia Market Value (USD Million) Analysis by Claim, 2020-2035
  • Figure 143: East Asia Market Volume (Units) Analysis by Claim, 2020-2035
  • Figure 144: East Asia Market Value Share (%) and BPS Analysis by Claim, 2025-2035
  • Figure 145: East Asia Market Y-o-Y Growth (%) Projections by Claim, 2025-2035
  • Figure 146: East Asia Market Attractiveness by Function, 2025-2035
  • Figure 147: East Asia Market Attractiveness by Product Type, 2025-2035
  • Figure 148: East Asia Market Attractiveness by Channel, 2025-2035
  • Figure 149: East Asia Market Attractiveness by Claim, 2025-2035
  • Figure 150: East Asia Market Attractiveness by Country, 2025-2035
  • Figure 151: South Asia & Pacific Market Value (USD Million) by Function, 2025-2035
  • Figure 152: South Asia & Pacific Market Value (USD Million) by Product Type, 2025-2035
  • Figure 153: South Asia & Pacific Market Value (USD Million) by Channel, 2025-2035
  • Figure 154: South Asia & Pacific Market Value (USD Million) by Claim, 2025-2035
  • Figure 155: South Asia & Pacific Market Value (USD Million) by Country, 2025-2035
  • Figure 156: South Asia & Pacific Market Value (USD Million) Analysis by Country, 2020-2035
  • Figure 157: South Asia & Pacific Market Volume (Units) Analysis by Country, 2020-2035
  • Figure 158: South Asia & Pacific Market Value Share (%) and BPS Analysis by Country, 2025-2035
  • Figure 159: South Asia & Pacific Market Y-o-Y Growth (%) Projections by Country, 2025-2035
  • Figure 160: South Asia & Pacific Market Value (USD Million) Analysis by Function, 2020-2035
  • Figure 161: South Asia & Pacific Market Volume (Units) Analysis by Function, 2020-2035
  • Figure 162: South Asia & Pacific Market Value Share (%) and BPS Analysis by Function, 2025-2035
  • Figure 163: South Asia & Pacific Market Y-o-Y Growth (%) Projections by Function, 2025-2035
  • Figure 164: South Asia & Pacific Market Value (USD Million) Analysis by Product Type, 2020-2035
  • Figure 165: South Asia & Pacific Market Volume (Units) Analysis by Product Type, 2020-2035
  • Figure 166: South Asia & Pacific Market Value Share (%) and BPS Analysis by Product Type, 2025-2035
  • Figure 167: South Asia & Pacific Market Y-o-Y Growth (%) Projections by Product Type, 2025-2035
  • Figure 168: South Asia & Pacific Market Value (USD Million) Analysis by Channel, 2020-2035
  • Figure 169: South Asia & Pacific Market Volume (Units) Analysis by Channel, 2020-2035
  • Figure 170: South Asia & Pacific Market Value Share (%) and BPS Analysis by Channel, 2025-2035
  • Figure 171: South Asia & Pacific Market Y-o-Y Growth (%) Projections by Channel, 2025-2035
  • Figure 172: South Asia & Pacific Market Value (USD Million) Analysis by Claim, 2020-2035
  • Figure 173: South Asia & Pacific Market Volume (Units) Analysis by Claim, 2020-2035
  • Figure 174: South Asia & Pacific Market Value Share (%) and BPS Analysis by Claim, 2025-2035
  • Figure 175: South Asia & Pacific Market Y-o-Y Growth (%) Projections by Claim, 2025-2035
  • Figure 176: South Asia & Pacific Market Attractiveness by Function, 2025-2035
  • Figure 177: South Asia & Pacific Market Attractiveness by Product Type, 2025-2035
  • Figure 178: South Asia & Pacific Market Attractiveness by Channel, 2025-2035
  • Figure 179: South Asia & Pacific Market Attractiveness by Claim, 2025-2035
  • Figure 180: South Asia & Pacific Market Attractiveness by Country, 2025-2035
  • Figure 181: Middle East and Africa Market Value (USD Million) by Function, 2025-2035
  • Figure 182: Middle East and Africa Market Value (USD Million) by Product Type, 2025-2035
  • Figure 183: Middle East and Africa Market Value (USD Million) by Channel, 2025-2035
  • Figure 184: Middle East and Africa Market Value (USD Million) by Claim, 2025-2035
  • Figure 185: Middle East and Africa Market Value (USD Million) by Country, 2025-2035
  • Figure 186: Middle East and Africa Market Value (USD Million) Analysis by Country, 2020-2035
  • Figure 187: Middle East and Africa Market Volume (Units) Analysis by Country, 2020-2035
  • Figure 188: Middle East and Africa Market Value Share (%) and BPS Analysis by Country, 2025-2035
  • Figure 189: Middle East and Africa Market Y-o-Y Growth (%) Projections by Country, 2025-2035
  • Figure 190: Middle East and Africa Market Value (USD Million) Analysis by Function, 2020-2035
  • Figure 191: Middle East and Africa Market Volume (Units) Analysis by Function, 2020-2035
  • Figure 192: Middle East and Africa Market Value Share (%) and BPS Analysis by Function, 2025-2035
  • Figure 193: Middle East and Africa Market Y-o-Y Growth (%) Projections by Function, 2025-2035
  • Figure 194: Middle East and Africa Market Value (USD Million) Analysis by Product Type, 2020-2035
  • Figure 195: Middle East and Africa Market Volume (Units) Analysis by Product Type, 2020-2035
  • Figure 196: Middle East and Africa Market Value Share (%) and BPS Analysis by Product Type, 2025-2035
  • Figure 197: Middle East and Africa Market Y-o-Y Growth (%) Projections by Product Type, 2025-2035
  • Figure 198: Middle East and Africa Market Value (USD Million) Analysis by Channel, 2020-2035
  • Figure 199: Middle East and Africa Market Volume (Units) Analysis by Channel, 2020-2035
  • Figure 200: Middle East and Africa Market Value Share (%) and BPS Analysis by Channel, 2025-2035
  • Figure 201: Middle East and Africa Market Y-o-Y Growth (%) Projections by Channel, 2025-2035
  • Figure 202: Middle East and Africa Market Value (USD Million) Analysis by Claim, 2020-2035
  • Figure 203: Middle East and Africa Market Volume (Units) Analysis by Claim, 2020-2035
  • Figure 204: Middle East and Africa Market Value Share (%) and BPS Analysis by Claim, 2025-2035
  • Figure 205: Middle East and Africa Market Y-o-Y Growth (%) Projections by Claim, 2025-2035
  • Figure 206: Middle East and Africa Market Attractiveness by Function, 2025-2035
  • Figure 207: Middle East and Africa Market Attractiveness by Product Type, 2025-2035
  • Figure 208: Middle East and Africa Market Attractiveness by Channel, 2025-2035
  • Figure 209: Middle East and Africa Market Attractiveness by Claim, 2025-2035
  • Figure 210: Middle East and Africa Market Attractiveness by Country, 2025-2035
Dashboard
Dashboard
Dashboard
Dashboard
Dashboard
Dashboard

Full Research Suite comprises of:

Market outlook & trends analysis

Market outlook & trends analysis

Interviews & case studies

Interviews & case studies

Strategic recommendations

Strategic recommendations

Vendor profiles & capabilities analysis

Vendor profiles & capabilities analysis

5-year forecasts

5-year forecasts

8 regions and 60+ country-level data splits

8 regions and 60+ country-level data splits

Market segment data splits

Market segment data splits

12 months of continuous data updates

12 months of continuous data updates

DELIVERED AS:

PDF EXCEL ONLINE

Full Research Suite


$2000

$3500

$5000

Buy Report Now
Similar Industry Reports

Similar Industry Reports

Niacinamide Serums Market

Niacinamide Serums Market Size and Share Forecast Outlook 2025 to 2035

Niacin and Niacinamide Market

Niacin and Niacinamide Market Analysis - Size, Share, and Forecast Outlook 2025 to 2035

Bakuchiol Formulations Market

Bakuchiol Formulations Market Analysis - Size and Share Forecast Outlook 2025 to 2035

Modified Release Formulations Market

Modified Release Formulations Market Analysis - Size, Share, & Forecast Outlook 2025 to 2035

Demand for Hybrid Protein Blends in Private Label Formulations

Demand for Hybrid Protein Blends in Private Label Formulations in CIS Size and Share Forecast Outlook 2025 to 2035

Future Market Insights

Niacinamide Formulations Market

Chat With MaRIA

Chat With

MaRIA

Hi There, I am MaRIA, Your Market Research Intelligence Assistant. How may I help you?