Modified Release Formulations Market Size and Share Forecast Outlook 2025 to 2035

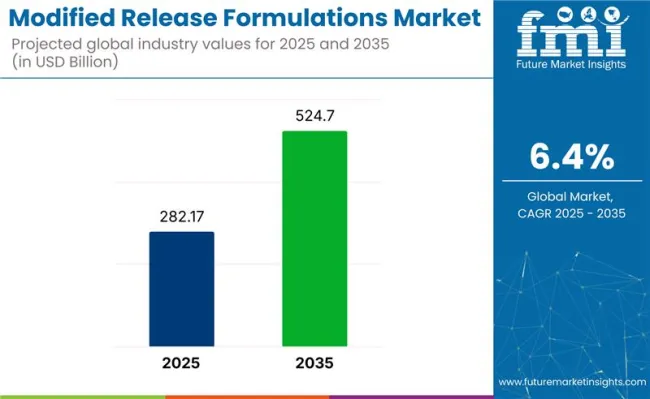
The global modified release formulations market is set for continued expansion between 2025 and 2035, with its size projected to rise from USD 282.1 billion to approximately USD 524.7 billion, representing a CAGR of 6.4%.
Quick Stats in Modified Release Formulations Market

  • Market Value (2025): USD 282.1 billion
  • Forecast Value (2035): USD 524.7 billion
  • Forecast CAGR (2025 to 2035): 6.4%
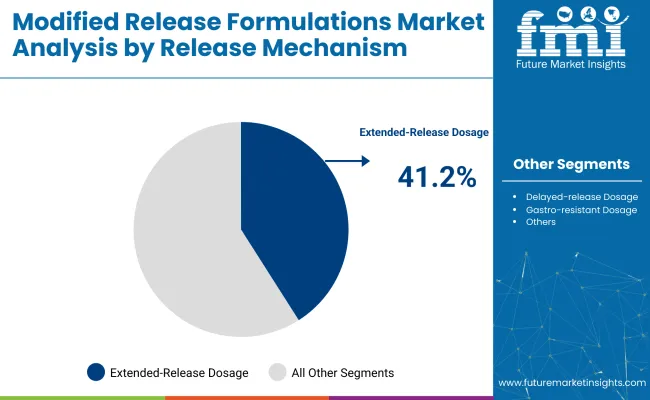
  • Leading Release Mechanism (2025): Extended-Release Dosage (41.2% share)
  • Key Growth Regions: Asia Pacific (India)
  • Key Companies: Catalent, Inc, Recipharm AB, Quotient Sciences, Adragos Pharma, BioDuro, Zocalo Pharmaceutical Ltd.

Modified Release Formulations Market

Growth is driven by increasing demand for more effective, patient-friendly drug delivery systems that optimize pharmacokinetic profiles, reduce side effects, and enhance compliance-particularly for chronic and long-term therapies.

The modified release formulations market represents a significant segment within the broader pharmaceutical industry. While specific percentage share estimates vary, it is generally recognized that modified release formulations contribute a substantial portion to the drug delivery systems market, where it holds around 30-40% of the share. In the broader pharmaceutical industry, this sector accounts for approximately 10-15%, driven by increasing demand for controlled and targeted drug delivery methods.

The generic drugs industry also relies heavily on modified release formulations, with a growing adoption in generic drug production to extend product lifecycle. In the biopharmaceuticals and contract manufacturing organization markets, the share is smaller but steadily increasing, given the increasing emphasis on specialized delivery methods in biologics and outsourced production.

Regulatory bodies such as the USA FDA and EMA have expanded guidance on in vitro-in vivo correlation (IVIVC) models and bioequivalence protocols, particularly for modified-release products. These frameworks are enabling drug developers to reduce R&D risks and accelerate time-to-market by allowing clinical study waivers based on predictive models.

Simultaneously, there is a rise in investments in polymer science and nanotechnology to enhance formulation stability and precision in drug release. Leading pharmaceutical companies are forming strategic partnerships with CDMOs to scale production and develop customized release profiles across therapeutic areas, supporting innovation in advanced drug delivery systems.

Analysis of Modified Release Formulations Market by Top Investment Segments

Extended-release dosage forms, matrix tablets, and pharmaceutical & biopharmaceutical companies are expected to dominate the modified release formulations industry by 2025, driven by innovation in drug delivery and patient compliance strategies.

Extended-Release Dosage Leads Release Mechanism Segment

Extended-release dosage forms are projected to lead the release mechanism segment with a 41.2% share in 2025.
  • The formulations offer controlled and extended drug release, enhancing therapeutic outcomes and patient adherence. They are primarily used in chronic conditions like cardiovascular diseases, psychiatric disorders, and diabetes, where stable drug levels are vital.
  • Technological advancements in coating and polymer matrix systems enable the customization of release profiles. Extended-release forms reduce dosing frequency and side effects, providing significant advantages over conventional immediate-release drugs.
  • Regulatory support and increasing demand for once-daily dosing regimens continue to reinforce the leadership of extended-release forms in the modified drug delivery systems industry.

Modified Release Formulations Market Analysis By Release Mechanism

Matrix Tablets Lead Formulation Segment

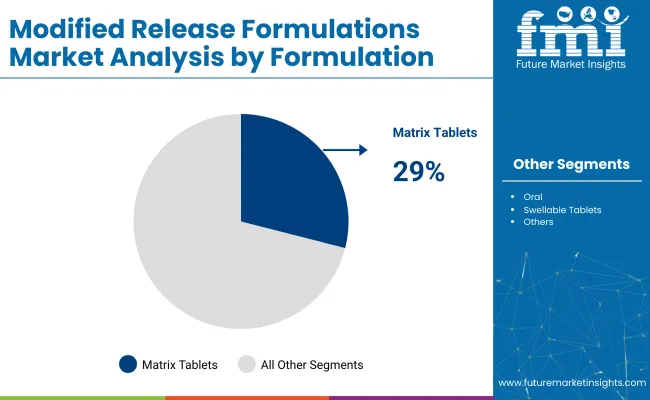
Matrix tablets are expected to dominate the formulation segment with a 29.0% share in 2025, due to their effectiveness in delivering controlled-release drugs.
  • Tablets consist of drug substances embedded in a matrix system, typically made of hydrophilic or hydrophobic polymers, which regulate the rate of drug diffusion. Their ease of manufacturing, low production cost, and compatibility with a broad range of active pharmaceutical ingredients (APIs) make them highly preferred in both generic and branded drug portfolios.
  • Matrix tablets enhance therapeutic compliance by enabling prolonged drug activity. Their adaptability to both oral and buccal delivery methods ensures widespread adoption across various therapeutic areas.

Modified Release Formulations Market Analysis By Formulation

Pharma & Biopharma Companies Dominate End User Segment

Pharmaceutical and biopharmaceutical companies are projected to lead the end-user segment with a 34.2% share in 2025, driven by the demand for lifecycle management of existing drugs and enhanced delivery platforms for new chemical entities (NCEs).

  • Companies invest significantly in research and development of modified release technologies to differentiate products, reduce dosing frequency, and enhance drug bioavailability. These formulations play a crucial role in extending patent life and improving market competitiveness.
  • Pharma and biopharma firms focus on innovation in patient-centric dosing, continuing to leverage modified release solutions to meet therapeutic goals while ensuring regulatory compliance and maintaining commercial viability.

Top Modified Release Formulations Market Dynamics

Advanced delivery systems and regulatory support are fueling modified release formulation growth. Smart polymers, controlled release technologies, and streamlined approvals are enhancing patient adherence, targeting chronic illnesses, and extending drug lifecycle value.

Technology Advancements Enabling Extended and Targeted Delivery

  • Modified release formulations are being enhanced with advanced drug delivery technologies. Matrix tablets, osmotic pumps, and film coatings now enable precise timing of drug release.
  • Smart polymers and hydrogels allow stimuli-responsive drug release triggered by changes in pH or temperature.
  • Nanoparticle-based systems are improving solubility and enabling targeted, site-specific drug delivery. These innovations optimize therapeutic efficacy, reduce side effects, and enhance patient adherence.

Regulatory & Market Pressures Favoring Patient-Centric Dosage Forms

  • Regulatory agencies are promoting patient-friendly dosing formats that ensure consistent therapeutic effects. Extended-release morphine and delayed-release antibiotics have been approved through streamlined FDA pathways like 505(b)(2).
  • Lower dosing frequency is increasingly favored to enhance compliance, particularly for geriatric and chronic patients.
  • Industry demand for the lifecycle extension of blockbuster drugs is driving the adoption of modified release formats.

Top Countries Manufacturing, Synthesizing, Distributing, and Generating Demand for Modified Release Formulations

Country CAGR (2025 to 2035)
United States 6.5%
Germany 4.2%
China 8.1%
Japan 3.9%
India 10.7%

India is expected to experience the highest growth rate in the Modified Release Formulations market, with a projected CAGR of 10.7%. This growth is driven by the expanding healthcare infrastructure, increasing healthcare access, and rising demand for advanced pharmaceutical solutions. China follows with an 8.1% CAGR, fueled by the increasing adoption of modern pharmaceutical technologies and the growth of the pharmaceutical sector.

In contrast, developed economies such as the United States (6.5%), Germany (4.2%), and Japan (3.9%) are expanding at steady but moderate rates. The United States remains a dominant player due to its advanced pharmaceutical industry and high demand for modified release medications. Germany focuses on innovation in drug delivery technologies, while Japan, with its aging population, continues to see steady demand for pharmaceutical advancements.

This report covers the in-depth analysis of 40+ Countries; Five top performing OECD countries highlighted below.

In-depth United States Modified Release Formulations Industry Analysis

The United States holds a formidable position in the global modified release formulations industry with a projected CAGR of 6.5% between 2025 and 2035.

  • The United States' mature pharmaceutical sector, supported by continuous R&D investments and a high prevalence of chronic diseases, drives the demand for advanced drug delivery systems. Key players are focusing on oral and transdermal systems to enable once-daily dosing and controlled therapeutic effects.
  • Regulatory clarity from the US FDA on bioequivalence standards facilitates streamlined product approvals. High patient compliance, favorable reimbursement policies, and widespread clinician acceptance provide unmatched scalability for modified release drug development. The nation’s biopharma ecosystem remains integral to industry growth.

Germany Modified Release Formulations Market Growth Analysis

Modified release formulations industry in Germany is forecast to grow steadily at 4.2% CAGR over the 2025 to 2035 period. Known for its precision in pharmaceutical engineering and stringent regulatory oversight, Germany fosters the development of high-quality modified release drugs particularly within the cardiovascular and central nervous system segments.

  • Increasing demand for geriatric-focused medications is driving the adoption of controlled release formats.
  • Leading domestic firms are advancing multiparticulate and osmotic pump technologies, supported by Germany's strong intellectual property regime and clinical trial infrastructure.
  • Reimbursement support under the statutory health insurance framework ensures patient accessibility. The combination of manufacturing excellence and public healthcare funding contributes to long-term stability.

China Modified Release Formulations Market Overview

China commands notable attention with a projected CAGR of 8.1% in the modified release formulations market between 2025 and 2035. This strong growth is propelled by the country’s expanding middle class, higher chronic disease burden, and upgraded national healthcare standards.

  • China's regulatory reforms and inclusion of novel drug delivery platforms in its essential drug list create a supportive environment for innovation.
  • Domestic pharmaceutical manufacturers are increasing the production of extended and delayed-release tablets to meet local demand and export targets.
  • Strategic partnerships with multinational corporations and the integration of digital health into drug adherence programs further strengthen China's position as a high-opportunity market for advanced formulations.

Japan Modified Release Formulations Market Advancements

Modified release formulations market in Japan grows at a moderate pace of 3.9% CAGR, shaped by its aging population and highly tech-enabled pharmaceutical landscape.

  • Japan leads in the adoption of precision delivery systems tailored for elderly patients, focusing on reduced dosing frequency and minimal side effects. Japanese pharmaceutical companies emphasize polymer science and matrix-based release formulations, particularly in oncology and metabolic disorders.
  • Regulatory pathways from PMDA facilitate timely approvals for modified release drugs, especially those designed for high-compliance populations.
  • The integration of robotics and AI into pharmaceutical R&D and production further positions Japan as a pioneer in the evolution of innovative and efficient drug delivery systems.

India’s Market Analysis and Growth in Drug Delivery Systems

India emerges as the fastest-growing industry in modified release formulations with a strong CAGR of 10.7% from 2025 to 2035.

  • India is experiencing growth in modified release drug formulations due to a confluence of factors, including the rising incidence of non-communicable diseases, improved healthcare access, and the dominance of generic drugs. Indian pharmaceutical companies are shifting toward value-added formulations like extended release tablets to capture both domestic and international demand.
  • Government incentives for R&D, along with evolving IP norms and regulatory simplification, foster innovation. India’s cost-effective manufacturing base and its role as a global generic drug supplier give it a strategic advantage in meeting global demand for modified release therapies across various therapeutic areas.

Leading Modified Release Formulations Market Suppliers

The modified release formulations industry is moderately consolidated, with a blend of dominant, key, and emerging players shaping its landscape. Dominant players such as Catalent, Recipharm, and Quotient Sciences lead the industry through proprietary drug delivery technologies, strong regulatory support, and strategic alliances with major pharmaceutical companies. Key players like Adragos Pharma, BioDuro, and Adare Pharma Solutions specialize in tailored release mechanisms, lifecycle management, and therapeutic diversification.

The emerging players including Zocalo Pharmaceutical, Societal CDMO, Syngene International, and Mayne Pharma are gaining traction by offering agile, cost-effective solutions for modified-release generics, specialty drugs, and mid-sized pharma clients.

Recent Modified Release Formulations Industry News

  • Starton Therapeutics and Bend Bioscience signed a development agreement on June 24, 2025, to co-develop a controlled-release oral formulation of STAR LLD (lenalidomide), with Bend leading formulation, scale-up, and manufacturing activities.
  • completed the acquisition of Catalent’s 50,000 sqft FDA-approved Somerset, New Jersey facility specializing in modified-release formulations, hot-melt extrusion, and controlled-substance handling. A new 2,500 sqft bioanalytical lab at the site is expected to open by Q3 2025.

Key Players

  • Catalent, Inc
  • Recipharm AB
  • Quotient Sciences
  • Adragos Pharma
  • BioDuro
  • Zocalo Pharmaceutical Ltd
  • Societal CDMO
  • Adare Pharma Solutions
  • Syngene International Limited
  • Mayne Pharma Group

Report Scope - Modified Release Formulations Market

Report Attributes Details
Market Size (2025) USD 282.1 billion
Projected Market Size (2035) USD 524.7 billion
CAGR (2025 to 2035) 6.4%
Base Year for Estimation 2024
Historical Period 2020 to 2024
Projections Period 2025 to 2035
Quantitative Units USD billion for value and million units for volume
Release Mechanisms Analyzed (Segment 1) Delayed-release Dosage, Gastro-resistant Dosage, Gastro-retention Dosage, Extended-release Dosage, Targeted-release Dosage, Pulsatile-release Dosage, Biphasic-release Dosage, Others
Formulations Analyzed (Segment 2) Oral, Swellable Tablets, Enteric-coated Tablets, Matrix Tablets, Coated Tablets, Bilayer Tablets/Multi-Particulate Systems, Others
Therapeutic Areas Analyzed (Segment 3) Chronic Pain, Gastroenterology, Cardiovascular, Diabetes, Others
End Users Analyzed (Segment 4) Pharmaceutical & Biopharmaceutical Companies, Innovator Pharma Companies, Specialty Pharma Companies, Generics Manufacturers, Biopharma Companies, CDMOs, Academic & Research Institutes
Countries Covered United States, Canada, Germany, United Kingdom, France, Italy, Spain, China, India, Japan, South Korea, Australia, Brazil, Mexico, Saudi Arabia, UAE, South Africa
Key Players influencing the Modified Release Formulations Market Catalent , Inc , Recipharm AB, Quotient Sciences, Adragos Pharma, BioDuro , Zocalo Pharmaceutical Ltd, Societal CDMO, Adare Pharma Solutions, Syngene International Limited, Mayne Pharma Group
Additional Attributes Dollar sales, share by release platform and end user, extended-release industry dominance in chronic care, growing adoption in diabetes and cardiovascular drugs, CDMO innovation for multiparticulate systems, regulatory pathways for MR generics and branded drugs

Key Segments Studied in Modified Release Formulations Industry

By Release Mechanism:

Delayed-release Dosage, Gastro-resistant Dosage, Gastro-retention Dosage, Extended-release Dosage, Targeted-release Dosage, Pulsatile-release Dosage, Biphasic-release Dosage, and Others.

By Formulations:

Oral, Swellable Tablets, Enteric-coated Tablets, Matrix Tablets, Coated Tablets, Bilayer Tablets/Multi-Particulate Systems, and Others.

By Therapeutic Areas:

Chronic Pain, Gastroenterology, Cardiovascular, Diabetes, and Others.

By End User:

Pharmaceutical & Biopharmaceutical Companies, Innovator Pharma Companies, Specialty Pharma Companies, Generics Manufacturers, Biopharma Companies, CDMOs, and Academic & Research Institutes.

By Region:

North America, Latin America, Europe, Asia-Pacific, and Middle East & Africa.

Table of Content

  1. Executive Summary
    • Global Market Outlook
    • Demand-side Trends
    • Supply-side Trends
    • Technology Roadmap Analysis
    • Analysis and Recommendations
  2. Market Overview
    • Market Coverage / Taxonomy
    • Market Definition / Scope / Limitations
  3. Market Background
    • Market Dynamics
      • Drivers
      • Restraints
      • Opportunity
      • Trends
    • Scenario Forecast
      • Demand in Optimistic Scenario
      • Demand in Likely Scenario
      • Demand in Conservative Scenario
    • Opportunity Map Analysis
    • Product Life Cycle Analysis
    • Supply Chain Analysis
      • Supply Side Participants and their Roles
        • Producers
        • Mid-Level Participants (Traders/ Agents/ Brokers)
        • Wholesalers and Distributors
      • Value Added and Value Created at Node in the Supply Chain
      • List of Raw Material Suppliers
      • List of Existing and Potential Buyer’s
    • Investment Feasibility Matrix
    • Value Chain Analysis
      • Profit Margin Analysis
      • Wholesalers and Distributors
      • Retailers
    • PESTLE and Porter’s Analysis
    • Regulatory Landscape
      • By Key Regions
      • By Key Countries
    • Regional Parent Market Outlook
    • Production and Consumption Statistics
    • Import and Export Statistics
  4. Global Market Analysis 2020 to 2024 and Forecast, 2025 to 2035
    • Historical Market Size Value (USD Billion) & Volume (Million units) Analysis, 2020 to 2024
    • Current and Future Market Size Value (USD Billion) & Volume (Million units) Projections, 2025 to 2035
      • Y-o-Y Growth Trend Analysis
      • Absolute $ Opportunity Analysis
  5. Global Market Pricing Analysis 2020 to 2024 and Forecast 2025 to 2035
  6. Global Market Analysis 2020 to 2024 and Forecast 2025 to 2035, By Release Mechanism
    • Introduction / Key Findings
    • Historical Market Size Value (USD Billion) & Volume (Million units) Analysis By Release Mechanism, 2020 to 2024
    • Current and Future Market Size Value (USD Billion) & Volume (Million units) Analysis and Forecast By Release Mechanism, 2025 to 2035
      • Delayed-release Dosage
      • Gastro-resistant Dosage
      • Gastro-retention Dosage
      • Extended-release Dosage
      • Targeted-release Dosage
      • Pulsatile-release Dosage
      • Biphasic-release Dosage
      • Others
    • Y-o-Y Growth Trend Analysis By Release Mechanism, 2020 to 2024
    • Absolute $ Opportunity Analysis By Release Mechanism, 2025 to 2035
  7. Global Market Analysis 2020 to 2024 and Forecast 2025 to 2035, By Formulations
    • Introduction / Key Findings
    • Historical Market Size Value (USD Billion) & Volume (Million units) Analysis By Formulations, 2020 to 2024
    • Current and Future Market Size Value (USD Billion) & Volume (Million units) Analysis and Forecast By Formulations, 2025 to 2035
      • Oral
      • Swellable Tablets
      • Enteric-coated Tablets
      • Matrix Tablets
      • Coated Tablets
      • Bilayer Tablets/Multi-Particulate Systems
      • Others
    • Y-o-Y Growth Trend Analysis By Formulations, 2020 to 2024
    • Absolute $ Opportunity Analysis By Formulations, 2025 to 2035
  8. Global Market Analysis 2020 to 2024 and Forecast 2025 to 2035, By Therapeutic Areas
    • Introduction / Key Findings
    • Historical Market Size Value (USD Billion) & Volume (Million units) Analysis By Therapeutic Areas, 2020 to 2024
    • Current and Future Market Size Value (USD Billion) & Volume (Million units) Analysis and Forecast By Therapeutic Areas, 2025 to 2035
      • Chronic Pain
      • Gastroenterology
      • Cardiovascular
      • Diabetes
      • Others
    • Y-o-Y Growth Trend Analysis By Therapeutic Areas, 2020 to 2024
    • Absolute $ Opportunity Analysis By Therapeutic Areas, 2025 to 2035
  9. Global Market Analysis 2020 to 2024 and Forecast 2025 to 2035, By End User
    • Introduction / Key Findings
    • Historical Market Size Value (USD Billion) & Volume (Million units) Analysis By End User, 2020 to 2024
    • Current and Future Market Size Value (USD Billion) & Volume (Million units) Analysis and Forecast By End User, 2025 to 2035
      • Pharmaceutical & Biopharmaceutical Companies
      • Innovator Pharma Companies
      • Specialty Pharma Companies
      • Generics Manufacturers
      • Biopharma Companies
      • CDMOs
      • Academic & Research Institutes
    • Y-o-Y Growth Trend Analysis By End User, 2020 to 2024
    • Absolute $ Opportunity Analysis By End User, 2025 to 2035
  10. Global Market Analysis 2020 to 2024 and Forecast 2025 to 2035, By Region
    • Introduction
    • Historical Market Size Value (USD Billion) & Volume (Million units) Analysis By Region, 2020 to 2024
    • Current Market Size Value (USD Billion) & Volume (Million units) Analysis and Forecast By Region, 2025 to 2035
      • North America
      • Latin America
      • Western Europe
      • Eastern Europe
      • East Asia
      • South Asia & Pacific
      • Middle East and Africa
    • Market Attractiveness Analysis By Region
  11. North America Market Analysis 2020 to 2024 and Forecast 2025 to 2035, By Country
    • Historical Market Size Value (USD Billion) & Volume (Million units) Trend Analysis By Market Taxonomy, 2020 to 2024
    • Market Size Value (USD Billion) & Volume (Million units) Forecast By Market Taxonomy, 2025 to 2035
      • By Country
        • USA
        • Canada
        • Maxico
      • By Release Mechanism
      • By Formulations
      • By Therapeutic Areas
      • By End User
    • Market Attractiveness Analysis
      • By Country
      • By Release Mechanism
      • By Formulations
      • By Therapeutic Areas
      • By End User
    • Key Takeaways
  12. Latin America Market Analysis 2020 to 2024 and Forecast 2025 to 2035, By Country
    • Historical Market Size Value (USD Billion) & Volume (Million units) Trend Analysis By Market Taxonomy, 2020 to 2024
    • Market Size Value (USD Billion) & Volume (Million units) Forecast By Market Taxonomy, 2025 to 2035
      • By Country
        • Brazil
        • Argentina
        • Rest of LATAM
      • By Release Mechanism
      • By Formulations
      • By Therapeutic Areas
      • By End User
    • Market Attractiveness Analysis
      • By Country
      • By Release Mechanism
      • By Formulations
      • By Therapeutic Areas
      • By End User
    • Key Takeaways
  13. Western Europe Market Analysis 2020 to 2024 and Forecast 2025 to 2035, By Country
    • Historical Market Size Value (USD Billion) & Volume (Million units) Trend Analysis By Market Taxonomy, 2020 to 2024
    • Market Size Value (USD Billion) & Volume (Million units) Forecast By Market Taxonomy, 2025 to 2035
      • By Country
        • Germany
        • Italy
        • France
        • UK
        • Spain
        • BENELUX
        • Nordic
        • Rest of W.Europe
      • By Release Mechanism
      • By Formulations
      • By Therapeutic Areas
      • By End User
    • Market Attractiveness Analysis
      • By Country
      • By Release Mechanism
      • By Formulations
      • By Therapeutic Areas
      • By End User
    • Key Takeaways
  14. Eastern Europe Market Analysis 2020 to 2024 and Forecast 2025 to 2035, By Country
    • Historical Market Size Value (USD Billion) & Volume (Million units) Trend Analysis By Market Taxonomy, 2020 to 2024
    • Market Size Value (USD Billion) & Volume (Million units) Forecast By Market Taxonomy, 2025 to 2035
      • By Country
        • Russia
        • Hungary
        • Poland
        • Balkan & Baltics
        • Rest of E. Europe
      • By Release Mechanism
      • By Formulations
      • By Therapeutic Areas
      • By End User
    • Market Attractiveness Analysis
      • By Country
      • By Release Mechanism
      • By Formulations
      • By Therapeutic Areas
      • By End User
    • Key Takeaways
  15. East Asia Market Analysis 2020 to 2024 and Forecast 2025 to 2035, By Country
    • Historical Market Size Value (USD Billion) & Volume (Million units) Trend Analysis By Market Taxonomy, 2020 to 2024
    • Market Size Value (USD Billion) & Volume (Million units) Forecast By Market Taxonomy, 2025 to 2035
      • By Country
        • China
        • Japan
        • South Korea
      • By Release Mechanism
      • By Formulations
      • By Therapeutic Areas
      • By End User
    • Market Attractiveness Analysis
      • By Country
      • By Release Mechanism
      • By Formulations
      • By Therapeutic Areas
      • By End User
    • Key Takeaways
  16. South Asia & Pacific Market Analysis 2020 to 2024 and Forecast 2025 to 2035, By Country
    • Historical Market Size Value (USD Billion) & Volume (Million units) Trend Analysis By Market Taxonomy, 2020 to 2024
    • Market Size Value (USD Billion) & Volume (Million units) Forecast By Market Taxonomy, 2025 to 2035
      • By Country
        • India
        • Australia & New Zealand
        • ASEAN
        • Rest of SAP
      • By Release Mechanism
      • By Formulations
      • By Therapeutic Areas
      • By End User
    • Market Attractiveness Analysis
      • By Country
      • By Release Mechanism
      • By Formulations
      • By Therapeutic Areas
      • By End User
    • Key Takeaways
  17. Middle East and Africa Market Analysis 2020 to 2024 and Forecast 2025 to 2035, By Country
    • Historical Market Size Value (USD Billion) & Volume (Million units) Trend Analysis By Market Taxonomy, 2020 to 2024
    • Market Size Value (USD Billion) & Volume (Million units) Forecast By Market Taxonomy, 2025 to 2035
      • By Country
        • GCC Countries
        • Northern Africa
        • South Africa
        • Turkiye
        • Rest of MEA
      • By Release Mechanism
      • By Formulations
      • By Therapeutic Areas
      • By End User
    • Market Attractiveness Analysis
      • By Country
      • By Release Mechanism
      • By Formulations
      • By Therapeutic Areas
      • By End User
    • Key Takeaways
  18. Key Countries Market Analysis
    • USA
      • Pricing Analysis
      • Market Share Analysis, 2024
        • By Release Mechanism
        • By Formulations
        • By Therapeutic Areas
        • By End User
    • Canada
      • Pricing Analysis
      • Market Share Analysis, 2024
        • By Release Mechanism
        • By Formulations
        • By Therapeutic Areas
        • By End User
    • Brazil
      • Pricing Analysis
      • Market Share Analysis, 2024
        • By Release Mechanism
        • By Formulations
        • By Therapeutic Areas
        • By End User
    • Mexico
      • Pricing Analysis
      • Market Share Analysis, 2024
        • By Release Mechanism
        • By Formulations
        • By Therapeutic Areas
        • By End User
    • Argentina
      • Pricing Analysis
      • Market Share Analysis, 2024
        • By Release Mechanism
        • By Formulations
        • By Therapeutic Areas
        • By End User
  19. Market Structure Analysis
    • Competition Dashboard
    • Competition Benchmarking
    • Market Share Analysis of Top Players
      • By Regional
      • By Release Mechanism
      • By Formulations
      • By Therapeutic Areas
      • By End User
  20. Competition Analysis
    • Competition Deep Dive
      • Catalent, Inc
        • Overview
        • Product Portfolio
        • Profitability by Market Segments (Product/Age /Sales Channel/Region)
        • Sales Footprint
        • Strategy Overview
          • Marketing Strategy
          • Product Strategy
          • Channel Strategy
      • Recipharm AB
        • Overview
        • Product Portfolio
        • Profitability by Market Segments (Product/Age /Sales Channel/Region)
        • Sales Footprint
        • Strategy Overview
          • Marketing Strategy
          • Product Strategy
          • Channel Strategy
      • Quotient Sciences
        • Overview
        • Product Portfolio
        • Profitability by Market Segments (Product/Age /Sales Channel/Region)
        • Sales Footprint
        • Strategy Overview
          • Marketing Strategy
          • Product Strategy
          • Channel Strategy
      • Adragos Pharma
        • Overview
        • Product Portfolio
        • Profitability by Market Segments (Product/Age /Sales Channel/Region)
        • Sales Footprint
        • Strategy Overview
          • Marketing Strategy
          • Product Strategy
          • Channel Strategy
      • BioDuro
        • Overview
        • Product Portfolio
        • Profitability by Market Segments (Product/Age /Sales Channel/Region)
        • Sales Footprint
        • Strategy Overview
          • Marketing Strategy
          • Product Strategy
          • Channel Strategy
      • Zocalo Pharmaceutical Ltd
        • Overview
        • Product Portfolio
        • Profitability by Market Segments (Product/Age /Sales Channel/Region)
        • Sales Footprint
        • Strategy Overview
          • Marketing Strategy
          • Product Strategy
          • Channel Strategy
      • Societal CDMO
        • Overview
        • Product Portfolio
        • Profitability by Market Segments (Product/Age /Sales Channel/Region)
        • Sales Footprint
        • Strategy Overview
          • Marketing Strategy
          • Product Strategy
          • Channel Strategy
      • Adare Pharma Solutions
        • Overview
        • Product Portfolio
        • Profitability by Market Segments (Product/Age /Sales Channel/Region)
        • Sales Footprint
        • Strategy Overview
          • Marketing Strategy
          • Product Strategy
          • Channel Strategy
      • Syngene International Limited
        • Overview
        • Product Portfolio
        • Profitability by Market Segments (Product/Age /Sales Channel/Region)
        • Sales Footprint
        • Strategy Overview
          • Marketing Strategy
          • Product Strategy
          • Channel Strategy
      • Mayne Pharma Group
        • Overview
        • Product Portfolio
        • Profitability by Market Segments (Product/Age /Sales Channel/Region)
        • Sales Footprint
        • Strategy Overview
          • Marketing Strategy
          • Product Strategy
          • Channel Strategy
  21. Assumptions & Acronyms Used
  22. Research Methodology

List of Tables

  • Table 1: Global Market Value (USD Billion) Forecast by Region, 2020 to 2035
  • Table 2: Global Market Volume (Million units) Forecast by Region, 2020 to 2035
  • Table 3: Global Market Value (USD Billion) Forecast by Release Mechanism, 2020 to 2035
  • Table 4: Global Market Volume (Million units) Forecast by Release Mechanism, 2020 to 2035
  • Table 5: Global Market Value (USD Billion) Forecast by Formulations, 2020 to 2035
  • Table 6: Global Market Volume (Million units) Forecast by Formulations, 2020 to 2035
  • Table 7: Global Market Value (USD Billion) Forecast by Therapeutic Areas, 2020 to 2035
  • Table 8: Global Market Volume (Million units) Forecast by Therapeutic Areas, 2020 to 2035
  • Table 9: Global Market Value (USD Billion) Forecast by End User, 2020 to 2035
  • Table 10: Global Market Volume (Million units) Forecast by End User, 2020 to 2035
  • Table 11: North America Market Value (USD Billion) Forecast by Country, 2020 to 2035
  • Table 12: North America Market Volume (Million units) Forecast by Country, 2020 to 2035
  • Table 13: North America Market Value (USD Billion) Forecast by Release Mechanism, 2020 to 2035
  • Table 14: North America Market Volume (Million units) Forecast by Release Mechanism, 2020 to 2035
  • Table 15: North America Market Value (USD Billion) Forecast by Formulations, 2020 to 2035
  • Table 16: North America Market Volume (Million units) Forecast by Formulations, 2020 to 2035
  • Table 17: North America Market Value (USD Billion) Forecast by Therapeutic Areas, 2020 to 2035
  • Table 18: North America Market Volume (Million units) Forecast by Therapeutic Areas, 2020 to 2035
  • Table 19: North America Market Value (USD Billion) Forecast by End User, 2020 to 2035
  • Table 20: North America Market Volume (Million units) Forecast by End User, 2020 to 2035
  • Table 21: Latin America Market Value (USD Billion) Forecast by Country, 2020 to 2035
  • Table 22: Latin America Market Volume (Million units) Forecast by Country, 2020 to 2035
  • Table 23: Latin America Market Value (USD Billion) Forecast by Release Mechanism, 2020 to 2035
  • Table 24: Latin America Market Volume (Million units) Forecast by Release Mechanism, 2020 to 2035
  • Table 25: Latin America Market Value (USD Billion) Forecast by Formulations, 2020 to 2035
  • Table 26: Latin America Market Volume (Million units) Forecast by Formulations, 2020 to 2035
  • Table 27: Latin America Market Value (USD Billion) Forecast by Therapeutic Areas, 2020 to 2035
  • Table 28: Latin America Market Volume (Million units) Forecast by Therapeutic Areas, 2020 to 2035
  • Table 29: Latin America Market Value (USD Billion) Forecast by End User, 2020 to 2035
  • Table 30: Latin America Market Volume (Million units) Forecast by End User, 2020 to 2035
  • Table 31: Western Europe Market Value (USD Billion) Forecast by Country, 2020 to 2035
  • Table 32: Western Europe Market Volume (Million units) Forecast by Country, 2020 to 2035
  • Table 33: Western Europe Market Value (USD Billion) Forecast by Release Mechanism, 2020 to 2035
  • Table 34: Western Europe Market Volume (Million units) Forecast by Release Mechanism, 2020 to 2035
  • Table 35: Western Europe Market Value (USD Billion) Forecast by Formulations, 2020 to 2035
  • Table 36: Western Europe Market Volume (Million units) Forecast by Formulations, 2020 to 2035
  • Table 37: Western Europe Market Value (USD Billion) Forecast by Therapeutic Areas, 2020 to 2035
  • Table 38: Western Europe Market Volume (Million units) Forecast by Therapeutic Areas, 2020 to 2035
  • Table 39: Western Europe Market Value (USD Billion) Forecast by End User, 2020 to 2035
  • Table 40: Western Europe Market Volume (Million units) Forecast by End User, 2020 to 2035
  • Table 41: Eastern Europe Market Value (USD Billion) Forecast by Country, 2020 to 2035
  • Table 42: Eastern Europe Market Volume (Million units) Forecast by Country, 2020 to 2035
  • Table 43: Eastern Europe Market Value (USD Billion) Forecast by Release Mechanism, 2020 to 2035
  • Table 44: Eastern Europe Market Volume (Million units) Forecast by Release Mechanism, 2020 to 2035
  • Table 45: Eastern Europe Market Value (USD Billion) Forecast by Formulations, 2020 to 2035
  • Table 46: Eastern Europe Market Volume (Million units) Forecast by Formulations, 2020 to 2035
  • Table 47: Eastern Europe Market Value (USD Billion) Forecast by Therapeutic Areas, 2020 to 2035
  • Table 48: Eastern Europe Market Volume (Million units) Forecast by Therapeutic Areas, 2020 to 2035
  • Table 49: Eastern Europe Market Value (USD Billion) Forecast by End User, 2020 to 2035
  • Table 50: Eastern Europe Market Volume (Million units) Forecast by End User, 2020 to 2035
  • Table 51: East Asia Market Value (USD Billion) Forecast by Country, 2020 to 2035
  • Table 52: East Asia Market Volume (Million units) Forecast by Country, 2020 to 2035
  • Table 53: East Asia Market Value (USD Billion) Forecast by Release Mechanism, 2020 to 2035
  • Table 54: East Asia Market Volume (Million units) Forecast by Release Mechanism, 2020 to 2035
  • Table 55: East Asia Market Value (USD Billion) Forecast by Formulations, 2020 to 2035
  • Table 56: East Asia Market Volume (Million units) Forecast by Formulations, 2020 to 2035
  • Table 57: East Asia Market Value (USD Billion) Forecast by Therapeutic Areas, 2020 to 2035
  • Table 58: East Asia Market Volume (Million units) Forecast by Therapeutic Areas, 2020 to 2035
  • Table 59: East Asia Market Value (USD Billion) Forecast by End User, 2020 to 2035
  • Table 60: East Asia Market Volume (Million units) Forecast by End User, 2020 to 2035
  • Table 61: South Asia & Pacific Market Value (USD Billion) Forecast by Country, 2020 to 2035
  • Table 62: South Asia & Pacific Market Volume (Million units) Forecast by Country, 2020 to 2035
  • Table 63: South Asia & Pacific Market Value (USD Billion) Forecast by Release Mechanism, 2020 to 2035
  • Table 64: South Asia & Pacific Market Volume (Million units) Forecast by Release Mechanism, 2020 to 2035
  • Table 65: South Asia & Pacific Market Value (USD Billion) Forecast by Formulations, 2020 to 2035
  • Table 66: South Asia & Pacific Market Volume (Million units) Forecast by Formulations, 2020 to 2035
  • Table 67: South Asia & Pacific Market Value (USD Billion) Forecast by Therapeutic Areas, 2020 to 2035
  • Table 68: South Asia & Pacific Market Volume (Million units) Forecast by Therapeutic Areas, 2020 to 2035
  • Table 69: South Asia & Pacific Market Value (USD Billion) Forecast by End User, 2020 to 2035
  • Table 70: South Asia & Pacific Market Volume (Million units) Forecast by End User, 2020 to 2035
  • Table 71: Middle East and Africa Market Value (USD Billion) Forecast by Country, 2020 to 2035
  • Table 72: Middle East and Africa Market Volume (Million units) Forecast by Country, 2020 to 2035
  • Table 73: Middle East and Africa Market Value (USD Billion) Forecast by Release Mechanism, 2020 to 2035
  • Table 74: Middle East and Africa Market Volume (Million units) Forecast by Release Mechanism, 2020 to 2035
  • Table 75: Middle East and Africa Market Value (USD Billion) Forecast by Formulations, 2020 to 2035
  • Table 76: Middle East and Africa Market Volume (Million units) Forecast by Formulations, 2020 to 2035
  • Table 77: Middle East and Africa Market Value (USD Billion) Forecast by Therapeutic Areas, 2020 to 2035
  • Table 78: Middle East and Africa Market Volume (Million units) Forecast by Therapeutic Areas, 2020 to 2035
  • Table 79: Middle East and Africa Market Value (USD Billion) Forecast by End User, 2020 to 2035
  • Table 80: Middle East and Africa Market Volume (Million units) Forecast by End User, 2020 to 2035

List of Figures

  • Figure 1: Global Market Volume (Million units) Forecast 2020 to 2035
  • Figure 2: Global Market Pricing Analysis
  • Figure 3: Global Market Value (USD Billion) Forecast 2020 to 2035
  • Figure 4: Global Market Value Share and BPS Analysis by Release Mechanism, 2025 and 2035
  • Figure 5: Global Market Y-o-Y Growth Comparison by Release Mechanism, 2025 to 2035
  • Figure 6: Global Market Attractiveness Analysis by Release Mechanism
  • Figure 7: Global Market Value Share and BPS Analysis by Formulations, 2025 and 2035
  • Figure 8: Global Market Y-o-Y Growth Comparison by Formulations, 2025 to 2035
  • Figure 9: Global Market Attractiveness Analysis by Formulations
  • Figure 10: Global Market Value Share and BPS Analysis by Therapeutic Areas, 2025 and 2035
  • Figure 11: Global Market Y-o-Y Growth Comparison by Therapeutic Areas, 2025 to 2035
  • Figure 12: Global Market Attractiveness Analysis by Therapeutic Areas
  • Figure 13: Global Market Value Share and BPS Analysis by End User, 2025 and 2035
  • Figure 14: Global Market Y-o-Y Growth Comparison by End User, 2025 to 2035
  • Figure 15: Global Market Attractiveness Analysis by End User
  • Figure 16: Global Market Value (USD Billion) Share and BPS Analysis by Region, 2025 and 2035
  • Figure 17: Global Market Y-o-Y Growth Comparison by Region, 2025 to 2035
  • Figure 18: Global Market Attractiveness Analysis by Region
  • Figure 19: North America Market Incremental $ Opportunity, 2025 to 2035
  • Figure 20: Latin America Market Incremental $ Opportunity, 2025 to 2035
  • Figure 21: Western Europe Market Incremental $ Opportunity, 2025 to 2035
  • Figure 22: Eastern Europe Market Incremental $ Opportunity, 2025 to 2035
  • Figure 23: East Asia Market Incremental $ Opportunity, 2025 to 2035
  • Figure 24: South Asia & Pacific Market Incremental $ Opportunity, 2025 to 2035
  • Figure 25: Middle East and Africa Market Incremental $ Opportunity, 2025 to 2035
  • Figure 26: North America Market Value Share and BPS Analysis by Country, 2025 and 2035
  • Figure 27: North America Market Value Share and BPS Analysis by Release Mechanism, 2025 and 2035
  • Figure 28: North America Market Y-o-Y Growth Comparison by Release Mechanism, 2025 to 2035
  • Figure 29: North America Market Attractiveness Analysis by Release Mechanism
  • Figure 30: North America Market Value Share and BPS Analysis by Formulations, 2025 and 2035
  • Figure 31: North America Market Y-o-Y Growth Comparison by Formulations, 2025 to 2035
  • Figure 32: North America Market Attractiveness Analysis by Formulations
  • Figure 33: North America Market Value Share and BPS Analysis by Therapeutic Areas, 2025 and 2035
  • Figure 34: North America Market Y-o-Y Growth Comparison by Therapeutic Areas, 2025 to 2035
  • Figure 35: North America Market Attractiveness Analysis by Therapeutic Areas
  • Figure 36: North America Market Value Share and BPS Analysis by End User, 2025 and 2035
  • Figure 37: North America Market Y-o-Y Growth Comparison by End User, 2025 to 2035
  • Figure 38: North America Market Attractiveness Analysis by End User
  • Figure 39: Latin America Market Value Share and BPS Analysis by Country, 2025 and 2035
  • Figure 40: Latin America Market Value Share and BPS Analysis by Release Mechanism, 2025 and 2035
  • Figure 41: Latin America Market Y-o-Y Growth Comparison by Release Mechanism, 2025 to 2035
  • Figure 42: Latin America Market Attractiveness Analysis by Release Mechanism
  • Figure 43: Latin America Market Value Share and BPS Analysis by Formulations, 2025 and 2035
  • Figure 44: Latin America Market Y-o-Y Growth Comparison by Formulations, 2025 to 2035
  • Figure 45: Latin America Market Attractiveness Analysis by Formulations
  • Figure 46: Latin America Market Value Share and BPS Analysis by Therapeutic Areas, 2025 and 2035
  • Figure 47: Latin America Market Y-o-Y Growth Comparison by Therapeutic Areas, 2025 to 2035
  • Figure 48: Latin America Market Attractiveness Analysis by Therapeutic Areas
  • Figure 49: Latin America Market Value Share and BPS Analysis by End User, 2025 and 2035
  • Figure 50: Latin America Market Y-o-Y Growth Comparison by End User, 2025 to 2035
  • Figure 51: Latin America Market Attractiveness Analysis by End User
  • Figure 52: Western Europe Market Value Share and BPS Analysis by Country, 2025 and 2035
  • Figure 53: Western Europe Market Value Share and BPS Analysis by Release Mechanism, 2025 and 2035
  • Figure 54: Western Europe Market Y-o-Y Growth Comparison by Release Mechanism, 2025 to 2035
  • Figure 55: Western Europe Market Attractiveness Analysis by Release Mechanism
  • Figure 56: Western Europe Market Value Share and BPS Analysis by Formulations, 2025 and 2035
  • Figure 57: Western Europe Market Y-o-Y Growth Comparison by Formulations, 2025 to 2035
  • Figure 58: Western Europe Market Attractiveness Analysis by Formulations
  • Figure 59: Western Europe Market Value Share and BPS Analysis by Therapeutic Areas, 2025 and 2035
  • Figure 60: Western Europe Market Y-o-Y Growth Comparison by Therapeutic Areas, 2025 to 2035
  • Figure 61: Western Europe Market Attractiveness Analysis by Therapeutic Areas
  • Figure 62: Western Europe Market Value Share and BPS Analysis by End User, 2025 and 2035
  • Figure 63: Western Europe Market Y-o-Y Growth Comparison by End User, 2025 to 2035
  • Figure 64: Western Europe Market Attractiveness Analysis by End User
  • Figure 65: Eastern Europe Market Value Share and BPS Analysis by Country, 2025 and 2035
  • Figure 66: Eastern Europe Market Value Share and BPS Analysis by Release Mechanism, 2025 and 2035
  • Figure 67: Eastern Europe Market Y-o-Y Growth Comparison by Release Mechanism, 2025 to 2035
  • Figure 68: Eastern Europe Market Attractiveness Analysis by Release Mechanism
  • Figure 69: Eastern Europe Market Value Share and BPS Analysis by Formulations, 2025 and 2035
  • Figure 70: Eastern Europe Market Y-o-Y Growth Comparison by Formulations, 2025 to 2035
  • Figure 71: Eastern Europe Market Attractiveness Analysis by Formulations
  • Figure 72: Eastern Europe Market Value Share and BPS Analysis by Therapeutic Areas, 2025 and 2035
  • Figure 73: Eastern Europe Market Y-o-Y Growth Comparison by Therapeutic Areas, 2025 to 2035
  • Figure 74: Eastern Europe Market Attractiveness Analysis by Therapeutic Areas
  • Figure 75: Eastern Europe Market Value Share and BPS Analysis by End User, 2025 and 2035
  • Figure 76: Eastern Europe Market Y-o-Y Growth Comparison by End User, 2025 to 2035
  • Figure 77: Eastern Europe Market Attractiveness Analysis by End User
  • Figure 78: East Asia Market Value Share and BPS Analysis by Country, 2025 and 2035
  • Figure 79: East Asia Market Value Share and BPS Analysis by Release Mechanism, 2025 and 2035
  • Figure 80: East Asia Market Y-o-Y Growth Comparison by Release Mechanism, 2025 to 2035
  • Figure 81: East Asia Market Attractiveness Analysis by Release Mechanism
  • Figure 82: East Asia Market Value Share and BPS Analysis by Formulations, 2025 and 2035
  • Figure 83: East Asia Market Y-o-Y Growth Comparison by Formulations, 2025 to 2035
  • Figure 84: East Asia Market Attractiveness Analysis by Formulations
  • Figure 85: East Asia Market Value Share and BPS Analysis by Therapeutic Areas, 2025 and 2035
  • Figure 86: East Asia Market Y-o-Y Growth Comparison by Therapeutic Areas, 2025 to 2035
  • Figure 87: East Asia Market Attractiveness Analysis by Therapeutic Areas
  • Figure 88: East Asia Market Value Share and BPS Analysis by End User, 2025 and 2035
  • Figure 89: East Asia Market Y-o-Y Growth Comparison by End User, 2025 to 2035
  • Figure 90: East Asia Market Attractiveness Analysis by End User
  • Figure 91: South Asia & Pacific Market Value Share and BPS Analysis by Country, 2025 and 2035
  • Figure 92: South Asia & Pacific Market Value Share and BPS Analysis by Release Mechanism, 2025 and 2035
  • Figure 93: South Asia & Pacific Market Y-o-Y Growth Comparison by Release Mechanism, 2025 to 2035
  • Figure 94: South Asia & Pacific Market Attractiveness Analysis by Release Mechanism
  • Figure 95: South Asia & Pacific Market Value Share and BPS Analysis by Formulations, 2025 and 2035
  • Figure 96: South Asia & Pacific Market Y-o-Y Growth Comparison by Formulations, 2025 to 2035
  • Figure 97: South Asia & Pacific Market Attractiveness Analysis by Formulations
  • Figure 98: South Asia & Pacific Market Value Share and BPS Analysis by Therapeutic Areas, 2025 and 2035
  • Figure 99: South Asia & Pacific Market Y-o-Y Growth Comparison by Therapeutic Areas, 2025 to 2035
  • Figure 100: South Asia & Pacific Market Attractiveness Analysis by Therapeutic Areas
  • Figure 101: South Asia & Pacific Market Value Share and BPS Analysis by End User, 2025 and 2035
  • Figure 102: South Asia & Pacific Market Y-o-Y Growth Comparison by End User, 2025 to 2035
  • Figure 103: South Asia & Pacific Market Attractiveness Analysis by End User
  • Figure 104: Middle East and Africa Market Value Share and BPS Analysis by Country, 2025 and 2035
  • Figure 105: Middle East and Africa Market Value Share and BPS Analysis by Release Mechanism, 2025 and 2035
  • Figure 106: Middle East and Africa Market Y-o-Y Growth Comparison by Release Mechanism, 2025 to 2035
  • Figure 107: Middle East and Africa Market Attractiveness Analysis by Release Mechanism
  • Figure 108: Middle East and Africa Market Value Share and BPS Analysis by Formulations, 2025 and 2035
  • Figure 109: Middle East and Africa Market Y-o-Y Growth Comparison by Formulations, 2025 to 2035
  • Figure 110: Middle East and Africa Market Attractiveness Analysis by Formulations
  • Figure 111: Middle East and Africa Market Value Share and BPS Analysis by Therapeutic Areas, 2025 and 2035
  • Figure 112: Middle East and Africa Market Y-o-Y Growth Comparison by Therapeutic Areas, 2025 to 2035
  • Figure 113: Middle East and Africa Market Attractiveness Analysis by Therapeutic Areas
  • Figure 114: Middle East and Africa Market Value Share and BPS Analysis by End User, 2025 and 2035
  • Figure 115: Middle East and Africa Market Y-o-Y Growth Comparison by End User, 2025 to 2035
  • Figure 116: Middle East and Africa Market Attractiveness Analysis by End User
  • Figure 117: Global Market - Tier Structure Analysis
  • Figure 118: Global Market - Company Share Analysis

Frequently Asked Questions

What is the estimated market value of modified release formulations in 2025?

The market is projected to reach USD 282.1 billion in 2025.

What is the forecasted size of the modified release formulations industry by 2035?

It is expected to grow to USD 524.7 billion by 2035.

What is the projected CAGR for the market between 2025 and 2035?

The industry is anticipated to expand at a CAGR of 6.4% during the forecast period.

Which release mechanism leads the industry in 2025?

Extended-release dosage forms are dominant with a 41.2% share in 2025.

Who is the leading company in the modified release formulations market?

Catalent, Inc. is the industry leader with an 11% global market share.

Explore Similar Insights

Future Market Insights

Modified Release Formulations Market