Niacinamide Serums Market Size and Share Forecast Outlook 2025 to 2035

The Niacinamide Serums Market is projected to reach a valuation of USD 3,051.20 Million in 2025 and expand significantly to USD 9,151.40 Million by 2035. This growth marks an increase of more than USD 6,100 Million over the period, representing nearly a 200% expansion. The market is anticipated to record a CAGR of 11.60% during 2025-2035, reflecting rising adoption of active-driven skincare and consistent integration into daily beauty routines.
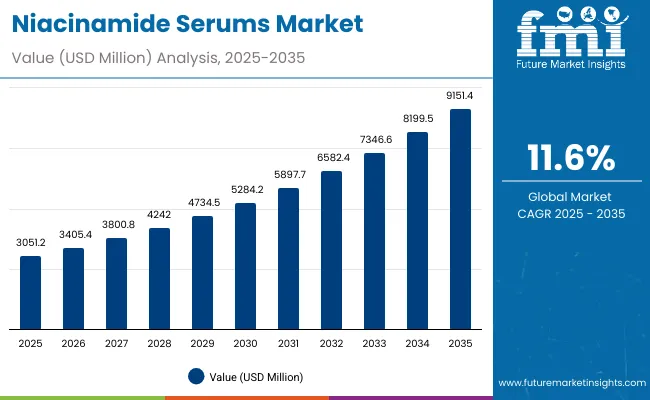
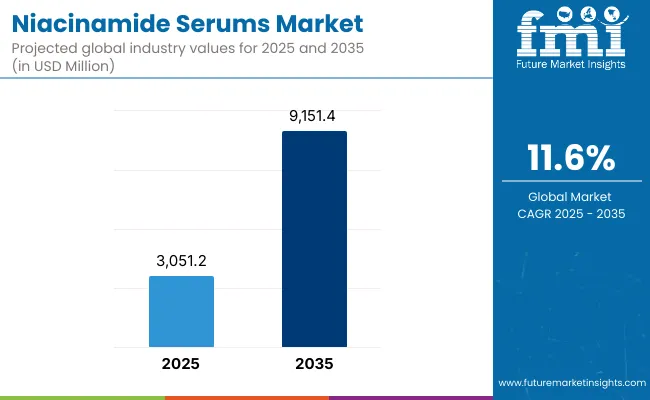
Niacinamide Serums Market Value Analysis

Quick Stats for Niacinamide Serums Market

  • Niacinamide Serums Market Value (2025): USD 3,051.20 Million
  • Niacinamide Serums Market Forecast Value (2035): USD 9,151.40 Million
  • Niacinamide Serums Market Forecast CAGR: 11.60%
  • Leading Segment in Niacinamide Serums Market in 2025: 6-10% Strength (51.00%)
  • Key Growth Regions in the Niacinamide Serums Market: North America, East Asia, Europe, South Asia & Pacific
  • Top Key Players in Niacinamide Serums Market: The Ordinary, Paula’s Choice, La Roche-Posay, CeraVe, The Inkey List, Olay, Eucerin, Skinceuticals, Vichy, COSRX

Niacinamide Serums Market

Niacinamide Serums Market Key Takeaways

Metric Value
Niacinamide Serums Market Estimated Value in (2025E) USD 3,051.20 Million
Niacinamide Serums Market Forecast Value in (2035F) USD 9,151.40 Million
Forecast CAGR (2025 to 2035) 11.60%

From 2025 to 2030, the market is expected to move upward from USD 3,051.20 Million to USD 5,284.20 Million, delivering USD 2,233.00 Million in additional value, which equals around 36% of the total decade growth. This period is likely to be defined by the mainstreaming of dermatologist-backed education, sustained uptake of mid-strength formulations, and increased credibility of niacinamide in addressing oil control and barrier health.

The 6-10% concentration segment, valued at USD 1,556.11 Million with a 51.00% share in 2025, is expected to lead adoption as performance-driven efficacy continues to influence purchase decisions.

The second half, spanning 2030 to 2035, is set to drive accelerated growth, adding nearly USD 3,867.20 Million, which equates to 64% of total decade gains. Market value is expected to climb from USD 5,284.20 Million to USD 9,151.40 Million during this phase, as cross-category bundling, e-commerce subscriptions, and strong Asian market penetration enhance uptake.

Functional leadership is projected to remain with tone-evening and brightening, valued at USD 1,464.58 Million with 48.00% share in 2025, while online channels are expected to strengthen their dominance through superior content and replenishment models.

From 2020 to 2024, steady momentum was observed as awareness around active ingredients and dermatologist-driven formulations expanded the category base. During this phase, credibility and efficacy were emphasized, with brands leveraging clinical storytelling and social commerce to reinforce trust.

By 2025, demand is projected to accelerate to USD 3,051.20 Million, and a structural shift is expected through the forecast horizon. Growth is projected to be driven by mid-strength serums, particularly 6-10% concentrations, which are forecast to dominate usage due to perceived efficacy and balanced tolerance.

By 2035, the market is anticipated to surpass USD 9,151.40 Million, with the revenue mix increasingly shaped by digital-first distribution models, subscription-led replenishment, and cross-category bundling. Competitive advantage is expected to move beyond basic formulation innovation toward ecosystem strength, dermatologist partnerships, and oMillioni-channel strategies.

Established leaders are expected to adapt by scaling refillable formats, strengthening clinical validation, and tailoring products to sensitive-skin users. Digital-native entrants are anticipated to disrupt by integrating AI-driven personalization, social commerce campaigns, and community-based engagement, accelerating adoption across younger demographics.

Why the Niacinamide Serums Market is growing?

Growth in the Niacinamide Serums Market is being fueled by rising consumer awareness of science-backed skincare and dermatologist-endorsed formulations. Increasing preference for active ingredients with proven multifunctional benefits has positioned niacinamide as a trusted choice for concerns such as tone evening, oil control, and barrier support.

Mid-strength formulations in the 6-10% range are being favored for their balance of efficacy and tolerance, leading adoption across global markets. Expansion of e-commerce platforms has enabled broader reach, supported by digital education, influencer advocacy, and subscription-led replenishment models.

Demand is also being amplified by younger demographics seeking preventive solutions and sensitive-skin users drawn to fragrance-free, vegan, and dermatologist-tested claims. Regional growth is being accelerated by strong uptake in Asia, particularly China and India, where double-digit CAGRs are projected. Future gains are expected to be reinforced by innovations in texture, microbiome-friendly formulations, and clean-label positioning, sustaining long-term category momentum.

Segmental Analysis

The Niacinamide Serums Market is segmented across strength, function, and format, each reflecting distinct consumer priorities and usage patterns. Strength-based segmentation highlights concentration levels that shape efficacy perception and tolerance among different skin types. Function-based categories are determined by key benefits such as tone-evening and barrier support, driving adoption across consumer demographics.

Format segmentation further illustrates evolving preferences, with texture and absorption properties guiding purchase decisions across e-commerce and pharmacy-led channels. Together, these segments provide a comprehensive view of how the market is structured and where future opportunities are expected to unfold.

Deeper insights into leading sub-segments indicate that efficacy-driven concentrations, brightening outcomes, and water-based textures are expected to retain dominance while adapting to regional preferences and evolving clean-label demands.
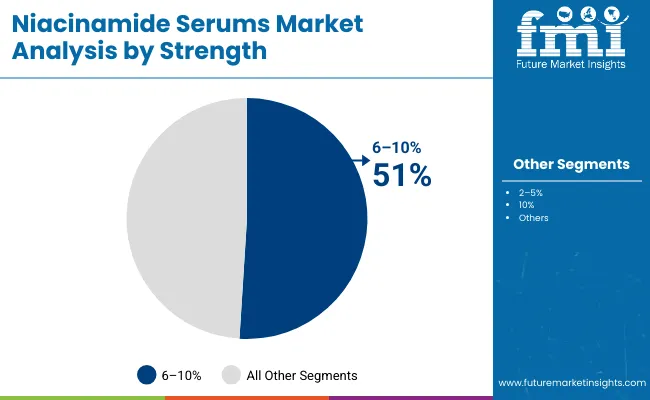
Insights into the Strength Segment with 6-10% Leading in Market Share

Niacinamide Serums Market By Strength

Segment Market Value Share, 2025
6-10% 51%
Others 49.0%

The 6-10% strength segment is expected to dominate with a 51% value share in 2025, equivalent to USD 1,556.11 Million. This concentration is favored for its strong balance of efficacy and skin tolerance, making it widely accepted across diverse consumer bases. Growing dermatologist recommendations and clinical backing are expected to reinforce its adoption, particularly among performance-driven users.

Entry-level concentrations are expected to attract sensitive-skin consumers, but mid-strength products are projected to sustain leadership by delivering visible results within short usage cycles. Over time, broader education on active tolerance is expected to further consolidate the dominance of this category.
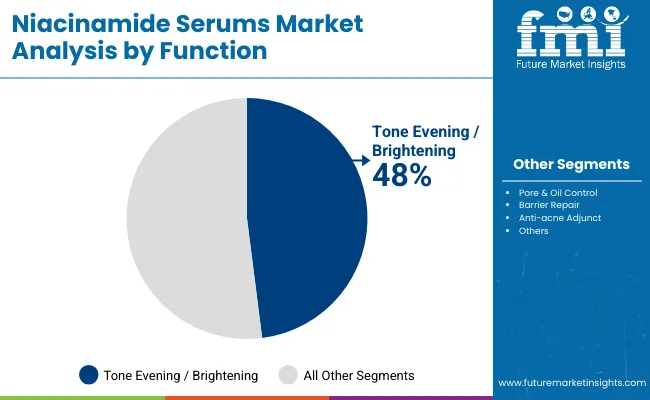
Insights into the Function Segment with Tone-evening/Brightening Dominating

Niacinamide Serums Market By Function

Segment Market Value Share, 2025
Tone evening/brightening 48%
Others 52.0%

Tone-evening and brightening functions are anticipated to lead with a 48% share in 2025, representing USD 1,464.58 Million in value. This function appeals strongly to consumers seeking uniformity and clarity in skin tone, making it the most recognized benefit of niacinamide serums. Regional demand is expected to be especially high in Asia, where hyperpigmentation and uneven tone concerns drive adoption.

Continuous integration of niacinamide into daily routines alongside sunscreens and moisturizers is projected to expand usage frequency. Growth will also be supported by rising consumer confidence in active-led solutions backed by visible outcomes and scientific validation. As routines become more targeted, tone-evening claims are expected to remain central to brand messaging and category expansion.
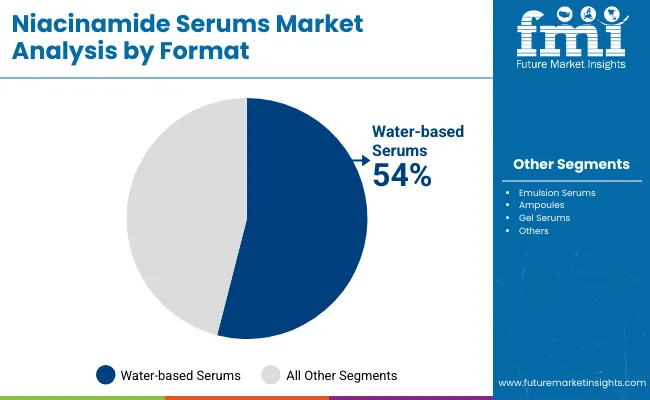
Insights into the Format Segment with Water-based Serums Leading

Niacinamide Serums Market By Format

Segment Market Value Share, 2025
Water-based serums 54%
Others 46.0%

Water-based serums are expected to command the largest share, with 54% in 2025, valued at USD 1,647.65 Million. Their lightweight texture and ease of layering within multi-step routines make them highly preferred by both new and experienced users. Faster absorption and compatibility with diverse skin types have positioned this format as the most versatile choice.

Digital-led awareness campaigns and influencer advocacy are expected to accelerate penetration across e-commerce channels. Broader appeal is also being reinforced by the ability of water-based serums to combine seamlessly with complementary actives, enhancing their perceived effectiveness. As consumers prioritize efficacy, convenience, and layering flexibility, water-based serums are projected to remain the leading choice throughout the forecast horizon.

What are the Drivers, Restraints, and Key Trends of the Niacinamide Serums Market?

The Niacinamide Serums Market is being shaped by a mix of supportive and limiting dynamics, as increasing reliance on clinically validated actives is contrasted by formulation challenges, regulatory scrutiny, and shifting consumer expectations for authenticity and sustainability.

Clinical-backed Efficacy Elevating Consumer Trust

Market momentum is being accelerated by the growing weight placed on clinical validation, peer-reviewed trials, and dermatologist endorsement. Consumers are increasingly influenced by verifiable outcomes rather than generic marketing claims, which has elevated niacinamide to a status of scientific credibility in skincare.

As long-term efficacy data continue to be released and peer channels such as dermatology forums reinforce confidence, adoption rates are expected to rise further. This dynamic is positioning niacinamide not only as a treatment ingredient but also as a preventive solution, embedding it into broader daily routines.

Digital Commerce Ecosystems Redefining Growth Pathways

The structural expansion of digital commerce ecosystems is reshaping distribution and consumer interaction models. Algorithms are tailoring product discovery, while subscription-led replenishment is embedding serums into habitual purchase cycles. Social commerce is introducing dermatologist-led live sessions and consumer testimonials, turning product education into interactive experiences.

This shift is expected to compress decision-making timelines and accelerate repeat purchase rates, while simultaneously creating opportunities for smaller entrants to bypass traditional retail hierarchies. The trend indicates that digital-first ecosystems will be as critical as formulation innovations in defining competitive success.
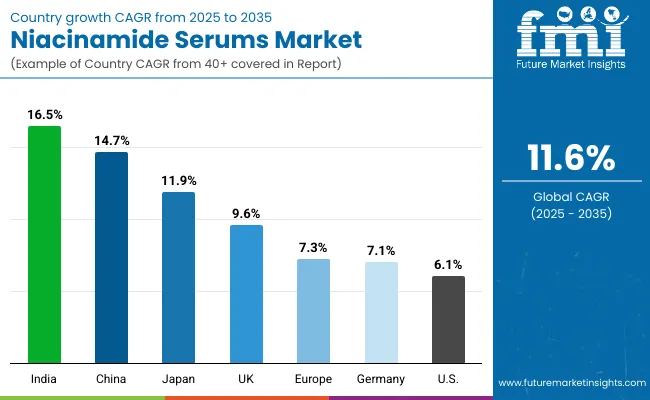
Analysis of Niacinamide Serums Market By Key Countries

Niacinamide Serums Market Country Wise Analysis

Country CAGR
China 14.7%
USA 6.1%
India 16.5%
UK 9.6%
Germany 7.1%
Japan 11.9%

The global Niacinamide Serums Market demonstrates significant variation in adoption patterns across countries, shaped by consumer preferences, dermatological practices, and digital distribution maturity. Distinct growth dynamics are anticipated, with emerging economies leading expansion through younger demographics and digital-first strategies, while developed regions are expected to maintain steady momentum through premiumization and established retail ecosystems.

India is projected to record the fastest growth with a CAGR of 16.5% from 2025 to 2035. Expansion in this market is expected to be propelled by rising middle-class spending power, strong uptake of masstige offerings, and increasing preference for multifunctional skincare solutions. Localized digital platforms and marketplace-led penetration are anticipated to reinforce this momentum. China, with a CAGR of 14.7%, is expected to benefit from the heightened demand for brightening and tone-evening solutions, with cross-category bundling and KOL-driven digital engagement accelerating acceptance.

Japan is forecast to advance at 11.9% CAGR, supported by sensitive-skin framing and trusted pharmacy distribution models. The UK and Germany, at 9.6% and 7.1% respectively, are expected to maintain robust adoption as clean-label, fragrance-free, and dermatologist-tested claims align with consumer priorities. The USA is projected to expand at a moderate 6.1% CAGR, reflecting market maturity, though growth is expected to be sustained through subscription-driven e-commerce and refillable packaging innovations. Collectively, these key countries illustrate a dual-track growth outlook, where Asia drives acceleration while Western markets consolidate value through premium credibility and channel diversification.
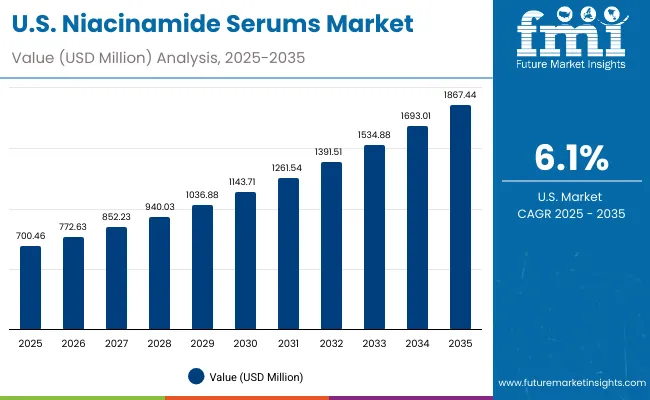
Sales Outlook for Niacinamide Serums Market in the United States

Usa Niacinamide Serums Market

Year USA Niacinamide Serums Market (USD Million)
2025 700.46
2026 772.63
2027 852.23
2028 940.03
2029 1036.88
2030 1143.71
2031 1261.54
2032 1391.51
2033 1534.88
2034 1693.01
2035 1867.44

The Niacinamide Serums Market in the United States is projected to grow at a CAGR of 11.6% from 2025 to 2035, expanding steadily on the back of rising demand for clinically validated skincare solutions. Growth will be reinforced by expanding consumer trust in dermatologist-endorsed formulations, alongside the scaling of e-commerce subscription models that embed serums into recurring skincare regimens.

The first half of the forecast window (2025 to 2030) is expected to witness a steady climb, reaching USD 1,143.71 million by 2030, with growth shaped by stronger adoption of mid-strength formulations and wider pharmacy availability. The second phase (2030 to 2035) is anticipated to accelerate further, adding over USD 700 million in incremental value. Market penetration is expected to deepen among teen and young adult users, supported by targeted influencer-driven campaigns and clean-label claims.

  • Mid-strength serums (6-10%) are projected to dominate USA usage due to perceived efficacy and tolerance balance.
  • E-commerce and subscription-led replenishment are anticipated to become primary growth enablers, while sensitive-skin and dermatologist-tested positioning will reinforce premiumization.

Growth and Expansion Outlook for Niacinamide Serums Market in the United Kingdom

The Niacinamide Serums Market in the UK is projected to grow at a CAGR of 9.6% between 2025 and 2035, reflecting strong momentum within premium skincare categories. Expansion is expected to be supported by rising adoption of fragrance-free, dermatologist-tested, and clean-label formulations that align with evolving consumer values.

Pharmacy-led distribution channels are anticipated to maintain trust-driven dominance, while e-commerce penetration is set to accelerate due to digital-first campaigns. Mid-strength serums are expected to attract repeat purchases as efficacy and tolerance balance become consumer priorities.

  • Clean-label and vegan claims are expected to gain traction, reinforcing consumer loyalty in premium skincare.
  • Retail pharmacies are projected to remain leading distribution partners, ensuring product credibility.
  • E-commerce and social commerce channels are anticipated to amplify growth through targeted consumer education.
  • Mid-strength formulations are forecast to sustain leadership, with increased adoption among sensitive-skin users.

Growth and Expansion Outlook for Niacinamide Serums Market in India

The Niacinamide Serums Market in India is forecast to expand at a CAGR of 16.5% from 2025 to 2035, making it the fastest-growing country in this category. Growth is expected to be anchored by rising middle-class spending power, strong masstige adoption, and digital-first purchasing behavior. Marketplace platforms are projected to drive wider accessibility, while younger demographics are expected to accelerate trial adoption. Increasing demand for multifunctional skincare is anticipated to reinforce niacinamide as a preferred active ingredient.

  • Masstige and affordable premium offerings are forecast to capture the broadest consumer base.
  • Digital marketplaces are expected to act as primary growth channels, enhancing reach across Tier-2 and Tier-3 cities.
  • Younger consumers are projected to lead category expansion, particularly in preventive skincare usage.
  • Dermatologist endorsement and influencer advocacy are anticipated to strengthen adoption across segments.

Sales Outlook for Niacinamide Serums Market in China

The Niacinamide Serums Market in China is anticipated to grow at a CAGR of 14.7% over the forecast horizon, supported by robust demand for brightening and tone-evening formulations. Social commerce ecosystems are projected to shape category expansion, with key opinion leaders (KOLs) and live-streaming platforms driving awareness and conversion. Premium positioning is expected to benefit from rising disposable income and preference for clinical claims, while localized innovation will further tailor demand.
  • Tone-evening and brightening functions are projected to dominate due to strong consumer focus on hyperpigmentation.
  • KOL-driven marketing and live-streaming campaigns are anticipated to accelerate conversion rates.
  • Premium offerings are expected to gain traction, supported by higher willingness to pay for clinically proven results.
  • Cross-category bundling with sunscreens and moisturizers is forecast to increase repeat purchase frequency.

In-depth Analysis of Niacinamide Serums Market in Germany

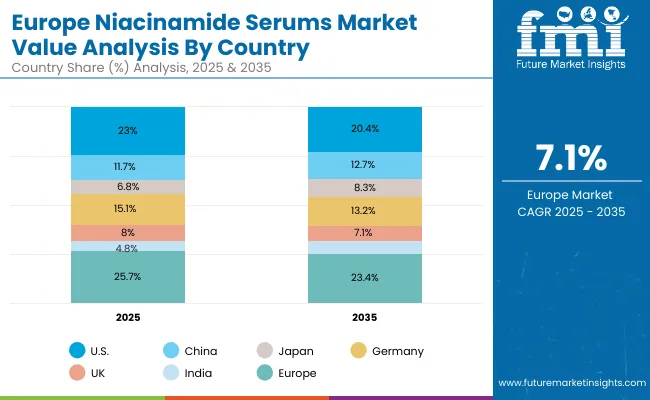
Europe Niacinamide Serums Market

Country 2025
USA 23.0%
China 11.7%
Japan 6.8%
Germany 15.1%
UK 8.0%
India 4.8%
Country 2035
USA 20.4%
China 12.7%
Japan 8.3%
Germany 13.2%
UK 7.1%
India 5.8%

The Niacinamide Serums Market in Germany is projected to expand at a CAGR of 7.1% from 2025 to 2035, reflecting steady adoption supported by consumer trust in pharmacy-driven retail. Growth is expected to be reinforced by dermatologist-tested and sensitive-skin claims, aligning with the country’s preference for safety-led skincare. Digital adoption is anticipated to expand gradually, complementing traditional retail distribution. Mid-strength formulations are expected to remain prominent due to balanced efficacy and tolerability.
  • Pharmacy and drugstore channels are projected to dominate, sustaining consumer trust.
  • Sensitive-skin and fragrance-free claims are expected to drive steady adoption.
  • E-commerce expansion is anticipated to complement retail presence, offering convenience-led growth.
  • Mid-strength formulations are forecast to retain leadership, supported by dermatological credibility and proven outcomes.

Growth Outlook for Niacinamide Serums Market in USA

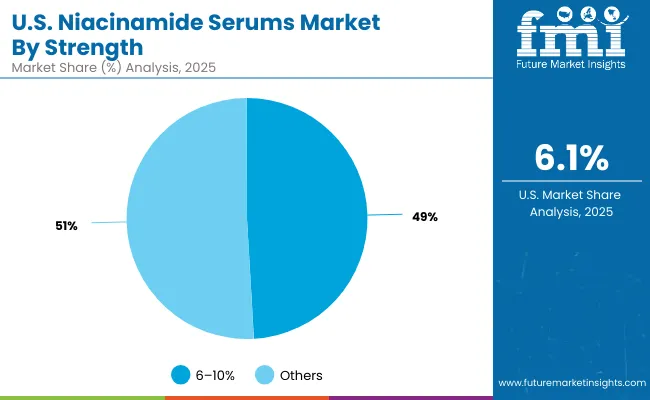
Usa Niacinamide Serums Market By Strength

Segment Market Value Share, 2025
6-10% 49%
Others 50.8%

The Niacinamide Serums Market in the United States is projected at USD 700.46 million in 2025. The “Others” category contributes 50.8% share, valued at USD 355.83 million, while the 6-10% concentration segment holds 49% share, worth USD 344.63 million. This marginal lead for lower and diversified concentrations reflects the broader consumer preference for accessible formulations, particularly among sensitive-skin users and early adopters. The strong presence of mid-strength serums highlights the importance of efficacy-led positioning, supported by dermatologist endorsements and visible results within short usage cycles.

Shifts in consumer awareness are expected to reinforce future demand for mid-strength serums, especially as education around active tolerance becomes widespread. At the same time, lower strengths are anticipated to act as an entry point for new consumers, driving market inclusivity. Competitive strategies are likely to focus on bundling niacinamide with complementary actives such as hyaluronic acid and ceramides to strengthen consumer trust and routine integration.
  • USA Niacinamide Serums Market projected at USD 700.46 million in 2025
  • Others segment leads with 50.8% share vs. 49% for 6-10% concentrations
  • Market dynamics shaped by tolerance-driven entry products and efficacy-led mid-strength offerings
  • Growth supported by dermatologist influence, cross-category bundling, and digital subscription platforms

Opportunity Analysis of China Niacinamide Serums Market

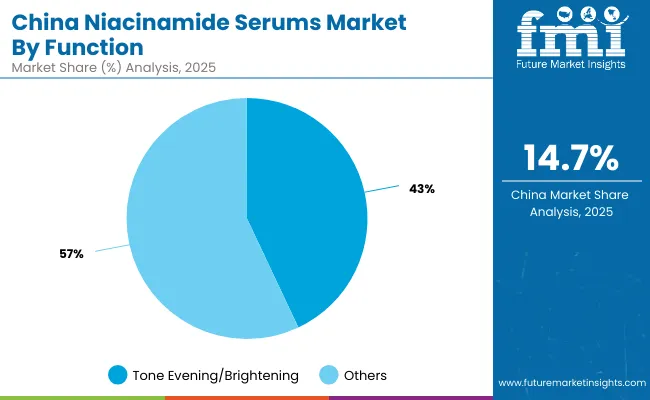
Chian Niacinamide Serums Market By Function

Segment Market Value Share, 2025
Tone evening/brightening 43%
Others 57.0%

The Niacinamide Serums Market in China is projected at USD 358.01 million in 2025. Within this, tone-evening and brightening functions are expected to account for 43% share, valued at USD 153.95 million, while other multifunctional uses hold the majority at 57% share, worth USD 204.07 million. This indicates that while brightening remains a key consumer driver, the category’s depth is being expanded by secondary benefits such as barrier repair, oil regulation, and acne support.

The prominence of brightening reflects cultural emphasis on even skin tone and radiance, which has long influenced beauty purchasing behavior. However, broader skincare goals are gaining attention, supported by increased consumer education and cross-category bundling strategies. Digital platforms and KOL-driven marketing are expected to strengthen functional diversification, creating room for expanded claims. As formulation sophistication increases, multifunctional serums are anticipated to outpace category averages, while tone-evening retains a stable leadership position in perception.
  • Market in China projected at USD 358.01 million in 2025
  • Tone-evening/brightening accounts for 43% share (USD 153.95 million)
  • Multifunctional serums dominate with 57% share, reflecting expanded consumer priorities
  • Growth reinforced by cultural emphasis on radiance and digital-led consumer education

Competitive Landscape of Niacinamide Serums Market

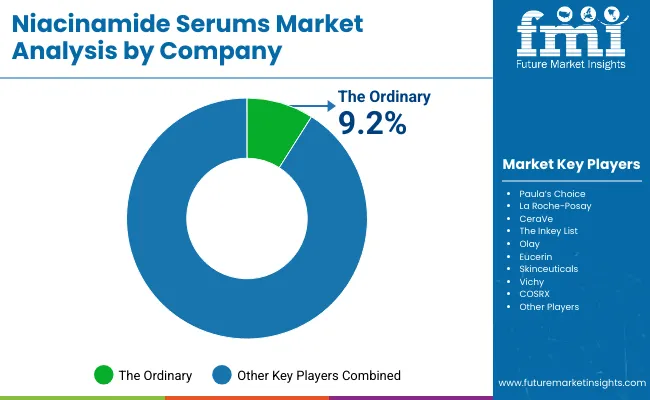
Niacinamide Serums Market By Company

Company Global Value Share 2025
The Ordinary 9.2%
Others 90.8%

The Niacinamide Serums Market is moderately fragmented, with established leaders, mid-sized skincare innovators, and niche-focused brands competing across varied consumer segments. Leading global brand The Ordinary is recognized as the dominant player, holding a 9.2% global market share in 2025, reflecting its strong positioning in affordable, science-backed formulations.

This leadership is reinforced by the brand’s minimalist approach, transparent ingredient disclosures, and broad digital reach, which have collectively created high consumer trust. Based on trajectory, The Ordinary’s share in 2024 is estimated at slightly above 9%, confirming its role as the top competitor in the global category.

Beyond The Ordinary, the market is shared by diversified brands such as Paula’s Choice, La Roche-Posay, CeraVe, Olay, The Inkey List, Eucerin, Skinceuticals, Vichy, and COSRX. These companies are not only correct representatives of this market but are also expected to shape the competitive dynamic with their differentiated claims, strong retail networks, and dermatologist endorsements. Mid-sized players are focusing on sensitive-skin narratives, texture innovation, and refillable packaging formats to strengthen consumer loyalty.

Competitive differentiation is shifting toward ecosystems built around clinical proof, subscription-led e-commerce, and cross-category bundling. Digital-first storytelling, interactive education through dermatologists, and clean-label transparency are expected to define leadership in the decade ahead. While fragmentation will persist, value capture will increasingly favor players that combine credibility with scalability, reinforcing the importance of dermatologist validation and oMillioni-channel presence.

Key Developments in Niacinamide Serums Market

  • In February 2025, Glow Recipe launched Watermelon Glow Niacinamide Dewy Serum Blush, introducing makeup-skincare hybrids that combine tinted serum formulas with niacinamide, hyaluronic acid, and plant extracts.
  • In January 2025, implementation efforts under the USA Modernization of Cosmetics Regulation Act (MoCRA) were advanced, requiring cosmetic makers to improve safety documentation, register facilities, and ensure clearer label disclosures.

Scope of the Report

Item Value
Market Value (2025E) USD 3,051.20 Million
Market Forecast Value (2035F) USD 9,151.40 Million
Forecast CAGR (2025 to 2035) 11.60%
Dominant Strength (2025) 6-10% share
Dominant Function (2025) Tone evening/brightening
Dominant Format (2025) Water-based serums
USA Market (2025 → 2035) USD 700.46 Million → USD 1,867.44 Million
Regions Covered North America; Europe; East Asia; South Asia & Pacific; Latin America; Middle East & Africa
Countries Covered USA; China; India; Japan; UK; Germany
Channels E-commerce; Pharmacies/Drugstores; Specialty Beauty Retail; Mass Retail
End Users Unisex; Teen/Young Adult; Sensitive-skin Users; Men’s Grooming
Key Companies Profiled The Ordinary; Paula’s Choice; La Roche-Posay; CeraVe; The Inkey List; Olay; Eucerin; Skinceuticals; Vichy; COSRX
Additional Attributes Evidence-backed claims; subscription e-commerce; sensitive-skin positioning; refillable/clean-label formats; dermatologist endorsements; regional localization

Key Segments

By Microbe System:

  • Lactobacillus lysates
  • Bifidobacterium ferments
  • Yeast/Saccharomyces ferments
  • Postbiotics

By Function:

  • Barrier strengthening
  • Soothing/sensitive-skin relief
  • Hydration & plumping
  • Redness control

By Mask Type:

  • Sheet masks
  • Cream masks
  • Sleeping masks
  • Wash-off masks

By Channel:

  • E-commerce
  • Pharmacies
  • Specialty beauty retail
  • Dermatology clinics

By Claim:

  • Hypoallergenic
  • Clean-label
  • Vegan
  • Fragrance-free

By Region:

  • North America
  • Latin America
  • Europe
  • East Asia
  • South Asia & Pacific
  • Middle East and Africa

Table of Content

  1. Executive Summary
    • Global Market Outlook
    • Demand-side Trends
    • Supply-side Trends
    • Technology Roadmap Analysis
    • Analysis and Recommendations
  2. Market Overview
    • Market Coverage / Taxonomy
    • Market Definition / Scope / Limitations
  3. Market Background
    • Market Dynamics
      • Drivers
      • Restraints
      • Opportunity
      • Trends
    • Scenario Forecast
      • Demand in Optimistic Scenario
      • Demand in Likely Scenario
      • Demand in Conservative Scenario
    • Opportunity Map Analysis
    • Product Life Cycle Analysis
    • Supply Chain Analysis
    • Investment Feasibility Matrix
    • Value Chain Analysis
    • PESTLE and Porter’s Analysis
    • Regulatory Landscape
    • Regional Parent Market Outlook
    • Production and Consumption Statistics
    • Import and Export Statistics
  4. Global Analysis 2020 to 2024 and Forecast, 2025 to 2035
    • Historical Market Size Value (USD Million) Analysis, 2020 to 2024
    • Current and Future Market Size Value (USD Million) Projections, 2025 to 2035
      • Y-o-Y Growth Trend Analysis
      • Absolute $ Opportunity Analysis
  5. Global Pricing Analysis 2020 to 2024 and Forecast 2025 to 2035
  6. Global Analysis 2020 to 2024 and Forecast 2025 to 2035, By Microbe System
    • Introduction / Key Findings
    • Historical Market Size Value (USD Million) Analysis By Microbe System, 2020 to 2024
    • Current and Future Market Size Value (USD Million) Analysis and Forecast By Microbe System, 2025 to 2035
      • Lactobacillus lysates
      • Bifidobacterium ferments
      • Yeast/Saccharomyces ferments
      • Postbiotics
    • Y-o-Y Growth Trend Analysis By Microbe System, 2020 to 2024
    • Absolute $ Opportunity Analysis By Microbe System, 2025 to 2035
  7. Global Analysis 2020 to 2024 and Forecast 2025 to 2035, By Function
    • Introduction / Key Findings
    • Historical Market Size Value (USD Million) Analysis By Function, 2020 to 2024
    • Current and Future Market Size Value (USD Million) Analysis and Forecast By Function, 2025 to 2035
      • Barrier strengthening
      • Soothing/sensitive-skin relief
      • Hydration & plumping
      • Redness control
    • Y-o-Y Growth Trend Analysis By Function, 2020 to 2024
    • Absolute $ Opportunity Analysis By Function, 2025 to 2035
  8. Global Analysis 2020 to 2024 and Forecast 2025 to 2035, By Mask Type
    • Introduction / Key Findings
    • Historical Market Size Value (USD Million) Analysis By Mask Type, 2020 to 2024
    • Current and Future Market Size Value (USD Million) Analysis and Forecast By Mask Type, 2025 to 2035
      • Sheet masks
      • Cream masks
      • Sleeping masks
      • Wash-off masks
    • Y-o-Y Growth Trend Analysis By Mask Type, 2020 to 2024
    • Absolute $ Opportunity Analysis By Mask Type, 2025 to 2035
  9. Global Analysis 2020 to 2024 and Forecast 2025 to 2035, By Channel
    • Introduction / Key Findings
    • Historical Market Size Value (USD Million) Analysis By Channel, 2020 to 2024
    • Current and Future Market Size Value (USD Million) Analysis and Forecast By Channel, 2025 to 2035
      • E-commerce
      • Pharmacies
      • Specialty beauty retail
      • Dermatology clinics
    • Y-o-Y Growth Trend Analysis By Channel, 2020 to 2024
    • Absolute $ Opportunity Analysis By Channel, 2025 to 2035
  10. Global Analysis 2020 to 2024 and Forecast 2025 to 2035, By Claim
    • Introduction / Key Findings
    • Historical Market Size Value (USD Million) Analysis By Claim, 2020 to 2024
    • Current and Future Market Size Value (USD Million) Analysis and Forecast By Claim, 2025 to 2035
      • Hypoallergenic
      • Clean-label
      • Vegan
      • Fragrance-free
    • Y-o-Y Growth Trend Analysis By Claim, 2020 to 2024
    • Absolute $ Opportunity Analysis By Claim, 2025 to 2035
  11. Global Analysis 2020 to 2024 and Forecast 2025 to 2035, By Region
    • Introduction
    • Historical Market Size Value (USD Million) Analysis By Region, 2020 to 2024
    • Current Market Size Value (USD Million) Analysis and Forecast By Region, 2025 to 2035
      • North America
      • Latin America
      • Europe
      • East Asia
      • South Asia & Pacific
      • Middle East and Africa
    • Market Attractiveness Analysis By Region
  12. North America Analysis 2020 to 2024 and Forecast 2025 to 2035, By Country
    • Historical Market Size Value (USD Million) Trend Analysis By Market Taxonomy, 2020 to 2024
    • Market Size Value (USD Million) Forecast By Market Taxonomy, 2025 to 2035
      • By Country
        • USA
        • Canada
      • By Microbe System
      • By Function
      • By Mask Type
      • By Channel
      • By Claim
    • Market Attractiveness Analysis
      • By Country
      • By Microbe System
      • By Function
      • By Mask Type
      • By Channel
      • By Claim
    • Key Takeaways
  13. Latin America Analysis 2020 to 2024 and Forecast 2025 to 2035, By Country
    • Historical Market Size Value (USD Million) Trend Analysis By Market Taxonomy, 2020 to 2024
    • Market Size Value (USD Million) Forecast By Market Taxonomy, 2025 to 2035
      • By Country
        • Brazil
        • Mexico
        • Colombia
        • Rest of Latin America
      • By Microbe System
      • By Function
      • By Mask Type
      • By Channel
      • By Claim
    • Market Attractiveness Analysis
      • By Country
      • By Microbe System
      • By Function
      • By Mask Type
      • By Channel
      • By Claim
    • Key Takeaways
  14. Europe Analysis 2020 to 2024 and Forecast 2025 to 2035, By Country
    • Historical Market Size Value (USD Million) Trend Analysis By Market Taxonomy, 2020 to 2024
    • Market Size Value (USD Million) Forecast By Market Taxonomy, 2025 to 2035
      • By Country
        • Germany
        • UK
        • France
        • Italy
        • Spain
        • Belgium
        • Netherlands
        • Nordic
        • Switzerland
        • Russia
        • Poland
        • Rest of Europe
      • By Microbe System
      • By Function
      • By Mask Type
      • By Channel
      • By Claim
    • Market Attractiveness Analysis
      • By Country
      • By Microbe System
      • By Function
      • By Mask Type
      • By Channel
      • By Claim
    • Key Takeaways
  15. East Asia Analysis 2020 to 2024 and Forecast 2025 to 2035, By Country
    • Historical Market Size Value (USD Million) Trend Analysis By Market Taxonomy, 2020 to 2024
    • Market Size Value (USD Million) Forecast By Market Taxonomy, 2025 to 2035
      • By Country
        • China
        • Japan
        • South Korea
      • By Microbe System
      • By Function
      • By Mask Type
      • By Channel
      • By Claim
    • Market Attractiveness Analysis
      • By Country
      • By Microbe System
      • By Function
      • By Mask Type
      • By Channel
      • By Claim
    • Key Takeaways
  16. South Asia & Pacific Analysis 2020 to 2024 and Forecast 2025 to 2035, By Country
    • Historical Market Size Value (USD Million) Trend Analysis By Market Taxonomy, 2020 to 2024
    • Market Size Value (USD Million) Forecast By Market Taxonomy, 2025 to 2035
      • By Country
        • India
        • Thailand
        • Malaysia
        • Indonesia
        • Singapore
        • Vietnam
        • Australia
        • New Zealand
        • Rest of South Asia
      • By Microbe System
      • By Function
      • By Mask Type
      • By Channel
      • By Claim
    • Market Attractiveness Analysis
      • By Country
      • By Microbe System
      • By Function
      • By Mask Type
      • By Channel
      • By Claim
    • Key Takeaways
  17. Middle East and Africa Analysis 2020 to 2024 and Forecast 2025 to 2035, By Country
    • Historical Market Size Value (USD Million) Trend Analysis By Market Taxonomy, 2020 to 2024
    • Market Size Value (USD Million) Forecast By Market Taxonomy, 2025 to 2035
      • By Country
        • Turkey
        • UAE
        • Saudi Arabia
        • Israel
        • Other GCC Countries
        • North Africa
        • South Africa
      • By Microbe System
      • By Function
      • By Mask Type
      • By Channel
      • By Claim
    • Market Attractiveness Analysis
      • By Country
      • By Microbe System
      • By Function
      • By Mask Type
      • By Channel
      • By Claim
    • Key Takeaways
  18. Key Countries Analysis
    • USA
      • Pricing Analysis
      • Market Share Analysis, 2024
        • By Microbe System
        • By Function
        • By Mask Type
        • By Channel
        • By Claim
    • Canada
      • Pricing Analysis
      • Market Share Analysis, 2024
        • By Microbe System
        • By Function
        • By Mask Type
        • By Channel
        • By Claim
    • Mexico
      • Pricing Analysis
      • Market Share Analysis, 2024
        • By Microbe System
        • By Function
        • By Mask Type
        • By Channel
        • By Claim
    • Brazil
      • Pricing Analysis
      • Market Share Analysis, 2024
        • By Microbe System
        • By Function
        • By Mask Type
        • By Channel
        • By Claim
    • Germany
      • Pricing Analysis
      • Market Share Analysis, 2024
        • By Microbe System
        • By Function
        • By Mask Type
        • By Channel
        • By Claim
    • UK
      • Pricing Analysis
      • Market Share Analysis, 2024
        • By Microbe System
        • By Function
        • By Mask Type
        • By Channel
        • By Claim
    • Italy
      • Pricing Analysis
      • Market Share Analysis, 2024
        • By Microbe System
        • By Function
        • By Mask Type
        • By Channel
        • By Claim
    • Spain
      • Pricing Analysis
      • Market Share Analysis, 2024
        • By Microbe System
        • By Function
        • By Mask Type
        • By Channel
        • By Claim
    • France
      • Pricing Analysis
      • Market Share Analysis, 2024
        • By Microbe System
        • By Function
        • By Mask Type
        • By Channel
        • By Claim
    • India
      • Pricing Analysis
      • Market Share Analysis, 2024
        • By Microbe System
        • By Function
        • By Mask Type
        • By Channel
        • By Claim
    • Australia & New Zealand
      • Pricing Analysis
      • Market Share Analysis, 2024
        • By Microbe System
        • By Function
        • By Mask Type
        • By Channel
        • By Claim
    • China
      • Pricing Analysis
      • Market Share Analysis, 2024
        • By Microbe System
        • By Function
        • By Mask Type
        • By Channel
        • By Claim
    • Japan
      • Pricing Analysis
      • Market Share Analysis, 2024
        • By Microbe System
        • By Function
        • By Mask Type
        • By Channel
        • By Claim
    • South Korea
      • Pricing Analysis
      • Market Share Analysis, 2024
        • By Microbe System
        • By Function
        • By Mask Type
        • By Channel
        • By Claim
    • Russia
      • Pricing Analysis
      • Market Share Analysis, 2024
        • By Microbe System
        • By Function
        • By Mask Type
        • By Channel
        • By Claim
    • Poland
      • Pricing Analysis
      • Market Share Analysis, 2024
        • By Microbe System
        • By Function
        • By Mask Type
        • By Channel
        • By Claim
    • Hungary
      • Pricing Analysis
      • Market Share Analysis, 2024
        • By Microbe System
        • By Function
        • By Mask Type
        • By Channel
        • By Claim
    • Kingdom of Saudi Arabia
      • Pricing Analysis
      • Market Share Analysis, 2024
        • By Microbe System
        • By Function
        • By Mask Type
        • By Channel
        • By Claim
    • South Africa
      • Pricing Analysis
      • Market Share Analysis, 2024
        • By Microbe System
        • By Function
        • By Mask Type
        • By Channel
        • By Claim
  19. Market Structure Analysis
    • Competition Dashboard
    • Competition Benchmarking
    • Market Share Analysis of Top Players
      • By Regional
      • By Microbe System
      • By Function
      • By Mask Type
      • By Channel
      • By Claim
  20. Competition Analysis
    • Competition Deep Dive
      • Tula Skincare
        • Overview
        • Product Portfolio
        • Profitability by Market Segments (Product/Age /Sales Channel/Region)
        • Sales Footprint
        • Strategy Overview
        • Gallinée
        • Esse Skincare
        • Aurelia London
        • La Roche-Posay
        • Clinique
        • Laneige
        • Dr. Jart+
        • Innisfree
        • Yun Probiotherapy
        • The Inkey List
        • Olay
        • Eucerin
        • Skinceuticals
        • Vichy
        • COSRX
  21. Assumptions & Acronyms Used
  22. Research Methodology

List of Tables

  • Table 1: Global Value (USD Million) Forecast by Region, 2020-2035
  • Table 2: Global Value (USD Million) Forecast by Microbe System, 2020-2035
  • Table 3: Global Value (USD Million) Forecast by Function, 2020-2035
  • Table 4: Global Value (USD Million) Forecast by Mask Type, 2020-2035
  • Table 5: Global Value (USD Million) Forecast by Channel, 2020-2035
  • Table 6: Global Value (USD Million) Forecast by Claim, 2020-2035
  • Table 7: North America Value (USD Million) Forecast by Country, 2020-2035
  • Table 8: North America Value (USD Million) Forecast by Microbe System, 2020-2035
  • Table 9: North America Value (USD Million) Forecast by Function, 2020-2035
  • Table 10: North America Value (USD Million) Forecast by Mask Type, 2020-2035
  • Table 11: North America Value (USD Million) Forecast by Channel, 2020-2035
  • Table 12: North America Value (USD Million) Forecast by Claim, 2020-2035
  • Table 13: Latin America Value (USD Million) Forecast by Country, 2020-2035
  • Table 14: Latin America Value (USD Million) Forecast by Microbe System, 2020-2035
  • Table 15: Latin America Value (USD Million) Forecast by Function, 2020-2035
  • Table 16: Latin America Value (USD Million) Forecast by Mask Type, 2020-2035
  • Table 17: Latin America Value (USD Million) Forecast by Channel, 2020-2035
  • Table 18: Latin America Value (USD Million) Forecast by Claim, 2020-2035
  • Table 19: Europe Value (USD Million) Forecast by Country, 2020-2035
  • Table 20: Europe Value (USD Million) Forecast by Microbe System, 2020-2035
  • Table 21: Europe Value (USD Million) Forecast by Function, 2020-2035
  • Table 22: Europe Value (USD Million) Forecast by Mask Type, 2020-2035
  • Table 23: Europe Value (USD Million) Forecast by Channel, 2020-2035
  • Table 24: Europe Value (USD Million) Forecast by Claim, 2020-2035
  • Table 25: East Asia Value (USD Million) Forecast by Country, 2020-2035
  • Table 26: East Asia Value (USD Million) Forecast by Microbe System, 2020-2035
  • Table 27: East Asia Value (USD Million) Forecast by Function, 2020-2035
  • Table 28: East Asia Value (USD Million) Forecast by Mask Type, 2020-2035
  • Table 29: East Asia Value (USD Million) Forecast by Channel, 2020-2035
  • Table 30: East Asia Value (USD Million) Forecast by Claim, 2020-2035
  • Table 31: South Asia & Pacific Value (USD Million) Forecast by Country, 2020-2035
  • Table 32: South Asia & Pacific Value (USD Million) Forecast by Microbe System, 2020-2035
  • Table 33: South Asia & Pacific Value (USD Million) Forecast by Function, 2020-2035
  • Table 34: South Asia & Pacific Value (USD Million) Forecast by Mask Type, 2020-2035
  • Table 35: South Asia & Pacific Value (USD Million) Forecast by Channel, 2020-2035
  • Table 36: South Asia & Pacific Value (USD Million) Forecast by Claim, 2020-2035
  • Table 37: Middle East and Africa Value (USD Million) Forecast by Country, 2020-2035
  • Table 38: Middle East and Africa Value (USD Million) Forecast by Microbe System, 2020-2035
  • Table 39: Middle East and Africa Value (USD Million) Forecast by Function, 2020-2035
  • Table 40: Middle East and Africa Value (USD Million) Forecast by Mask Type, 2020-2035
  • Table 41: Middle East and Africa Value (USD Million) Forecast by Channel, 2020-2035
  • Table 42: Middle East and Africa Value (USD Million) Forecast by Claim, 2020-2035

List of Figures

  • Figure 1: Global Pricing Analysis
  • Figure 2: Global Value (USD Million) Forecast 2020-2035
  • Figure 3: Global Value Share and BPS Analysis by Microbe System, 2025 and 2035
  • Figure 4: Global Y-o-Y Growth Comparison by Microbe System, 2025-2035
  • Figure 5: Global Attractiveness Analysis by Microbe System
  • Figure 6: Global Value Share and BPS Analysis by Function, 2025 and 2035
  • Figure 7: Global Y-o-Y Growth Comparison by Function, 2025-2035
  • Figure 8: Global Attractiveness Analysis by Function
  • Figure 9: Global Value Share and BPS Analysis by Mask Type, 2025 and 2035
  • Figure 10: Global Y-o-Y Growth Comparison by Mask Type, 2025-2035
  • Figure 11: Global Attractiveness Analysis by Mask Type
  • Figure 12: Global Value Share and BPS Analysis by Channel, 2025 and 2035
  • Figure 13: Global Y-o-Y Growth Comparison by Channel, 2025-2035
  • Figure 14: Global Attractiveness Analysis by Channel
  • Figure 15: Global Value Share and BPS Analysis by Claim, 2025 and 2035
  • Figure 16: Global Y-o-Y Growth Comparison by Claim, 2025-2035
  • Figure 17: Global Attractiveness Analysis by Claim
  • Figure 18: Global Value (USD Million) Share and BPS Analysis by Region, 2025 and 2035
  • Figure 19: Global Y-o-Y Growth Comparison by Region, 2025-2035
  • Figure 20: Global Attractiveness Analysis by Region
  • Figure 21: North America Incremental $ Opportunity, 2025-2035
  • Figure 22: Latin America Incremental $ Opportunity, 2025-2035
  • Figure 23: Europe Incremental $ Opportunity, 2025-2035
  • Figure 24: East Asia Incremental $ Opportunity, 2025-2035
  • Figure 25: South Asia & Pacific Incremental $ Opportunity, 2025-2035
  • Figure 26: Middle East and Africa Incremental $ Opportunity, 2025-2035
  • Figure 27: North America Value Share and BPS Analysis by Country, 2025 and 2035
  • Figure 28: North America Value Share and BPS Analysis by Microbe System, 2025 and 2035
  • Figure 29: North America Y-o-Y Growth Comparison by Microbe System, 2025-2035
  • Figure 30: North America Attractiveness Analysis by Microbe System
  • Figure 31: North America Value Share and BPS Analysis by Function, 2025 and 2035
  • Figure 32: North America Y-o-Y Growth Comparison by Function, 2025-2035
  • Figure 33: North America Attractiveness Analysis by Function
  • Figure 34: North America Value Share and BPS Analysis by Mask Type, 2025 and 2035
  • Figure 35: North America Y-o-Y Growth Comparison by Mask Type, 2025-2035
  • Figure 36: North America Attractiveness Analysis by Mask Type
  • Figure 37: North America Value Share and BPS Analysis by Channel, 2025 and 2035
  • Figure 38: North America Y-o-Y Growth Comparison by Channel, 2025-2035
  • Figure 39: North America Attractiveness Analysis by Channel
  • Figure 40: North America Value Share and BPS Analysis by Claim, 2025 and 2035
  • Figure 41: North America Y-o-Y Growth Comparison by Claim, 2025-2035
  • Figure 42: North America Attractiveness Analysis by Claim
  • Figure 43: Latin America Value Share and BPS Analysis by Country, 2025 and 2035
  • Figure 44: Latin America Value Share and BPS Analysis by Microbe System, 2025 and 2035
  • Figure 45: Latin America Y-o-Y Growth Comparison by Microbe System, 2025-2035
  • Figure 46: Latin America Attractiveness Analysis by Microbe System
  • Figure 47: Latin America Value Share and BPS Analysis by Function, 2025 and 2035
  • Figure 48: Latin America Y-o-Y Growth Comparison by Function, 2025-2035
  • Figure 49: Latin America Attractiveness Analysis by Function
  • Figure 50: Latin America Value Share and BPS Analysis by Mask Type, 2025 and 2035
  • Figure 51: Latin America Y-o-Y Growth Comparison by Mask Type, 2025-2035
  • Figure 52: Latin America Attractiveness Analysis by Mask Type
  • Figure 53: Latin America Value Share and BPS Analysis by Channel, 2025 and 2035
  • Figure 54: Latin America Y-o-Y Growth Comparison by Channel, 2025-2035
  • Figure 55: Latin America Attractiveness Analysis by Channel
  • Figure 56: Latin America Value Share and BPS Analysis by Claim, 2025 and 2035
  • Figure 57: Latin America Y-o-Y Growth Comparison by Claim, 2025-2035
  • Figure 58: Latin America Attractiveness Analysis by Claim
  • Figure 59: Europe Value Share and BPS Analysis by Country, 2025 and 2035
  • Figure 60: Europe Value Share and BPS Analysis by Microbe System, 2025 and 2035
  • Figure 61: Europe Y-o-Y Growth Comparison by Microbe System, 2025-2035
  • Figure 62: Europe Attractiveness Analysis by Microbe System
  • Figure 63: Europe Value Share and BPS Analysis by Function, 2025 and 2035
  • Figure 64: Europe Y-o-Y Growth Comparison by Function, 2025-2035
  • Figure 65: Europe Attractiveness Analysis by Function
  • Figure 66: Europe Value Share and BPS Analysis by Mask Type, 2025 and 2035
  • Figure 67: Europe Y-o-Y Growth Comparison by Mask Type, 2025-2035
  • Figure 68: Europe Attractiveness Analysis by Mask Type
  • Figure 69: Europe Value Share and BPS Analysis by Channel, 2025 and 2035
  • Figure 70: Europe Y-o-Y Growth Comparison by Channel, 2025-2035
  • Figure 71: Europe Attractiveness Analysis by Channel
  • Figure 72: Europe Value Share and BPS Analysis by Claim, 2025 and 2035
  • Figure 73: Europe Y-o-Y Growth Comparison by Claim, 2025-2035
  • Figure 74: Europe Attractiveness Analysis by Claim
  • Figure 75: East Asia Value Share and BPS Analysis by Country, 2025 and 2035
  • Figure 76: East Asia Value Share and BPS Analysis by Microbe System, 2025 and 2035
  • Figure 77: East Asia Y-o-Y Growth Comparison by Microbe System, 2025-2035
  • Figure 78: East Asia Attractiveness Analysis by Microbe System
  • Figure 79: East Asia Value Share and BPS Analysis by Function, 2025 and 2035
  • Figure 80: East Asia Y-o-Y Growth Comparison by Function, 2025-2035
  • Figure 81: East Asia Attractiveness Analysis by Function
  • Figure 82: East Asia Value Share and BPS Analysis by Mask Type, 2025 and 2035
  • Figure 83: East Asia Y-o-Y Growth Comparison by Mask Type, 2025-2035
  • Figure 84: East Asia Attractiveness Analysis by Mask Type
  • Figure 85: East Asia Value Share and BPS Analysis by Channel, 2025 and 2035
  • Figure 86: East Asia Y-o-Y Growth Comparison by Channel, 2025-2035
  • Figure 87: East Asia Attractiveness Analysis by Channel
  • Figure 88: East Asia Value Share and BPS Analysis by Claim, 2025 and 2035
  • Figure 89: East Asia Y-o-Y Growth Comparison by Claim, 2025-2035
  • Figure 90: East Asia Attractiveness Analysis by Claim
  • Figure 91: South Asia & Pacific Value Share and BPS Analysis by Country, 2025 and 2035
  • Figure 92: South Asia & Pacific Value Share and BPS Analysis by Microbe System, 2025 and 2035
  • Figure 93: South Asia & Pacific Y-o-Y Growth Comparison by Microbe System, 2025-2035
  • Figure 94: South Asia & Pacific Attractiveness Analysis by Microbe System
  • Figure 95: South Asia & Pacific Value Share and BPS Analysis by Function, 2025 and 2035
  • Figure 96: South Asia & Pacific Y-o-Y Growth Comparison by Function, 2025-2035
  • Figure 97: South Asia & Pacific Attractiveness Analysis by Function
  • Figure 98: South Asia & Pacific Value Share and BPS Analysis by Mask Type, 2025 and 2035
  • Figure 99: South Asia & Pacific Y-o-Y Growth Comparison by Mask Type, 2025-2035
  • Figure 100: South Asia & Pacific Attractiveness Analysis by Mask Type
  • Figure 101: South Asia & Pacific Value Share and BPS Analysis by Channel, 2025 and 2035
  • Figure 102: South Asia & Pacific Y-o-Y Growth Comparison by Channel, 2025-2035
  • Figure 103: South Asia & Pacific Attractiveness Analysis by Channel
  • Figure 104: South Asia & Pacific Value Share and BPS Analysis by Claim, 2025 and 2035
  • Figure 105: South Asia & Pacific Y-o-Y Growth Comparison by Claim, 2025-2035
  • Figure 106: South Asia & Pacific Attractiveness Analysis by Claim
  • Figure 107: Middle East and Africa Value Share and BPS Analysis by Country, 2025 and 2035
  • Figure 108: Middle East and Africa Value Share and BPS Analysis by Microbe System, 2025 and 2035
  • Figure 109: Middle East and Africa Y-o-Y Growth Comparison by Microbe System, 2025-2035
  • Figure 110: Middle East and Africa Attractiveness Analysis by Microbe System
  • Figure 111: Middle East and Africa Value Share and BPS Analysis by Function, 2025 and 2035
  • Figure 112: Middle East and Africa Y-o-Y Growth Comparison by Function, 2025-2035
  • Figure 113: Middle East and Africa Attractiveness Analysis by Function
  • Figure 114: Middle East and Africa Value Share and BPS Analysis by Mask Type, 2025 and 2035
  • Figure 115: Middle East and Africa Y-o-Y Growth Comparison by Mask Type, 2025-2035
  • Figure 116: Middle East and Africa Attractiveness Analysis by Mask Type
  • Figure 117: Middle East and Africa Value Share and BPS Analysis by Channel, 2025 and 2035
  • Figure 118: Middle East and Africa Y-o-Y Growth Comparison by Channel, 2025-2035
  • Figure 119: Middle East and Africa Attractiveness Analysis by Channel
  • Figure 120: Middle East and Africa Value Share and BPS Analysis by Claim, 2025 and 2035
  • Figure 121: Middle East and Africa Y-o-Y Growth Comparison by Claim, 2025-2035
  • Figure 122: Middle East and Africa Attractiveness Analysis by Claim
  • Figure 123: Global - Tier Structure Analysis
  • Figure 124: Global - Company Share Analysis

Frequently Asked Questions

How big is the Niacinamide Serums Market in 2025?

The global Niacinamide Serums Market is estimated to be valued at USD 3,051.20 Million in 2025.

What will be the size of the Niacinamide Serums Market in 2035?

The market size for the Niacinamide Serums Market is projected to reach USD 9,151.40 Million by 2035.

How much will be the Niacinamide Serums Market growth between 2025 and 2035?

The Niacinamide Serums Market is expected to grow at an 11.60% CAGR between 2025 and 2035.

What are the key product types in the Niacinamide Serums Market?

The key product types in the Niacinamide Serums Market are water-based serums, emulsion serums, ampoules, and gel serums.

Which strength segment will contribute a significant share in the Niacinamide Serums Market in 2025?

In terms of strength, the 6-10% concentration segment is expected to command a 51.00% share in the Niacinamide Serums Market in 2025.

Explore Similar Insights

Future Market Insights

Niacinamide Serums Market

Chat With

MaRIA

Hi There, I am MaRIA, Your Market Research Intelligence Assistant. How may I help you?