Caffeine-Infused Serums Market Size and Share Forecast Outlook 2025 to 2035

The global market for caffeine-infused serums has been valued at USD 1,413.2 million in 2025, and it is projected to reach USD 4,310.1 million by 2035. This expansion indicates an addition of USD 2,896.9 million over the decade, reflecting nearly a threefold increase in overall market size. The anticipated growth equates to a CAGR of 11.8% from 2025 to 2035.
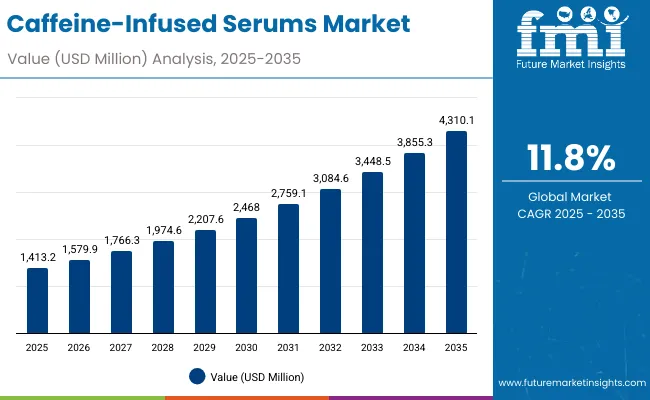
Quick Stats for Caffeine-Infused Serums Market

  • Caffeine-Infused Serums Market Value (2025): USD 1,413.2 million
  • Caffeine-Infused Serums Market Forecast Value (2035): USD 4,310.1 million
  • Caffeine-Infused Serums Market Forecast CAGR (2025 to 2035): 11.8%
  • Leading Segment in 2025: Natural caffeine (51.5%)
  • Key Growth Regions: Asia-Pacific (China, India, Japan, South Korea); North America; Europe
  • Top Key Players: The Ordinary; Estée Lauder; L’Oréal (Garnier); Shiseido; Clinique; The Inkey List; Origins; Rohto; Lacura; UnileverFrom 2020 to 2024, category momentum was built through eye-serum adoption, dermatologist endorsements, and e-commerce/D2C scale, with clean-label positioning and visible anti-puffiness benefits shaping demand. By 2035, revenue mix is expected to tilt toward premium, clinically validated, and sustainability-led offerings, with subscriptions and influencer-driven digital campaigns reinforcing brand loyalty and lifetime value.

Caffeine Infused Serums Market

Caffeine-Infused Serums Market Key Takeaways

Metric Value
Market Estimated Value In (2025E) USD 1,413.2 million
Market Forecast Value In (2035F) USD 4,310.1 million
Forecast CAGR (2025 to 2035) 11.80%

During the initial phase between 2025 and 2030, the market is expected to grow from USD 1,413.2 million to USD 2,468.0 million, contributing USD 1,054.8 million and accounting for more than one-third of total decade growth. This period is expected to be shaped by rising consumer preference for targeted skincare benefits such as anti-puffiness and brightening, along with the increasing shift toward natural caffeine formulations.

The latter half of the forecast, from 2030 to 2035, is set to accelerate further, with the market adding USD 1,842.1 million as it climbs from USD 2,468.0 million to USD 4,310.1 million. This phase is projected to represent nearly two-thirds of the total decade growth, underscoring the rapid scale-up of premium and functional skincare routines globally. Natural caffeine is expected to dominate the ingredient base, accounting for 51.5% of market share in 2025, while eye serums are forecast to lead the format category with a 48.5% share. The dominance of these segments reflects sustained consumer trust in efficacy-driven formulations. The outlook points toward an industry where efficacy validation, sustainability in sourcing, and digital-driven retail strategies are anticipated to shape competitive advantage, ensuring consistent demand momentum through 2035.

Why the Caffeine-Infused Serums Market is growing?

The caffeine-infused serums market is experiencing steady expansion as consumer demand for targeted skincare benefits has been rising globally. Growth is being driven by the proven efficacy of caffeine in reducing puffiness, brightening under-eye areas, and improving overall skin vitality. Increasing awareness of lifestyle-related stress, screen fatigue, and sleep-deprivation effects has been fueling demand for functional products with quick visible results.

The preference for natural and plant-based ingredients is also accelerating the adoption of caffeine sourced from coffee and tea extracts, strengthening the appeal of clean-label solutions. Digital retail platforms and direct-to-consumer strategies have been amplifying access to a wider customer base, while influencer-driven campaigns have been shaping awareness and trust. Innovation in lightweight formats such as roll-ons and eye serums has been improving consumer convenience, supporting frequent use. As clinical validation, sustainability commitments, and premium positioning become central, the market is expected to capture accelerated momentum through 2035.

Segmental Analysis

The caffeine-infused serums market has been structured around key segmentation parameters that reflect consumer preferences and functional performance. Segmentation by ingredient base highlights the distinction between natural caffeine derived from coffee or tea and other synthetic or blended bases, showing how sourcing influences adoption trends. Format-based segmentation emphasizes the growing appeal of targeted solutions such as eye serums, while broader product forms continue to contribute significantly to overall revenues.

Function-based segmentation focuses on consumer-driven needs, with anti-puffiness treatments commanding strong traction alongside other multi-functional benefits. Together, these segments illustrate the evolving balance between natural sourcing, functional efficacy, and format innovation, indicating where demand momentum is expected to accelerate over the next decade. Each segment provides a unique lens into future opportunities, competitive strengths, and consumer trust-building strategies.
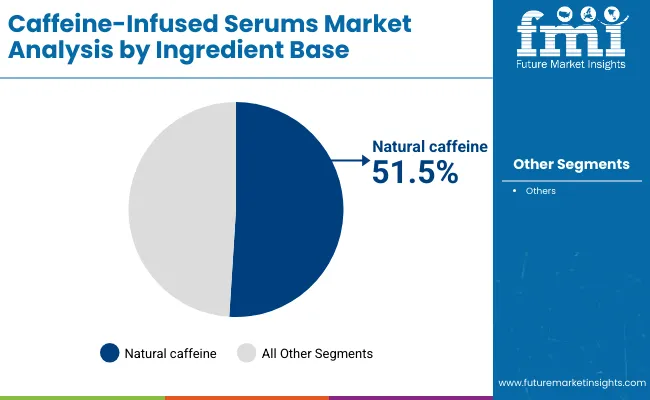
Insights into the Ingredient Base Segment with Natural Caffeine Leading

Caffeine Infused Serums Market By Ingrediant

Segment Market Value Share, 2025
Natural caffeine 51.50%
Others 48.50%

Natural caffeine is expected to dominate the caffeine-infused serums market in 2025 with a 51.5% share, equating to USD 720.7 million in revenues. This leadership is driven by rising consumer inclination toward naturally derived and traceable ingredients that align with clean beauty trends. Enhanced credibility around the safety and efficacy of coffee and tea extracts has been strengthening demand. Trust in natural-origin formulations is being further reinforced by consumer concerns about synthetic actives, thereby supporting consistent premium pricing. It is projected that brands leveraging natural caffeine will gain competitive differentiation through sourcing transparency and sustainable farming practices. Over the forecast period, this segment is expected to remain central to innovation and consumer loyalty, ensuring strong growth momentum globally.
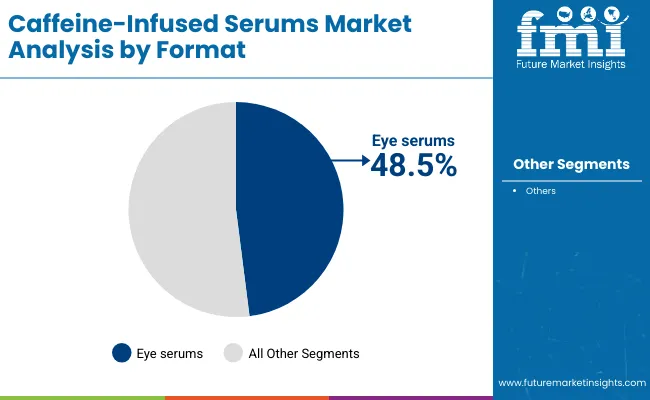
Insights into the Format Segment with Eye Serums Retaining Focus

Caffeine Infused Serums Market By Format

Segment Market Value Share, 2025
Eye serums 48.50%
Others 51.50%

Eye serums are projected to hold a 48.5% share of the market in 2025, equating to USD 679.1 million. The dominance of this format is being reinforced by growing awareness of delicate under-eye concerns, including puffiness and dark circles. Demand for lightweight, fast-absorbing products has been shaping preferences in this segment, with consumers increasingly seeking targeted solutions that integrate seamlessly into daily routines. Formulation advances in delivery systems, alongside ergonomic packaging such as roll-ons, are being positioned as enablers of efficacy and convenience. The ongoing preference for eye-area solutions underscores the role of caffeine in delivering quick, visible results. As consumer self-care rituals intensify, eye serums are expected to remain a priority category, driving sustained segment expansion through 2035.
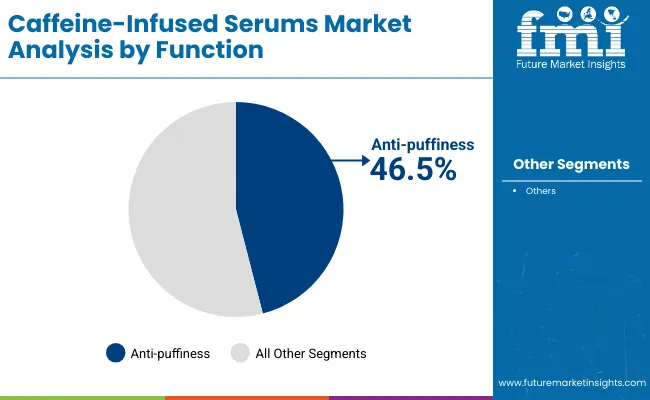
Insights into the Function Segment with Anti-Puffiness as a Strong Driver

Caffeine Infused Serums Market By Function

Segment Market Value Share, 2025
Anti-puffiness 46.50%
Others 53.50%

Anti-puffiness is projected to capture 46.5% of market value in 2025, contributing USD 651.4 million. This function has been positioned as one of the most compelling claims, particularly in relation to stress, lifestyle fatigue, and screen-related eye strain. Caffeine’s proven vasoconstrictive and circulation-enhancing properties are being leveraged to deliver immediate and visible improvements, strengthening consumer trust in its application. The segment’s growth is further supported by strong marketing narratives around rejuvenation and freshness, resonating with both mass and premium product tiers. As lifestyles remain increasingly demanding, anti-puffiness solutions are expected to secure wider adoption across age groups. With efficacy data and clinical validation shaping consumer choices, this functional segment is likely to remain a core growth pillar for the industry.

What are the Drivers, Restraints, and Key Trends of the Caffeine-Infused Serums Market?

The caffeine-infused serums market is expanding under the influence of multiple demand drivers, while certain structural restraints continue to shape adoption strategies. Industry stakeholders are aligning product development and distribution with evolving consumer expectations, regulatory frameworks, and innovation cycles.

Increasing Clinical Validation and Dermatologist Endorsements

A critical driver for the caffeine-infused serums market is the intensification of clinical validation and professional endorsements. As efficacy data on caffeine’s role in reducing under-eye puffiness and enhancing microcirculation is substantiated, stronger credibility is being established across consumer and professional segments. Dermatologist-backed trials and peer-reviewed publications are elevating trust, enabling premium price capture, and reinforcing long-term loyalty. This scientific backing is expected to shift consumer perception from experimental beauty claims to evidence-based skincare, ensuring more sustainable demand and higher lifetime value.

Raw Material Volatility and Supply Concentration Risks

A significant restraint lies in the volatility of natural caffeine sourcing and concentration of supply chains. Coffee and tea harvest fluctuations, combined with geographic dependency, expose the segment to raw material cost instability and potential quality inconsistencies. Sustainability certifications and traceability protocols increase costs further, creating challenges for brands competing in price-sensitive categories. Without diversified sourcing strategies and investment in synthetic alternatives, companies may face margin compression. This supply-side unpredictability is expected to remain a barrier, particularly for smaller brands lacking robust procurement networks, potentially slowing expansion in fast-growing but cost-conscious markets.
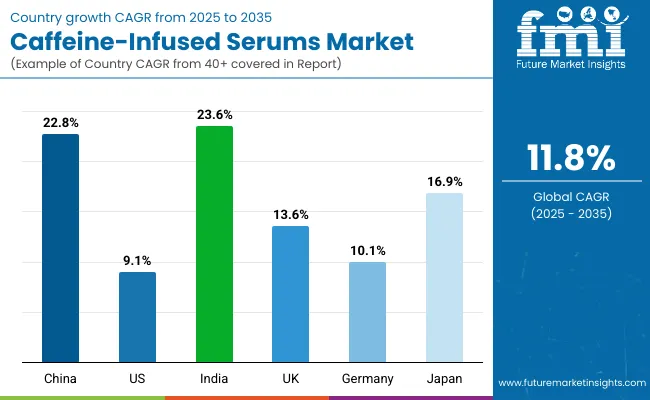
Analysis of Caffeine-Infused Serums Market By Key Countries

Caffeine Infused Serums Market By Country

Countries CAGR
China 22.8%
USA 9.1%
India 23.6%
UK 13.6%
Germany 10.1%
Japan 16.9%

The global caffeine-infused serums market demonstrates marked differences in growth trajectories across key countries, shaped by demographic patterns, consumer preferences, and retail structures. Asia is positioned as the primary growth hub, with India forecasted at a CAGR of 23.6% and China at 22.8%. Growth in these markets is being accelerated by the younger population base, increasing disposable incomes, and heightened awareness of skincare regimes focused on anti-puffiness and brightening. Strong penetration of digital commerce and influencer-led beauty culture in both countries is expected to amplify accessibility and adoption.

Japan, advancing at 16.9% CAGR, reflects a preference for clinically validated and technologically advanced formulations, with established cosmetic houses investing in premium caffeine-based solutions. In Europe, the UK (13.6%) and Germany (10.1%) are maintaining steady growth supported by regulatory emphasis on ingredient transparency and sustainable sourcing, aligning with consumer expectations of clean-label products. Premium retail channels and rising demand for masstige skincare formats are reinforcing this trajectory.

The USA, growing at 9.1% CAGR, displays a mature but stable profile, where brand differentiation is expected to be built on dermatologist endorsements, subscription-driven models, and digital-native challenger brands. Overall, the interplay between premiumization in mature economies and volume-led expansion in Asia is projected to define the next decade of market evolution.
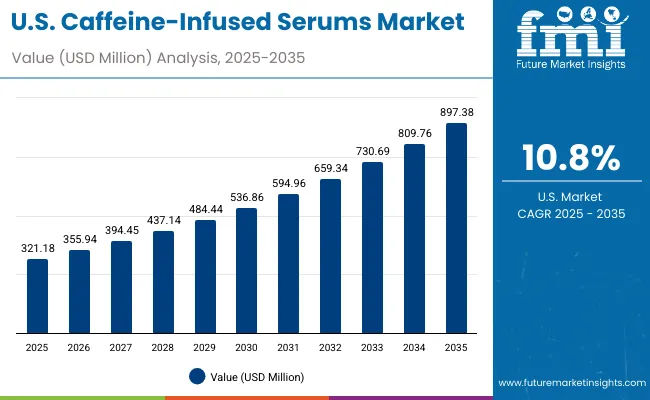
Sales Outlook for Caffeine-Infused Serums in the United States

Caffeine Infused Serums Market Usa

Year USA Caffeine-Infused Serums Market (USD Million)
2025 321.18
2026 355.94
2027 394.45
2028 437.14
2029 484.44
2030 536.86
2031 594.96
2032 659.34
2033 730.69
2034 809.76
2035 897.38

The caffeine-infused serums market in the United States is projected to grow at a CAGR of 10.8%, increasing from USD 321.18 million in 2025 to USD 897.38 million by 2035. This trajectory reflects an almost threefold rise in market revenues across the decade. During the first five-year phase from 2025 to 2030, growth of over USD 215 million is expected, driven by expanding demand for anti-puffiness and brightening formulations suited to fast-paced lifestyles.

Between 2030 and 2035, more than USD 360 million in additional revenues are anticipated, with stronger traction achieved through premium and clinically validated product lines. Adoption is forecasted to be supported by dermatologist endorsements, sustainability-driven packaging innovations, and wider subscription-based direct-to-consumer offerings.

  • Functional positioning in anti-fatigue and under-eye care is expected to engage both younger and mature demographics.
  • Pharmacies and specialty retail outlets are projected to remain essential for consumer education and trial generation.
  • Digital commerce and influencer-led campaigns are anticipated to amplify brand visibility, while clinical substantiation is expected to safeguard premium price realization.

Growth and Expansion Outlook for Caffeine-Infused Serums Market in the United Kingdom

The caffeine-infused serums market in the United Kingdom is projected to grow at a CAGR of 13.6% between 2025 and 2035, reflecting robust adoption of masstige and premium skincare solutions. Growth will be anchored by the country’s strong beauty retail ecosystem and stringent regulatory emphasis on ingredient transparency. Over the first half of the forecast, accelerated demand is expected from younger consumers seeking under-eye and brightening solutions aligned with fast-paced, digitally influenced lifestyles. In the second half, premiumization and sustainability commitments are anticipated to strengthen brand differentiation, adding incremental value to the market.

  • Masstige brands are expected to thrive by balancing affordability and efficacy.
  • Retailers, particularly specialty chains, are projected to shape trial and consumer trust.
  • Sustainable packaging and clean-label claims are anticipated to elevate competitive positioning.
  • Influencer-driven narratives are forecasted to sustain youth-driven adoption cycles.

Growth and Expansion Outlook for Caffeine-Infused Serums Market in India

The caffeine-infused serums market in India is forecasted to grow at a CAGR of 23.6% during 2025-2035, making it the fastest-growing market globally. Rapid urbanization, digital-first consumer behavior, and aspirational middle-class spending are expected to fuel widespread adoption. In the early forecast years, affordability and availability across mass retail are anticipated to drive penetration. From 2030 onward, premium and clinically backed formulations are projected to expand as disposable incomes rise and skincare routines mature. The market’s momentum is likely to be amplified by regional influencer ecosystems and localized e-commerce platforms.

  • Mass and masstige formats are projected to dominate early-stage growth.
  • Dermatologist endorsements are expected to build long-term consumer trust.
  • E-commerce penetration is forecasted to accelerate adoption across Tier 2 and Tier 3 cities.
  • Premium growth is anticipated as international and local brands compete in advanced formulations.

Sales Outlook for Caffeine-Infused Serums in China

The caffeine-infused serums market in China is expected to grow at a CAGR of 22.8% between 2025 and 2035, driven by strong digital retail penetration and consumer focus on functional skincare. The first half of the decade is projected to see growth led by e-commerce-led discovery and trial, supported by large-scale promotional campaigns. In the later half, premium international and domestic brands are expected to strengthen their presence through clinical validation and sustainability-led positioning. China’s regulatory environment around ingredient safety is anticipated to support trust and premium adoption.
  • Online beauty platforms and livestreaming commerce are shaping demand acceleration.
  • Functional positioning around anti-puffiness is expected to resonate strongly with younger consumers.
  • Local brands are anticipated to compete with multinationals through affordability and speed to market.
  • Ingredient transparency and clean beauty compliance are projected to reinforce premium consumer loyalty.

In-depth Analysis of Caffeine-Infused Serums in Germany

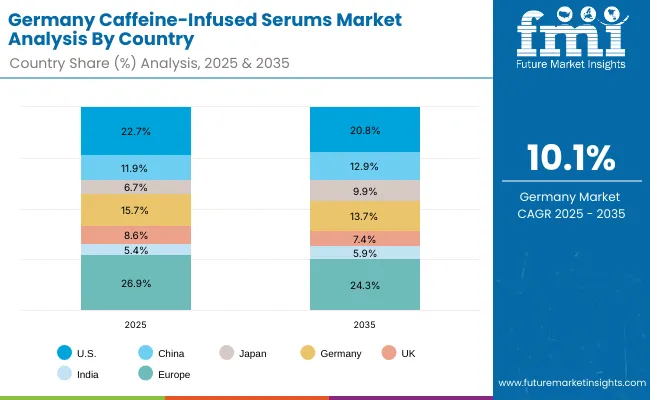
Caffeine Infused Serums Market Germany

Countries 2025
USA 22.7%
China 11.9%
Japan 6.7%
Germany 15.7%
UK 8.6%
India 5.4%
Countries 2035
USA 20.8%
China 12.9%
Japan 9.9%
Germany 13.7%
UK 7.4%
India 5.9%

The caffeine-infused serums market in Germany is projected to expand at a CAGR of 10.1% during 2025-2035, supported by strong consumer alignment with clean-label, dermatologically tested formulations. Initial growth will be driven by widespread adoption in pharmacy and specialty retail channels, where consumer trust in evidence-backed products is high. From 2030 onward, demand for sustainable packaging, traceable natural caffeine sourcing, and clinically validated claims is expected to define competitive advantage. Germany’s role as a key European beauty hub is anticipated to keep it central to innovation and premium adoption.
  • Pharmacies and dermatology clinics are expected to act as key trust-building channels.
  • Clean-label certification and sustainability are projected to remain non-negotiable differentiators.
  • Masstige and premium tiers are forecasted to expand faster than mass-market offerings.
  • Domestic players are anticipated to innovate alongside global beauty houses in natural formulations.

Growth Outlook for Caffeine-Infused Serums Market in USA

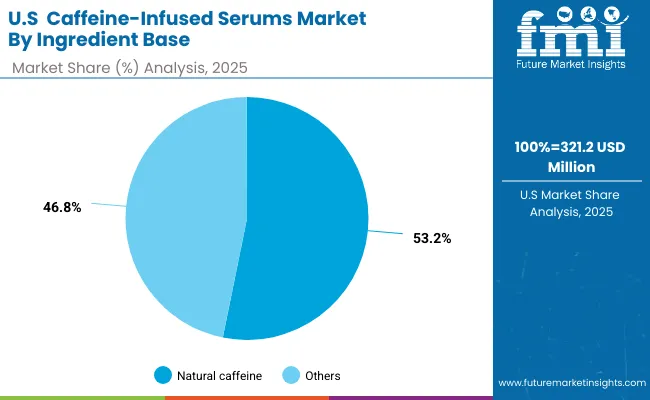
Caffeine Infused Serums Market Usa 2

Segment Market Value Share, 2025
Natural caffeine 53.2%
Others 46.8%

The caffeine-infused serums market in the USA is projected at USD 321.2 million in 2025. Natural caffeine contributes 53.2% (USD 170.9 Million), while other ingredient bases hold 46.8% (USD 150.3 Million), indicating a clear consumer inclination toward botanical and recognizable sources. This natural caffeine leadership is expected to be reinforced by the growing preference for clean-label, traceable formulations that align with evolving retailer ingredient standards and consumer wellness narratives.

The rising dominance of natural caffeine is being attributed to heightened awareness of its antioxidant potential, vasoconstrictive benefits for puffiness reduction, and ability to enhance microcirculation in the under-eye area. Consumers are expected to increasingly seek solutions that offer clinically substantiated claims, which will support the continued expansion of natural caffeine’s share. Sustainability storytelling particularly upcycling coffee bean byproducts is likely to add a premium halo, driving higher willingness to pay among USA consumers.

As competition intensifies, formulators are projected to combine natural caffeine with complementary actives such as peptides and niacinamide, enhancing multi-targeted benefits and justifying premium positioning. Retailers are expected to favor brands that present assay-verified caffeine content and dermatologically validated results, ensuring faster shelf approvals.
  • Market in the USA holds 22.7% share of the global market in 2025
  • Natural caffeine leads others at 53.2% vs. 46.8%
  • Growth supported by clean-label momentum, sustainability narratives, and clinically backed de-puffing and brightening claims

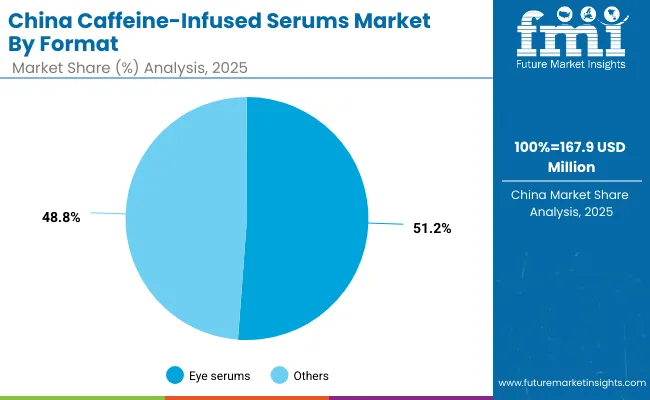
Opportunity Analysis of China Caffeine-Infused Serums Market

Caffeine Infused Serums Market China

Segment Market Value Share, 2025
Eye serums 51.2%
Others 48.8%

The caffeine-infused serums market in China is projected at USD 167.9 million in 2025. Eye serums contribute 51.2% (USD 86.0 Million), while other serum formats account for 48.8% (USD 81.9 Million), signaling a strong consumer orientation toward targeted eye-care solutions. This slight eye-serum leadership is expected to strengthen as screen-related eye fatigue, late-night work culture, and urban stress continue to heighten demand for de-puffing and anti-dark-circle treatments.

The dominance of eye serums is being driven by China’s digitally native consumers, who are increasingly influenced by social commerce trends and dermatologist-endorsed KOL campaigns. The format’s precision application is expected to resonate with younger demographics seeking fast-acting, problem-specific solutions. This will likely encourage premiumization within the category, as cooling applicators, metal-tip roll-ons, and serum-in-ampoule innovations become mainstream.

Double-digit expansion is projected, with the market expected to grow at 22.8% CAGR (2025-2035), outpacing most developed regions. Cross-border e-commerce and local C-beauty brand innovation are anticipated to accelerate adoption, supported by live-streaming platforms that drive real-time education and conversion. Furthermore, ingredient storytelling around naturally sourced caffeine is projected to gain traction, reinforcing consumer trust and enabling price mix improvements.
  • Market in China holds 11.9% share of the global market in 2025
  • Eye serums lead other formats at 51.2% vs. 48.8%
  • Growth supported by digital engagement, screen fatigue solutions, and premiumized delivery formats with clinically validated outcomes

Competitive Landscape of Caffeine-Infused Serums Market

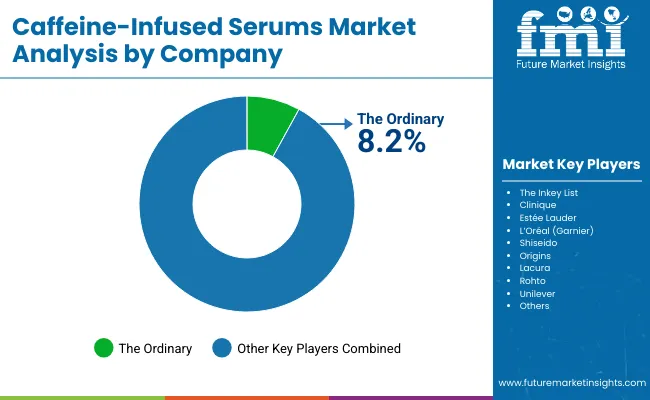
Caffeine Infused Serums Market By Company

The caffeine-infused serums market is moderately fragmented, with global leaders, established skincare giants, and niche-focused specialists competing across diverse regions. Leading players such as The Ordinary, Clinique, Estée Lauder, L’Oréal (Garnier), and Shiseido hold significant market presence, leveraging brand equity, research capabilities, and global retail networks. Their strategies are increasingly focused on clinical validation, clean-label claims, and dermatologist endorsements, which are expected to strengthen premium positioning and consumer trust.

Mid-sized innovators including The Inkey List, Origins, and Rohto are addressing demand for targeted formats such as eye serums, roll-ons, and lightweight brightening solutions. These companies are expanding relevance through e-commerce-driven visibility, competitive pricing, and rapid product launches tailored for younger demographics. Their agility in responding to fast-evolving trends is projected to reinforce adoption in both mass and masstige segments.

Private-label and niche specialists such as Lacura are contributing by offering cost-effective alternatives within retail-exclusive environments. These brands emphasize affordability while capitalizing on rising consumer interest in anti-puffiness and brightening claims, particularly in value-driven markets.

Competitive differentiation is shifting from simple caffeine inclusion toward integrated narratives around efficacy data, sustainability, and clean beauty positioning. Subscription-driven models, recyclable packaging, and transparency in sourcing are expected to define the next phase of competitive advantage.

Key Developments in Caffeine-Infused Serums Market

  • In July 2025, consumer interest in “caffeine eye serum” reached a search interest peak, with a normalized score of 95, surpassing other related terms and revealing heightened demand for undereye anti puffiness solutions a signal that marketers and product developers are likely to double down on functional eye area caffeine formulations.
  • In April 2025, a leading beauty brand introduced a new multi antioxidant radiance serum. While not caffeine based, the release reflects the broader industry’s push toward formulation sophistication and clean beauty positioning, suggesting that emerging caffeine in fused innovations are likely to follow suit with advanced performance blends and ingredient transparency.

Scope of the Report

Item Value
Market size, 2025 USD 1,413.2 million
Market size, 2035 USD 4,310.1 million
Incremental value, 2025-2035 USD 2,896.9 million
CAGR, 2025-2035 11.80%
Ingredient base (2025) Natural caffeine: 51.5% (USD 720.7 million); Others: 48.5% (USD 685.7 million)
Format (2025) Eye serums: 48.5% (USD 679.1 million); Others: 51.5% (USD 727.7 million)
Function (2025) Anti-puffiness: 46.5% (USD 651.4 million); Others: 53.5% (USD 755.6 million)
Primary channels E-commerce; Specialty beauty retail; Direct-to-Consumer (D2C); Pharmacies
Price tiers Mass; Masstige; Premium
Regions covered North America; Europe; Asia-Pacific; Latin America; Middle East & Africa
Countries covered (key) United States; China; Japan; Germany; United Kingdom; India
Key companies profiled The Ordinary; The Inkey List; Clinique; Estée Lauder; L’Oréal (Garnier); Shiseido; Origins; Lacura; Rohto; Unilever
Time horizon 2025-2035
Additional attributes Clinical validation, clean-label sourcing, sustainability packaging, D2C subscriptions, digital commerce, influencer activation, premiumization strategies

Key Segments

By Function:

  • Anti-puffiness
  • Firming
  • Anti-dark circles
  • Brightening

By Ingredient Base:

  • Natural caffeine (coffee/tea)
  • Synthetic caffeine

By Format:

  • Eye serums
  • Face serums
  • Ampoules
  • Roll-ons

By Channel:

  • E-commerce
  • Specialty beauty retail
  • D2C
  • Pharmacies

By Tier:

  • Mass
  • Masstige
  • Premium

By Region:

  • North America
  • Latin America
  • Europe
  • East Asia
  • South Asia & Pacific
  • Middle East and Africa

Table of Content

  1. Executive Summary
    • Global Market Outlook
    • Demand-side Trends
    • Supply-side Trends
    • Technology Roadmap Analysis
    • Analysis and Recommendations
  2. Market Overview
    • Market Coverage / Taxonomy
    • Market Definition / Scope / Limitations
  3. Market Background
    • Market Dynamics
      • Drivers
      • Restraints
      • Opportunity
      • Trends
    • Scenario Forecast
      • Demand in Optimistic Scenario
      • Demand in Likely Scenario
      • Demand in Conservative Scenario
    • Opportunity Map Analysis
    • Product Life Cycle Analysis
    • Supply Chain Analysis
      • Supply Side Participants and their Roles
        • Producers
        • Mid-Level Participants (Traders/ Agents/ Brokers)
        • Wholesalers and Distributors
      • Value Added and Value Created at Node in the Supply Chain
      • List of Raw Material Suppliers
      • List of Existing and Potential Buyer’s
    • Investment Feasibility Matrix
    • Value Chain Analysis
      • Profit Margin Analysis
      • Wholesalers and Distributors
      • Retailers
    • PESTLE and Porter’s Analysis
    • Regulatory Landscape
      • By Key Regions
      • By Key Countries
    • Regional Parent Market Outlook
    • Production and Consumption Statistics
    • Import and Export Statistics
  4. Global Market Analysis 2020 to 2024 and Forecast, 2025 to 2035
    • Historical Market Size Value (USD Million) & Volume (Units) Analysis, 2020 to 2024
    • Current and Future Market Size Value (USD Million) & Volume (Units) Projections, 2025 to 2035
      • Y-o-Y Growth Trend Analysis
      • Absolute $ Opportunity Analysis
  5. Global Market Analysis 2020 to 2024 and Forecast 2025 to 2035, By Function
    • Introduction / Key Findings
    • Historical Market Size Value (USD Million) & Volume (Units) Analysis By Function, 2020 to 2024
    • Current and Future Market Size Value (USD Million) & Volume (Units) Analysis and Forecast By Function, 2025 to 2035
      • Anti-puffiness
      • Firming
      • Anti-dark circles
      • Brightening
    • Y-o-Y Growth Trend Analysis By Function, 2020 to 2024
    • Absolute $ Opportunity Analysis By Function, 2025 to 2035
  6. Global Market Analysis 2020 to 2024 and Forecast 2025 to 2035, By Ingredient Base
    • Introduction / Key Findings
    • Historical Market Size Value (USD Million) & Volume (Units) Analysis By Ingredient Base, 2020 to 2024
    • Current and Future Market Size Value (USD Million) & Volume (Units) Analysis and Forecast By Ingredient Base, 2025 to 2035
      • Natural caffeine (coffee/tea)
      • Synthetic caffeine
    • Y-o-Y Growth Trend Analysis By Ingredient Base, 2020 to 2024
    • Absolute $ Opportunity Analysis By Ingredient Base, 2025 to 2035
  7. Global Market Analysis 2020 to 2024 and Forecast 2025 to 2035, By Format
    • Introduction / Key Findings
    • Historical Market Size Value (USD Million) & Volume (Units) Analysis By Format, 2020 to 2024
    • Current and Future Market Size Value (USD Million) & Volume (Units) Analysis and Forecast By Format, 2025 to 2035
      • Eye serums
      • Face serums
      • Ampoules
      • Roll-ons
    • Y-o-Y Growth Trend Analysis By Format, 2020 to 2024
    • Absolute $ Opportunity Analysis By Format, 2025 to 2035
  8. Global Market Analysis 2020 to 2024 and Forecast 2025 to 2035, By Channel
    • Introduction / Key Findings
    • Historical Market Size Value (USD Million) & Volume (Units) Analysis By Channel, 2020 to 2024
    • Current and Future Market Size Value (USD Million) & Volume (Units) Analysis and Forecast By Channel, 2025 to 2035
      • E-commerce
      • Specialty beauty retail
      • D2C
      • Pharmacies
    • Y-o-Y Growth Trend Analysis By Channel, 2020 to 2024
    • Absolute $ Opportunity Analysis By Channel, 2025 to 2035
  9. Global Market Analysis 2020 to 2024 and Forecast 2025 to 2035, By Tier
    • Introduction / Key Findings
    • Historical Market Size Value (USD Million) & Volume (Units) Analysis By Tier, 2020 to 2024
    • Current and Future Market Size Value (USD Million) & Volume (Units) Analysis and Forecast By Tier, 2025 to 2035
      • Mass
      • Masstige
      • Premium
    • Y-o-Y Growth Trend Analysis By Tier, 2020 to 2024
    • Absolute $ Opportunity Analysis By Tier, 2025 to 2035
  10. Global Market Analysis 2020 to 2024 and Forecast 2025 to 2035, By Region
    • Introduction
    • Historical Market Size Value (USD Million) & Volume (Units) Analysis By Region, 2020 to 2024
    • Current Market Size Value (USD Million) & Volume (Units) Analysis and Forecast By Region, 2025 to 2035
      • North America
      • Latin America
      • Europe
      • East Asia
      • South Asia & Pacific
      • Middle East and Africa
    • Market Attractiveness Analysis By Region
  11. North America Market Analysis 2020 to 2024 and Forecast 2025 to 2035, By Country
    • Historical Market Size Value (USD Million) & Volume (Units) Trend Analysis By Market Taxonomy, 2020 to 2024
    • Market Size Value (USD Million) & Volume (Units) Forecast By Market Taxonomy, 2025 to 2035
      • By Country
        • USA
        • Canada
      • By Function
      • By Ingredient Base
      • By Format
      • By Channel
      • By Tier
    • Market Attractiveness Analysis
      • By Country
      • By Function
      • By Ingredient Base
      • By Format
      • By Channel
      • By Tier
    • Key Takeaways
  12. Latin America Market Analysis 2020 to 2024 and Forecast 2025 to 2035, By Country
    • Historical Market Size Value (USD Million) & Volume (Units) Trend Analysis By Market Taxonomy, 2020 to 2024
    • Market Size Value (USD Million) & Volume (Units) Forecast By Market Taxonomy, 2025 to 2035
      • By Country
        • Brazil
        • Mexico
        • Colombia
        • Rest of Latin America
      • By Function
      • By Ingredient Base
      • By Format
      • By Channel
      • By Tier
    • Market Attractiveness Analysis
      • By Country
      • By Function
      • By Ingredient Base
      • By Format
      • By Channel
      • By Tier
    • Key Takeaways
  13. Europe Market Analysis 2020 to 2024 and Forecast 2025 to 2035, By Country
    • Historical Market Size Value (USD Million) & Volume (Units) Trend Analysis By Market Taxonomy, 2020 to 2024
    • Market Size Value (USD Million) & Volume (Units) Forecast By Market Taxonomy, 2025 to 2035
      • By Country
        • Germany
        • UK
        • France
        • Italy
        • Spain
        • Belgium
        • Netherlands
        • Nordic
        • Switzerland
        • Russia
        • Poland
        • Rest of Europe
      • By Function
      • By Ingredient Base
      • By Format
      • By Channel
      • By Tier
    • Market Attractiveness Analysis
      • By Country
      • By Function
      • By Ingredient Base
      • By Format
      • By Channel
      • By Tier
    • Key Takeaways
  14. East Asia Market Analysis 2020 to 2024 and Forecast 2025 to 2035, By Country
    • Historical Market Size Value (USD Million) & Volume (Units) Trend Analysis By Market Taxonomy, 2020 to 2024
    • Market Size Value (USD Million) & Volume (Units) Forecast By Market Taxonomy, 2025 to 2035
      • By Country
        • China
        • Japan
        • South Korea
      • By Function
      • By Ingredient Base
      • By Format
      • By Channel
      • By Tier
    • Market Attractiveness Analysis
      • By Country
      • By Function
      • By Ingredient Base
      • By Format
      • By Channel
      • By Tier
    • Key Takeaways
  15. South Asia & Pacific Market Analysis 2020 to 2024 and Forecast 2025 to 2035, By Country
    • Historical Market Size Value (USD Million) & Volume (Units) Trend Analysis By Market Taxonomy, 2020 to 2024
    • Market Size Value (USD Million) & Volume (Units) Forecast By Market Taxonomy, 2025 to 2035
      • By Country
        • India
        • Thailand
        • Malaysia
        • Indonesia
        • Singapore
        • Vietnam
        • Australia
        • New Zealand
        • Rest of South Asia
      • By Function
      • By Ingredient Base
      • By Format
      • By Channel
      • By Tier
    • Market Attractiveness Analysis
      • By Country
      • By Function
      • By Ingredient Base
      • By Format
      • By Channel
      • By Tier
    • Key Takeaways
  16. Middle East and Africa Market Analysis 2020 to 2024 and Forecast 2025 to 2035, By Country
    • Historical Market Size Value (USD Million) & Volume (Units) Trend Analysis By Market Taxonomy, 2020 to 2024
    • Market Size Value (USD Million) & Volume (Units) Forecast By Market Taxonomy, 2025 to 2035
      • By Country
        • Turkey
        • UAE
        • Saudi Arabia
        • Israel
        • Other GCC Countries
        • North Africa
        • South Africa
      • By Function
      • By Ingredient Base
      • By Format
      • By Channel
      • By Tier
    • Market Attractiveness Analysis
      • By Country
      • By Function
      • By Ingredient Base
      • By Format
      • By Channel
      • By Tier
    • Key Takeaways
  17. Key Countries Market Analysis
    • USA
      • Pricing Analysis
      • Market Share Analysis, 2024
        • By Function
        • By Ingredient Base
        • By Format
        • By Channel
        • By Tier
    • Canada
      • Pricing Analysis
      • Market Share Analysis, 2024
        • By Function
        • By Ingredient Base
        • By Format
        • By Channel
        • By Tier
    • Brazil
      • Pricing Analysis
      • Market Share Analysis, 2024
        • By Function
        • By Ingredient Base
        • By Format
        • By Channel
        • By Tier
    • Mexico
      • Pricing Analysis
      • Market Share Analysis, 2024
        • By Function
        • By Ingredient Base
        • By Format
        • By Channel
        • By Tier
    • Colombia
      • Pricing Analysis
      • Market Share Analysis, 2024
        • By Function
        • By Ingredient Base
        • By Format
        • By Channel
        • By Tier
    • Germany
      • Pricing Analysis
      • Market Share Analysis, 2024
        • By Function
        • By Ingredient Base
        • By Format
        • By Channel
        • By Tier
    • UK
      • Pricing Analysis
      • Market Share Analysis, 2024
        • By Function
        • By Ingredient Base
        • By Format
        • By Channel
        • By Tier
    • France
      • Pricing Analysis
      • Market Share Analysis, 2024
        • By Function
        • By Ingredient Base
        • By Format
        • By Channel
        • By Tier
    • Italy
      • Pricing Analysis
      • Market Share Analysis, 2024
        • By Function
        • By Ingredient Base
        • By Format
        • By Channel
        • By Tier
    • Spain
      • Pricing Analysis
      • Market Share Analysis, 2024
        • By Function
        • By Ingredient Base
        • By Format
        • By Channel
        • By Tier
    • Belgium
      • Pricing Analysis
      • Market Share Analysis, 2024
        • By Function
        • By Ingredient Base
        • By Format
        • By Channel
        • By Tier
    • Netherlands
      • Pricing Analysis
      • Market Share Analysis, 2024
        • By Function
        • By Ingredient Base
        • By Format
        • By Channel
        • By Tier
    • Nordic
      • Pricing Analysis
      • Market Share Analysis, 2024
        • By Function
        • By Ingredient Base
        • By Format
        • By Channel
        • By Tier
    • Switzerland
      • Pricing Analysis
      • Market Share Analysis, 2024
        • By Function
        • By Ingredient Base
        • By Format
        • By Channel
        • By Tier
    • Russia
      • Pricing Analysis
      • Market Share Analysis, 2024
        • By Function
        • By Ingredient Base
        • By Format
        • By Channel
        • By Tier
    • Poland
      • Pricing Analysis
      • Market Share Analysis, 2024
        • By Function
        • By Ingredient Base
        • By Format
        • By Channel
        • By Tier
    • China
      • Pricing Analysis
      • Market Share Analysis, 2024
        • By Function
        • By Ingredient Base
        • By Format
        • By Channel
        • By Tier
    • Japan
      • Pricing Analysis
      • Market Share Analysis, 2024
        • By Function
        • By Ingredient Base
        • By Format
        • By Channel
        • By Tier
    • South Korea
      • Pricing Analysis
      • Market Share Analysis, 2024
        • By Function
        • By Ingredient Base
        • By Format
        • By Channel
        • By Tier
    • India
      • Pricing Analysis
      • Market Share Analysis, 2024
        • By Function
        • By Ingredient Base
        • By Format
        • By Channel
        • By Tier
    • Thailand
      • Pricing Analysis
      • Market Share Analysis, 2024
        • By Function
        • By Ingredient Base
        • By Format
        • By Channel
        • By Tier
    • Indonesia
      • Pricing Analysis
      • Market Share Analysis, 2024
        • By Function
        • By Ingredient Base
        • By Format
        • By Channel
        • By Tier
    • Australia
      • Pricing Analysis
      • Market Share Analysis, 2024
        • By Function
        • By Ingredient Base
        • By Format
        • By Channel
        • By Tier
    • New Zealand
      • Pricing Analysis
      • Market Share Analysis, 2024
        • By Function
        • By Ingredient Base
        • By Format
        • By Channel
        • By Tier
    • Turkey
      • Pricing Analysis
      • Market Share Analysis, 2024
        • By Function
        • By Ingredient Base
        • By Format
        • By Channel
        • By Tier
    • UAE
      • Pricing Analysis
      • Market Share Analysis, 2024
        • By Function
        • By Ingredient Base
        • By Format
        • By Channel
        • By Tier
    • Saudi Arabia
      • Pricing Analysis
      • Market Share Analysis, 2024
        • By Function
        • By Ingredient Base
        • By Format
        • By Channel
        • By Tier
    • Israel
      • Pricing Analysis
      • Market Share Analysis, 2024
        • By Function
        • By Ingredient Base
        • By Format
        • By Channel
        • By Tier
    • North Africa
      • Pricing Analysis
      • Market Share Analysis, 2024
        • By Function
        • By Ingredient Base
        • By Format
        • By Channel
        • By Tier
    • South Africa
      • Pricing Analysis
      • Market Share Analysis, 2024
        • By Function
        • By Ingredient Base
        • By Format
        • By Channel
        • By Tier
  18. Market Structure Analysis
    • Competition Dashboard
    • Competition Benchmarking
    • Market Share Analysis of Top Players
      • By Regional
      • By Function
      • By Ingredient Base
      • By Format
      • By Channel
      • By Tier
  19. Competition Analysis
    • Competition Deep Dive
      • The Inkey List
        • Overview
        • Product Portfolio
        • Profitability by Market Segments (Product/Age /Sales Channel/Region)
        • Sales Footprint
        • Strategy Overview
          • Marketing Strategy
          • Product Strategy
          • Channel Strategy
      • The Ordinary
        • Overview
        • Product Portfolio
        • Profitability by Market Segments (Product/Age /Sales Channel/Region)
        • Sales Footprint
        • Strategy Overview
          • Marketing Strategy
          • Product Strategy
          • Channel Strategy
      • Clinique
        • Overview
        • Product Portfolio
        • Profitability by Market Segments (Product/Age /Sales Channel/Region)
        • Sales Footprint
        • Strategy Overview
          • Marketing Strategy
          • Product Strategy
          • Channel Strategy
      • Estée Lauder
        • Overview
        • Product Portfolio
        • Profitability by Market Segments (Product/Age /Sales Channel/Region)
        • Sales Footprint
        • Strategy Overview
          • Marketing Strategy
          • Product Strategy
          • Channel Strategy
      • L’Oréal (Garnier)
        • Overview
        • Product Portfolio
        • Profitability by Market Segments (Product/Age /Sales Channel/Region)
        • Sales Footprint
        • Strategy Overview
          • Marketing Strategy
          • Product Strategy
          • Channel Strategy
      • Shiseido
        • Overview
        • Product Portfolio
        • Profitability by Market Segments (Product/Age /Sales Channel/Region)
        • Sales Footprint
        • Strategy Overview
          • Marketing Strategy
          • Product Strategy
          • Channel Strategy
      • Origins
        • Overview
        • Product Portfolio
        • Profitability by Market Segments (Product/Age /Sales Channel/Region)
        • Sales Footprint
        • Strategy Overview
          • Marketing Strategy
          • Product Strategy
          • Channel Strategy
      • Lacura
        • Overview
        • Product Portfolio
        • Profitability by Market Segments (Product/Age /Sales Channel/Region)
        • Sales Footprint
        • Strategy Overview
          • Marketing Strategy
          • Product Strategy
          • Channel Strategy
      • Rohto
        • Overview
        • Product Portfolio
        • Profitability by Market Segments (Product/Age /Sales Channel/Region)
        • Sales Footprint
        • Strategy Overview
          • Marketing Strategy
          • Product Strategy
          • Channel Strategy
      • Unilever
        • Overview
        • Product Portfolio
        • Profitability by Market Segments (Product/Age /Sales Channel/Region)
        • Sales Footprint
        • Strategy Overview
          • Marketing Strategy
          • Product Strategy
          • Channel Strategy
      • Others
        • Overview
        • Product Portfolio
        • Profitability by Market Segments (Product/Age /Sales Channel/Region)
        • Sales Footprint
        • Strategy Overview
          • Marketing Strategy
          • Product Strategy
          • Channel Strategy
  20. Assumptions & Acronyms Used
  21. Research Methodology

List of Tables

  • Table 1: Global Market Value (USD Million) Forecast by Region, 2020-2035
  • Table 2: Global Market Volume (Units) Forecast by Region, 2020-2035
  • Table 3: Global Market Value (USD Million) Forecast by Function, 2020-2035
  • Table 4: Global Market Volume (Units) Forecast by Function, 2020-2035
  • Table 5: Global Market Value (USD Million) Forecast by Ingredient Base, 2020-2035
  • Table 6: Global Market Volume (Units) Forecast by Ingredient Base, 2020-2035
  • Table 7: Global Market Value (USD Million) Forecast by Format, 2020-2035
  • Table 8: Global Market Volume (Units) Forecast by Format, 2020-2035
  • Table 9: Global Market Value (USD Million) Forecast by Channel, 2020-2035
  • Table 10: Global Market Volume (Units) Forecast by Channel, 2020-2035
  • Table 11: Global Market Value (USD Million) Forecast by Tier, 2020-2035
  • Table 12: Global Market Volume (Units) Forecast by Tier, 2020-2035
  • Table 13: North America Market Value (USD Million) Forecast by Country, 2020-2035
  • Table 14: North America Market Volume (Units) Forecast by Country, 2020-2035
  • Table 15: North America Market Value (USD Million) Forecast by Function, 2020-2035
  • Table 16: North America Market Volume (Units) Forecast by Function, 2020-2035
  • Table 17: North America Market Value (USD Million) Forecast by Ingredient Base, 2020-2035
  • Table 18: North America Market Volume (Units) Forecast by Ingredient Base, 2020-2035
  • Table 19: North America Market Value (USD Million) Forecast by Format, 2020-2035
  • Table 20: North America Market Volume (Units) Forecast by Format, 2020-2035
  • Table 21: North America Market Value (USD Million) Forecast by Channel, 2020-2035
  • Table 22: North America Market Volume (Units) Forecast by Channel, 2020-2035
  • Table 23: North America Market Value (USD Million) Forecast by Tier, 2020-2035
  • Table 24: North America Market Volume (Units) Forecast by Tier, 2020-2035
  • Table 25: Latin America Market Value (USD Million) Forecast by Country, 2020-2035
  • Table 26: Latin America Market Volume (Units) Forecast by Country, 2020-2035
  • Table 27: Latin America Market Value (USD Million) Forecast by Function, 2020-2035
  • Table 28: Latin America Market Volume (Units) Forecast by Function, 2020-2035
  • Table 29: Latin America Market Value (USD Million) Forecast by Ingredient Base, 2020-2035
  • Table 30: Latin America Market Volume (Units) Forecast by Ingredient Base, 2020-2035
  • Table 31: Latin America Market Value (USD Million) Forecast by Format, 2020-2035
  • Table 32: Latin America Market Volume (Units) Forecast by Format, 2020-2035
  • Table 33: Latin America Market Value (USD Million) Forecast by Channel, 2020-2035
  • Table 34: Latin America Market Volume (Units) Forecast by Channel, 2020-2035
  • Table 35: Latin America Market Value (USD Million) Forecast by Tier, 2020-2035
  • Table 36: Latin America Market Volume (Units) Forecast by Tier, 2020-2035
  • Table 37: Europe Market Value (USD Million) Forecast by Country, 2020-2035
  • Table 38: Europe Market Volume (Units) Forecast by Country, 2020-2035
  • Table 39: Europe Market Value (USD Million) Forecast by Function, 2020-2035
  • Table 40: Europe Market Volume (Units) Forecast by Function, 2020-2035
  • Table 41: Europe Market Value (USD Million) Forecast by Ingredient Base, 2020-2035
  • Table 42: Europe Market Volume (Units) Forecast by Ingredient Base, 2020-2035
  • Table 43: Europe Market Value (USD Million) Forecast by Format, 2020-2035
  • Table 44: Europe Market Volume (Units) Forecast by Format, 2020-2035
  • Table 45: Europe Market Value (USD Million) Forecast by Channel, 2020-2035
  • Table 46: Europe Market Volume (Units) Forecast by Channel, 2020-2035
  • Table 47: Europe Market Value (USD Million) Forecast by Tier, 2020-2035
  • Table 48: Europe Market Volume (Units) Forecast by Tier, 2020-2035
  • Table 49: East Asia Market Value (USD Million) Forecast by Country, 2020-2035
  • Table 50: East Asia Market Volume (Units) Forecast by Country, 2020-2035
  • Table 51: East Asia Market Value (USD Million) Forecast by Function, 2020-2035
  • Table 52: East Asia Market Volume (Units) Forecast by Function, 2020-2035
  • Table 53: East Asia Market Value (USD Million) Forecast by Ingredient Base, 2020-2035
  • Table 54: East Asia Market Volume (Units) Forecast by Ingredient Base, 2020-2035
  • Table 55: East Asia Market Value (USD Million) Forecast by Format, 2020-2035
  • Table 56: East Asia Market Volume (Units) Forecast by Format, 2020-2035
  • Table 57: East Asia Market Value (USD Million) Forecast by Channel, 2020-2035
  • Table 58: East Asia Market Volume (Units) Forecast by Channel, 2020-2035
  • Table 59: East Asia Market Value (USD Million) Forecast by Tier, 2020-2035
  • Table 60: East Asia Market Volume (Units) Forecast by Tier, 2020-2035
  • Table 61: South Asia & Pacific Market Value (USD Million) Forecast by Country, 2020-2035
  • Table 62: South Asia & Pacific Market Volume (Units) Forecast by Country, 2020-2035
  • Table 63: South Asia & Pacific Market Value (USD Million) Forecast by Function, 2020-2035
  • Table 64: South Asia & Pacific Market Volume (Units) Forecast by Function, 2020-2035
  • Table 65: South Asia & Pacific Market Value (USD Million) Forecast by Ingredient Base, 2020-2035
  • Table 66: South Asia & Pacific Market Volume (Units) Forecast by Ingredient Base, 2020-2035
  • Table 67: South Asia & Pacific Market Value (USD Million) Forecast by Format, 2020-2035
  • Table 68: South Asia & Pacific Market Volume (Units) Forecast by Format, 2020-2035
  • Table 69: South Asia & Pacific Market Value (USD Million) Forecast by Channel, 2020-2035
  • Table 70: South Asia & Pacific Market Volume (Units) Forecast by Channel, 2020-2035
  • Table 71: South Asia & Pacific Market Value (USD Million) Forecast by Tier, 2020-2035
  • Table 72: South Asia & Pacific Market Volume (Units) Forecast by Tier, 2020-2035
  • Table 73: Middle East and Africa Market Value (USD Million) Forecast by Country, 2020-2035
  • Table 74: Middle East and Africa Market Volume (Units) Forecast by Country, 2020-2035
  • Table 75: Middle East and Africa Market Value (USD Million) Forecast by Function, 2020-2035
  • Table 76: Middle East and Africa Market Volume (Units) Forecast by Function, 2020-2035
  • Table 77: Middle East and Africa Market Value (USD Million) Forecast by Ingredient Base, 2020-2035
  • Table 78: Middle East and Africa Market Volume (Units) Forecast by Ingredient Base, 2020-2035
  • Table 79: Middle East and Africa Market Value (USD Million) Forecast by Format, 2020-2035
  • Table 80: Middle East and Africa Market Volume (Units) Forecast by Format, 2020-2035
  • Table 81: Middle East and Africa Market Value (USD Million) Forecast by Channel, 2020-2035
  • Table 82: Middle East and Africa Market Volume (Units) Forecast by Channel, 2020-2035
  • Table 83: Middle East and Africa Market Value (USD Million) Forecast by Tier, 2020-2035
  • Table 84: Middle East and Africa Market Volume (Units) Forecast by Tier, 2020-2035

List of Figures

  • Figure 1: Global Market Value (USD Million) by Function, 2025-2035
  • Figure 2: Global Market Value (USD Million) by Ingredient Base, 2025-2035
  • Figure 3: Global Market Value (USD Million) by Format, 2025-2035
  • Figure 4: Global Market Value (USD Million) by Channel, 2025-2035
  • Figure 5: Global Market Value (USD Million) by Tier, 2025-2035
  • Figure 6: Global Market Value (USD Million) by Region, 2025-2035
  • Figure 7: Global Market Value (USD Million) Analysis by Region, 2020-2035
  • Figure 8: Global Market Volume (Units) Analysis by Region, 2020-2035
  • Figure 9: Global Market Value Share (%) and BPS Analysis by Region, 2025-2035
  • Figure 10: Global Market Y-o-Y Growth (%) Projections by Region, 2025-2035
  • Figure 11: Global Market Value (USD Million) Analysis by Function, 2020-2035
  • Figure 12: Global Market Volume (Units) Analysis by Function, 2020-2035
  • Figure 13: Global Market Value Share (%) and BPS Analysis by Function, 2025-2035
  • Figure 14: Global Market Y-o-Y Growth (%) Projections by Function, 2025-2035
  • Figure 15: Global Market Value (USD Million) Analysis by Ingredient Base, 2020-2035
  • Figure 16: Global Market Volume (Units) Analysis by Ingredient Base, 2020-2035
  • Figure 17: Global Market Value Share (%) and BPS Analysis by Ingredient Base, 2025-2035
  • Figure 18: Global Market Y-o-Y Growth (%) Projections by Ingredient Base, 2025-2035
  • Figure 19: Global Market Value (USD Million) Analysis by Format, 2020-2035
  • Figure 20: Global Market Volume (Units) Analysis by Format, 2020-2035
  • Figure 21: Global Market Value Share (%) and BPS Analysis by Format, 2025-2035
  • Figure 22: Global Market Y-o-Y Growth (%) Projections by Format, 2025-2035
  • Figure 23: Global Market Value (USD Million) Analysis by Channel, 2020-2035
  • Figure 24: Global Market Volume (Units) Analysis by Channel, 2020-2035
  • Figure 25: Global Market Value Share (%) and BPS Analysis by Channel, 2025-2035
  • Figure 26: Global Market Y-o-Y Growth (%) Projections by Channel, 2025-2035
  • Figure 27: Global Market Value (USD Million) Analysis by Tier, 2020-2035
  • Figure 28: Global Market Volume (Units) Analysis by Tier, 2020-2035
  • Figure 29: Global Market Value Share (%) and BPS Analysis by Tier, 2025-2035
  • Figure 30: Global Market Y-o-Y Growth (%) Projections by Tier, 2025-2035
  • Figure 31: Global Market Attractiveness by Function, 2025-2035
  • Figure 32: Global Market Attractiveness by Ingredient Base, 2025-2035
  • Figure 33: Global Market Attractiveness by Format, 2025-2035
  • Figure 34: Global Market Attractiveness by Channel, 2025-2035
  • Figure 35: Global Market Attractiveness by Tier, 2025-2035
  • Figure 36: Global Market Attractiveness by Region, 2025-2035
  • Figure 37: North America Market Value (USD Million) by Function, 2025-2035
  • Figure 38: North America Market Value (USD Million) by Ingredient Base, 2025-2035
  • Figure 39: North America Market Value (USD Million) by Format, 2025-2035
  • Figure 40: North America Market Value (USD Million) by Channel, 2025-2035
  • Figure 41: North America Market Value (USD Million) by Tier, 2025-2035
  • Figure 42: North America Market Value (USD Million) by Country, 2025-2035
  • Figure 43: North America Market Value (USD Million) Analysis by Country, 2020-2035
  • Figure 44: North America Market Volume (Units) Analysis by Country, 2020-2035
  • Figure 45: North America Market Value Share (%) and BPS Analysis by Country, 2025-2035
  • Figure 46: North America Market Y-o-Y Growth (%) Projections by Country, 2025-2035
  • Figure 47: North America Market Value (USD Million) Analysis by Function, 2020-2035
  • Figure 48: North America Market Volume (Units) Analysis by Function, 2020-2035
  • Figure 49: North America Market Value Share (%) and BPS Analysis by Function, 2025-2035
  • Figure 50: North America Market Y-o-Y Growth (%) Projections by Function, 2025-2035
  • Figure 51: North America Market Value (USD Million) Analysis by Ingredient Base, 2020-2035
  • Figure 52: North America Market Volume (Units) Analysis by Ingredient Base, 2020-2035
  • Figure 53: North America Market Value Share (%) and BPS Analysis by Ingredient Base, 2025-2035
  • Figure 54: North America Market Y-o-Y Growth (%) Projections by Ingredient Base, 2025-2035
  • Figure 55: North America Market Value (USD Million) Analysis by Format, 2020-2035
  • Figure 56: North America Market Volume (Units) Analysis by Format, 2020-2035
  • Figure 57: North America Market Value Share (%) and BPS Analysis by Format, 2025-2035
  • Figure 58: North America Market Y-o-Y Growth (%) Projections by Format, 2025-2035
  • Figure 59: North America Market Value (USD Million) Analysis by Channel, 2020-2035
  • Figure 60: North America Market Volume (Units) Analysis by Channel, 2020-2035
  • Figure 61: North America Market Value Share (%) and BPS Analysis by Channel, 2025-2035
  • Figure 62: North America Market Y-o-Y Growth (%) Projections by Channel, 2025-2035
  • Figure 63: North America Market Value (USD Million) Analysis by Tier, 2020-2035
  • Figure 64: North America Market Volume (Units) Analysis by Tier, 2020-2035
  • Figure 65: North America Market Value Share (%) and BPS Analysis by Tier, 2025-2035
  • Figure 66: North America Market Y-o-Y Growth (%) Projections by Tier, 2025-2035
  • Figure 67: North America Market Attractiveness by Function, 2025-2035
  • Figure 68: North America Market Attractiveness by Ingredient Base, 2025-2035
  • Figure 69: North America Market Attractiveness by Format, 2025-2035
  • Figure 70: North America Market Attractiveness by Channel, 2025-2035
  • Figure 71: North America Market Attractiveness by Tier, 2025-2035
  • Figure 72: North America Market Attractiveness by Country, 2025-2035
  • Figure 73: Latin America Market Value (USD Million) by Function, 2025-2035
  • Figure 74: Latin America Market Value (USD Million) by Ingredient Base, 2025-2035
  • Figure 75: Latin America Market Value (USD Million) by Format, 2025-2035
  • Figure 76: Latin America Market Value (USD Million) by Channel, 2025-2035
  • Figure 77: Latin America Market Value (USD Million) by Tier, 2025-2035
  • Figure 78: Latin America Market Value (USD Million) by Country, 2025-2035
  • Figure 79: Latin America Market Value (USD Million) Analysis by Country, 2020-2035
  • Figure 80: Latin America Market Volume (Units) Analysis by Country, 2020-2035
  • Figure 81: Latin America Market Value Share (%) and BPS Analysis by Country, 2025-2035
  • Figure 82: Latin America Market Y-o-Y Growth (%) Projections by Country, 2025-2035
  • Figure 83: Latin America Market Value (USD Million) Analysis by Function, 2020-2035
  • Figure 84: Latin America Market Volume (Units) Analysis by Function, 2020-2035
  • Figure 85: Latin America Market Value Share (%) and BPS Analysis by Function, 2025-2035
  • Figure 86: Latin America Market Y-o-Y Growth (%) Projections by Function, 2025-2035
  • Figure 87: Latin America Market Value (USD Million) Analysis by Ingredient Base, 2020-2035
  • Figure 88: Latin America Market Volume (Units) Analysis by Ingredient Base, 2020-2035
  • Figure 89: Latin America Market Value Share (%) and BPS Analysis by Ingredient Base, 2025-2035
  • Figure 90: Latin America Market Y-o-Y Growth (%) Projections by Ingredient Base, 2025-2035
  • Figure 91: Latin America Market Value (USD Million) Analysis by Format, 2020-2035
  • Figure 92: Latin America Market Volume (Units) Analysis by Format, 2020-2035
  • Figure 93: Latin America Market Value Share (%) and BPS Analysis by Format, 2025-2035
  • Figure 94: Latin America Market Y-o-Y Growth (%) Projections by Format, 2025-2035
  • Figure 95: Latin America Market Value (USD Million) Analysis by Channel, 2020-2035
  • Figure 96: Latin America Market Volume (Units) Analysis by Channel, 2020-2035
  • Figure 97: Latin America Market Value Share (%) and BPS Analysis by Channel, 2025-2035
  • Figure 98: Latin America Market Y-o-Y Growth (%) Projections by Channel, 2025-2035
  • Figure 99: Latin America Market Value (USD Million) Analysis by Tier, 2020-2035
  • Figure 100: Latin America Market Volume (Units) Analysis by Tier, 2020-2035
  • Figure 101: Latin America Market Value Share (%) and BPS Analysis by Tier, 2025-2035
  • Figure 102: Latin America Market Y-o-Y Growth (%) Projections by Tier, 2025-2035
  • Figure 103: Latin America Market Attractiveness by Function, 2025-2035
  • Figure 104: Latin America Market Attractiveness by Ingredient Base, 2025-2035
  • Figure 105: Latin America Market Attractiveness by Format, 2025-2035
  • Figure 106: Latin America Market Attractiveness by Channel, 2025-2035
  • Figure 107: Latin America Market Attractiveness by Tier, 2025-2035
  • Figure 108: Latin America Market Attractiveness by Country, 2025-2035
  • Figure 109: Europe Market Value (USD Million) by Function, 2025-2035
  • Figure 110: Europe Market Value (USD Million) by Ingredient Base, 2025-2035
  • Figure 111: Europe Market Value (USD Million) by Format, 2025-2035
  • Figure 112: Europe Market Value (USD Million) by Channel, 2025-2035
  • Figure 113: Europe Market Value (USD Million) by Tier, 2025-2035
  • Figure 114: Europe Market Value (USD Million) by Country, 2025-2035
  • Figure 115: Europe Market Value (USD Million) Analysis by Country, 2020-2035
  • Figure 116: Europe Market Volume (Units) Analysis by Country, 2020-2035
  • Figure 117: Europe Market Value Share (%) and BPS Analysis by Country, 2025-2035
  • Figure 118: Europe Market Y-o-Y Growth (%) Projections by Country, 2025-2035
  • Figure 119: Europe Market Value (USD Million) Analysis by Function, 2020-2035
  • Figure 120: Europe Market Volume (Units) Analysis by Function, 2020-2035
  • Figure 121: Europe Market Value Share (%) and BPS Analysis by Function, 2025-2035
  • Figure 122: Europe Market Y-o-Y Growth (%) Projections by Function, 2025-2035
  • Figure 123: Europe Market Value (USD Million) Analysis by Ingredient Base, 2020-2035
  • Figure 124: Europe Market Volume (Units) Analysis by Ingredient Base, 2020-2035
  • Figure 125: Europe Market Value Share (%) and BPS Analysis by Ingredient Base, 2025-2035
  • Figure 126: Europe Market Y-o-Y Growth (%) Projections by Ingredient Base, 2025-2035
  • Figure 127: Europe Market Value (USD Million) Analysis by Format, 2020-2035
  • Figure 128: Europe Market Volume (Units) Analysis by Format, 2020-2035
  • Figure 129: Europe Market Value Share (%) and BPS Analysis by Format, 2025-2035
  • Figure 130: Europe Market Y-o-Y Growth (%) Projections by Format, 2025-2035
  • Figure 131: Europe Market Value (USD Million) Analysis by Channel, 2020-2035
  • Figure 132: Europe Market Volume (Units) Analysis by Channel, 2020-2035
  • Figure 133: Europe Market Value Share (%) and BPS Analysis by Channel, 2025-2035
  • Figure 134: Europe Market Y-o-Y Growth (%) Projections by Channel, 2025-2035
  • Figure 135: Europe Market Value (USD Million) Analysis by Tier, 2020-2035
  • Figure 136: Europe Market Volume (Units) Analysis by Tier, 2020-2035
  • Figure 137: Europe Market Value Share (%) and BPS Analysis by Tier, 2025-2035
  • Figure 138: Europe Market Y-o-Y Growth (%) Projections by Tier, 2025-2035
  • Figure 139: Europe Market Attractiveness by Function, 2025-2035
  • Figure 140: Europe Market Attractiveness by Ingredient Base, 2025-2035
  • Figure 141: Europe Market Attractiveness by Format, 2025-2035
  • Figure 142: Europe Market Attractiveness by Channel, 2025-2035
  • Figure 143: Europe Market Attractiveness by Tier, 2025-2035
  • Figure 144: Europe Market Attractiveness by Country, 2025-2035
  • Figure 145: East Asia Market Value (USD Million) by Function, 2025-2035
  • Figure 146: East Asia Market Value (USD Million) by Ingredient Base, 2025-2035
  • Figure 147: East Asia Market Value (USD Million) by Format, 2025-2035
  • Figure 148: East Asia Market Value (USD Million) by Channel, 2025-2035
  • Figure 149: East Asia Market Value (USD Million) by Tier, 2025-2035
  • Figure 150: East Asia Market Value (USD Million) by Country, 2025-2035
  • Figure 151: East Asia Market Value (USD Million) Analysis by Country, 2020-2035
  • Figure 152: East Asia Market Volume (Units) Analysis by Country, 2020-2035
  • Figure 153: East Asia Market Value Share (%) and BPS Analysis by Country, 2025-2035
  • Figure 154: East Asia Market Y-o-Y Growth (%) Projections by Country, 2025-2035
  • Figure 155: East Asia Market Value (USD Million) Analysis by Function, 2020-2035
  • Figure 156: East Asia Market Volume (Units) Analysis by Function, 2020-2035
  • Figure 157: East Asia Market Value Share (%) and BPS Analysis by Function, 2025-2035
  • Figure 158: East Asia Market Y-o-Y Growth (%) Projections by Function, 2025-2035
  • Figure 159: East Asia Market Value (USD Million) Analysis by Ingredient Base, 2020-2035
  • Figure 160: East Asia Market Volume (Units) Analysis by Ingredient Base, 2020-2035
  • Figure 161: East Asia Market Value Share (%) and BPS Analysis by Ingredient Base, 2025-2035
  • Figure 162: East Asia Market Y-o-Y Growth (%) Projections by Ingredient Base, 2025-2035
  • Figure 163: East Asia Market Value (USD Million) Analysis by Format, 2020-2035
  • Figure 164: East Asia Market Volume (Units) Analysis by Format, 2020-2035
  • Figure 165: East Asia Market Value Share (%) and BPS Analysis by Format, 2025-2035
  • Figure 166: East Asia Market Y-o-Y Growth (%) Projections by Format, 2025-2035
  • Figure 167: East Asia Market Value (USD Million) Analysis by Channel, 2020-2035
  • Figure 168: East Asia Market Volume (Units) Analysis by Channel, 2020-2035
  • Figure 169: East Asia Market Value Share (%) and BPS Analysis by Channel, 2025-2035
  • Figure 170: East Asia Market Y-o-Y Growth (%) Projections by Channel, 2025-2035
  • Figure 171: East Asia Market Value (USD Million) Analysis by Tier, 2020-2035
  • Figure 172: East Asia Market Volume (Units) Analysis by Tier, 2020-2035
  • Figure 173: East Asia Market Value Share (%) and BPS Analysis by Tier, 2025-2035
  • Figure 174: East Asia Market Y-o-Y Growth (%) Projections by Tier, 2025-2035
  • Figure 175: East Asia Market Attractiveness by Function, 2025-2035
  • Figure 176: East Asia Market Attractiveness by Ingredient Base, 2025-2035
  • Figure 177: East Asia Market Attractiveness by Format, 2025-2035
  • Figure 178: East Asia Market Attractiveness by Channel, 2025-2035
  • Figure 179: East Asia Market Attractiveness by Tier, 2025-2035
  • Figure 180: East Asia Market Attractiveness by Country, 2025-2035
  • Figure 181: South Asia & Pacific Market Value (USD Million) by Function, 2025-2035
  • Figure 182: South Asia & Pacific Market Value (USD Million) by Ingredient Base, 2025-2035
  • Figure 183: South Asia & Pacific Market Value (USD Million) by Format, 2025-2035
  • Figure 184: South Asia & Pacific Market Value (USD Million) by Channel, 2025-2035
  • Figure 185: South Asia & Pacific Market Value (USD Million) by Tier, 2025-2035
  • Figure 186: South Asia & Pacific Market Value (USD Million) by Country, 2025-2035
  • Figure 187: South Asia & Pacific Market Value (USD Million) Analysis by Country, 2020-2035
  • Figure 188: South Asia & Pacific Market Volume (Units) Analysis by Country, 2020-2035
  • Figure 189: South Asia & Pacific Market Value Share (%) and BPS Analysis by Country, 2025-2035
  • Figure 190: South Asia & Pacific Market Y-o-Y Growth (%) Projections by Country, 2025-2035
  • Figure 191: South Asia & Pacific Market Value (USD Million) Analysis by Function, 2020-2035
  • Figure 192: South Asia & Pacific Market Volume (Units) Analysis by Function, 2020-2035
  • Figure 193: South Asia & Pacific Market Value Share (%) and BPS Analysis by Function, 2025-2035
  • Figure 194: South Asia & Pacific Market Y-o-Y Growth (%) Projections by Function, 2025-2035
  • Figure 195: South Asia & Pacific Market Value (USD Million) Analysis by Ingredient Base, 2020-2035
  • Figure 196: South Asia & Pacific Market Volume (Units) Analysis by Ingredient Base, 2020-2035
  • Figure 197: South Asia & Pacific Market Value Share (%) and BPS Analysis by Ingredient Base, 2025-2035
  • Figure 198: South Asia & Pacific Market Y-o-Y Growth (%) Projections by Ingredient Base, 2025-2035
  • Figure 199: South Asia & Pacific Market Value (USD Million) Analysis by Format, 2020-2035
  • Figure 200: South Asia & Pacific Market Volume (Units) Analysis by Format, 2020-2035
  • Figure 201: South Asia & Pacific Market Value Share (%) and BPS Analysis by Format, 2025-2035
  • Figure 202: South Asia & Pacific Market Y-o-Y Growth (%) Projections by Format, 2025-2035
  • Figure 203: South Asia & Pacific Market Value (USD Million) Analysis by Channel, 2020-2035
  • Figure 204: South Asia & Pacific Market Volume (Units) Analysis by Channel, 2020-2035
  • Figure 205: South Asia & Pacific Market Value Share (%) and BPS Analysis by Channel, 2025-2035
  • Figure 206: South Asia & Pacific Market Y-o-Y Growth (%) Projections by Channel, 2025-2035
  • Figure 207: South Asia & Pacific Market Value (USD Million) Analysis by Tier, 2020-2035
  • Figure 208: South Asia & Pacific Market Volume (Units) Analysis by Tier, 2020-2035
  • Figure 209: South Asia & Pacific Market Value Share (%) and BPS Analysis by Tier, 2025-2035
  • Figure 210: South Asia & Pacific Market Y-o-Y Growth (%) Projections by Tier, 2025-2035
  • Figure 211: South Asia & Pacific Market Attractiveness by Function, 2025-2035
  • Figure 212: South Asia & Pacific Market Attractiveness by Ingredient Base, 2025-2035
  • Figure 213: South Asia & Pacific Market Attractiveness by Format, 2025-2035
  • Figure 214: South Asia & Pacific Market Attractiveness by Channel, 2025-2035
  • Figure 215: South Asia & Pacific Market Attractiveness by Tier, 2025-2035
  • Figure 216: South Asia & Pacific Market Attractiveness by Country, 2025-2035
  • Figure 217: Middle East and Africa Market Value (USD Million) by Function, 2025-2035
  • Figure 218: Middle East and Africa Market Value (USD Million) by Ingredient Base, 2025-2035
  • Figure 219: Middle East and Africa Market Value (USD Million) by Format, 2025-2035
  • Figure 220: Middle East and Africa Market Value (USD Million) by Channel, 2025-2035
  • Figure 221: Middle East and Africa Market Value (USD Million) by Tier, 2025-2035
  • Figure 222: Middle East and Africa Market Value (USD Million) by Country, 2025-2035
  • Figure 223: Middle East and Africa Market Value (USD Million) Analysis by Country, 2020-2035
  • Figure 224: Middle East and Africa Market Volume (Units) Analysis by Country, 2020-2035
  • Figure 225: Middle East and Africa Market Value Share (%) and BPS Analysis by Country, 2025-2035
  • Figure 226: Middle East and Africa Market Y-o-Y Growth (%) Projections by Country, 2025-2035
  • Figure 227: Middle East and Africa Market Value (USD Million) Analysis by Function, 2020-2035
  • Figure 228: Middle East and Africa Market Volume (Units) Analysis by Function, 2020-2035
  • Figure 229: Middle East and Africa Market Value Share (%) and BPS Analysis by Function, 2025-2035
  • Figure 230: Middle East and Africa Market Y-o-Y Growth (%) Projections by Function, 2025-2035
  • Figure 231: Middle East and Africa Market Value (USD Million) Analysis by Ingredient Base, 2020-2035
  • Figure 232: Middle East and Africa Market Volume (Units) Analysis by Ingredient Base, 2020-2035
  • Figure 233: Middle East and Africa Market Value Share (%) and BPS Analysis by Ingredient Base, 2025-2035
  • Figure 234: Middle East and Africa Market Y-o-Y Growth (%) Projections by Ingredient Base, 2025-2035
  • Figure 235: Middle East and Africa Market Value (USD Million) Analysis by Format, 2020-2035
  • Figure 236: Middle East and Africa Market Volume (Units) Analysis by Format, 2020-2035
  • Figure 237: Middle East and Africa Market Value Share (%) and BPS Analysis by Format, 2025-2035
  • Figure 238: Middle East and Africa Market Y-o-Y Growth (%) Projections by Format, 2025-2035
  • Figure 239: Middle East and Africa Market Value (USD Million) Analysis by Channel, 2020-2035
  • Figure 240: Middle East and Africa Market Volume (Units) Analysis by Channel, 2020-2035
  • Figure 241: Middle East and Africa Market Value Share (%) and BPS Analysis by Channel, 2025-2035
  • Figure 242: Middle East and Africa Market Y-o-Y Growth (%) Projections by Channel, 2025-2035
  • Figure 243: Middle East and Africa Market Value (USD Million) Analysis by Tier, 2020-2035
  • Figure 244: Middle East and Africa Market Volume (Units) Analysis by Tier, 2020-2035
  • Figure 245: Middle East and Africa Market Value Share (%) and BPS Analysis by Tier, 2025-2035
  • Figure 246: Middle East and Africa Market Y-o-Y Growth (%) Projections by Tier, 2025-2035
  • Figure 247: Middle East and Africa Market Attractiveness by Function, 2025-2035
  • Figure 248: Middle East and Africa Market Attractiveness by Ingredient Base, 2025-2035
  • Figure 249: Middle East and Africa Market Attractiveness by Format, 2025-2035
  • Figure 250: Middle East and Africa Market Attractiveness by Channel, 2025-2035
  • Figure 251: Middle East and Africa Market Attractiveness by Tier, 2025-2035
  • Figure 252: Middle East and Africa Market Attractiveness by Country, 2025-2035

Frequently Asked Questions

How big is the Caffeine-Infused Serums Market in 2025?

The global Caffeine-Infused Serums Market is estimated to be valued at USD 1,413.2 million in 2025.

What will be the size of the Caffeine-Infused Serums Market in 2035?

The market size for the Caffeine-Infused Serums Market is projected to reach USD 4,310.1 million by 2035.

How much will the Caffeine-Infused Serums Market grow between 2025 and 2035?

The Caffeine-Infused Serums Market is expected to expand at a CAGR of 11.8% between 2025 and 2035, adding nearly USD 2,896.9 million in incremental value.

What are the key product types in the Caffeine-Infused Serums Market?

The key product types in the Caffeine-Infused Serums Market include eye serums, face serums, roll-ons, and ampoules, catering to functions such as anti-puffiness, brightening, and anti-dark circles.

Which segment will contribute a significant share in the Caffeine-Infused Serums Market in 2025?

In terms of format, eye serums are projected to command 48.5% share in 2025, equivalent to USD 679.1 million, making them one of the most influential categories.

Explore Similar Insights

Future Market Insights

Caffeine-Infused Serums Market

Chat With

MaRIA

Hi There, I am MaRIA, Your Market Research Intelligence Assistant. How may I help you?