Alpha Hydroxy Acid (AHA) Serums Market Size and Share Forecast Outlook 2025 to 2035

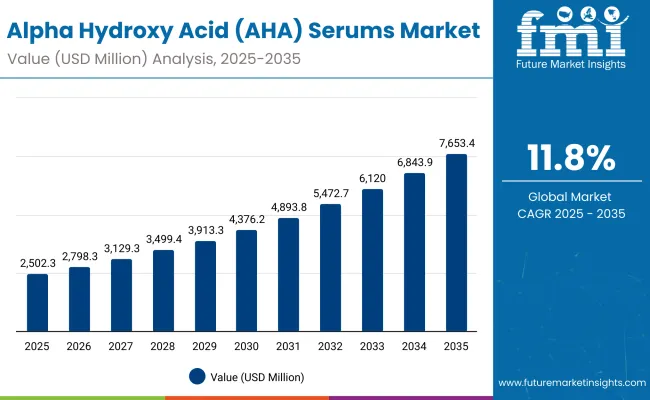
The global Alpha Hydroxy Acid (AHA) Serums Market is expected to record a valuation of USD 2,502.3 million in 2025 and USD 7,653.4 million in 2035, with an increase of USD 5,151.1 million, which equals a growth of more than 205% over the decade. The overall expansion represents a CAGR of 11.8% and a 3X increase in market size.
Quick Stats for Global Alpha Hydroxy Acid (AHA) Serums Market

  • Global AHA Serums Market Value (2025): USD 2,502.3 million
  • Global AHA Serums Market Forecast Value (2035): USD 7,653.4 million
  • Global AHA Serums Market Forecast CAGR: 11.8%
  • Leading Segment in Global AHA Serums Market in 2025: Glycolic acid (48%)
  • Key Growth Regions in the Global AHA Serums Market: East Asia, South Asia & Pacific, North America, Europe
  • Top Key Players in Global AHA Serums Market: The Ordinary, Paula’s Choice, Pixi, Sunday Riley, Murad, L’Oréal Paris, Drunk Elephant, Glow Recipe, La Roche-Posay, COSRX

Alpha Hydroxy Acid Aha Serums Market Value Analysis

Global Alpha Hydroxy Acid (AHA) Serums Market Key Takeaways

Metric Value
Global AHA Serums Market Estimated Value in (2025E) USD 2,502.3 million
Global AHA Serums Market Forecast Value in (2035F) USD 7,653.4 million
Forecast CAGR (2025 to 2035) 11.8%

During the first five-year period from 2025 to 2030, the market increases from USD 2,502.3 million to USD 4,376.2 million, adding USD 1,873.9 million, which accounts for 36% of the total decade growth. This phase records steady adoption in exfoliation-focused skincare, dermatologist-prescribed acne treatments, and anti-aging formulations, driven by rising consumer awareness about skin renewal. Glycolic acid dominates this period as it caters to over 48% of formulations, particularly in water-based serums and gel serums designed for daily consumer use.

The second half from 2030 to 2035 contributes USD 3,277.2 million, equal to 64% of total growth, as the market jumps from USD 4,376.2 million to USD 7,653.4 million. This acceleration is powered by widespread deployment of medium to high-concentration AHA serums, integration of AHA blends with niacinamide and peptides, and strong e-commerce adoption as the primary channel for direct-to-consumer beauty sales.

Multi-functional formulations targeting brightening, anti-aging, and blemish control together capture a larger share above 55% by the end of the decade. Clean-label and vegan claims rise significantly, increasing their influence beyond 30% of marketed SKUs in total value.

From 2020 to 2024, the global Alpha Hydroxy Acid (AHA) Serums Market grew steadily from under USD 2,000 million to close to USD 2,500 million, driven by product innovation in water-based glycolic and lactic acid serums. During this period, the competitive landscape was dominated by specialized skincare brands controlling nearly 60% of revenue, with leaders such as The Ordinary, Paula’s Choice, and Pixi focusing on affordable yet highly effective formulations.

Competitive differentiation relied on concentration levels, claim-based marketing (fragrance-free, dermatologist-tested), and suitability for sensitive skin. Premium players like Drunk Elephant and Sunday Riley emphasized clean-label positioning and sustainability-driven packaging. Service-based personalization models had limited penetration, accounting for less than 10% of the total market value.

Demand for AHA serums will expand to USD 2,502.3 million in 2025, and the revenue mix will shift as blended AHA formulations, multi-functional claims, and e-commerce platforms grow to over 45% share. Traditional leaders face rising competition from K-beauty and J-beauty players offering customized AHA blends and subscription-based delivery.

Major global brands are pivoting to hybrid models, integrating dermatologist-backed claims with digital skin analysis apps to retain consumer trust. Emerging entrants specializing in vegan-certified, microbiome-friendly AHA formulations are gaining share. The competitive advantage is moving away from single-acid innovation alone to portfolio breadth, omnichannel presence, and loyalty-driven recurring sales streams.

Why the Global Alpha Hydroxy Acid (AHA) Serums Market is Growing?

Advances in skincare formulation technologies have improved stability and delivery of AHA molecules, allowing for more efficient skin penetration and reduced irritation. Glycolic acid has gained popularity due to its ability to target fine lines and uneven texture, while lactic and mandelic acid are widely adopted for sensitive skin and acne-prone consumers.

The rise of dermatologist-backed formulations has contributed to enhanced credibility, enabling broader retail adoption. Industries such as beauty retail, dermatology clinics, and online skincare platforms are driving demand for AHA serums that integrate seamlessly into daily skincare routines.

Expansion of anti-aging and brightening-focused regimens has fueled market growth. Innovations in capsule-based ampoules, high-strength peeling solutions, and hybrid formulations (combining AHA with PHA or BHA) are expected to open new application areas.

Segment growth is expected to be led by glycolic acid, exfoliation & resurfacing functions, and water-based serums due to their high precision in skin renewal and adaptability across age groups. E-commerce remains a critical driver, pushing growth in both premium and affordable product lines, supported by influencer-led marketing and subscription-based replenishment services.

Segmental Analysis

By AHA Type, categories include glycolic acid, lactic acid, mandelic acid, citric acid, and blended AHAs, highlighting the core active ingredients driving adoption across different consumer segments. Glycolic acid dominates due to its high efficacy in exfoliation, while lactic and mandelic acid cater to sensitive skin users.

By Function, classification covers exfoliation & resurfacing, brightening, acne/blemish treatment, and anti-aging & wrinkle reduction to address diverse skincare needs. Exfoliation & resurfacing is the largest function category, reflecting consumer demand for visible skin renewal, while brightening and acne treatments show strong adoption among younger demographics. Anti-aging functions drive premium product demand across developed markets. By Product Type, categories encompass water-based serums, gel serums, ampoules, and exfoliating essence/toners, representing both traditional and advanced skincare formats.

Water-based serums dominate the product mix, while ampoules and essence-toners are increasingly favored in Asia-Pacific markets for their lightweight textures and convenience. Gel serums find strong adoption among oil-control and acne-care routines. By Concentration, ranges include low strength (<5%), medium strength (5-10%), and high strength (>10%) to cater to consumer tolerance levels. Low-strength serums are preferred by first-time users and sensitive-skin segments, while medium-strength formulations remain the most widely adopted for daily routines.

By Channel, segmentation includes e-commerce, pharmacies/drugstores, specialty beauty retail, and mass retail, capturing diverse purchasing behavior. E-commerce has emerged as the fastest-growing channel globally, while pharmacies and specialty beauty retailers maintain strong shares due to dermatologist trust and premium positioning.

y Claim, classifications feature fragrance-free, dermatologist-tested, clean-label, and vegan, reflecting rising consumer demand for safer and sustainable options. By Geography, the scope spans North America, Latin America, Europe, East Asia, South Asia & Pacific, and the Middle East & Africa. North America and Europe remain mature but innovation-driven markets, while East Asia and South Asia & Pacific emerge as the fastest-growing regions, led by China and India.
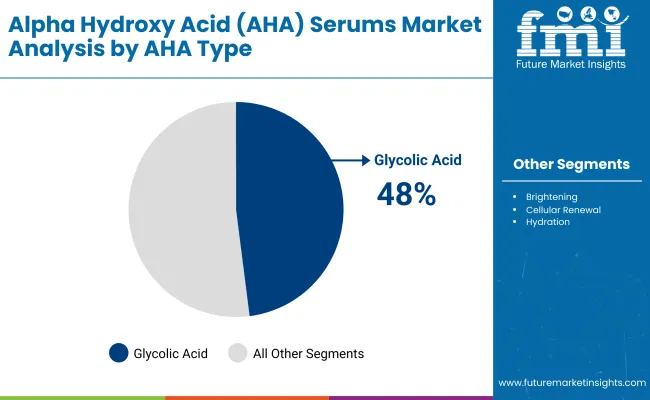
Insights into the AHA Type Segment with Glycolic Acid Leading in Market Share

Alpha Hydroxy Acid Aha Serums Market By Aha Type

AHA Type Value Share % 2025
Glycolic acid 48%
Others 52.0%

The glycolic acid segment is projected to contribute 48% of the global Alpha Hydroxy Acid (AHA) Serums Market revenue in 2025, maintaining its lead as the dominant AHA category. This leadership is driven by ongoing consumer demand for glycolic acid’s superior exfoliation capabilities, which improve cell turnover, smooth texture, and reduce hyperpigmentation. Brands across mass, premium, and clinical ranges prioritize glycolic acid formulations because of their proven efficacy and strong consumer recognition.

The segment’s growth is also supported by the availability of glycolic acid serums in multiple concentrations ranging from low-strength daily solutions to professional-grade peels. As clean-label formulations and dermatologist-tested products gain importance, glycolic acid continues to be reformulated into gentler, more stable water-based serums and hybrid blends. This balance of effectiveness and adaptability has solidified glycolic acid’s position as the backbone of the AHA serums category globally.
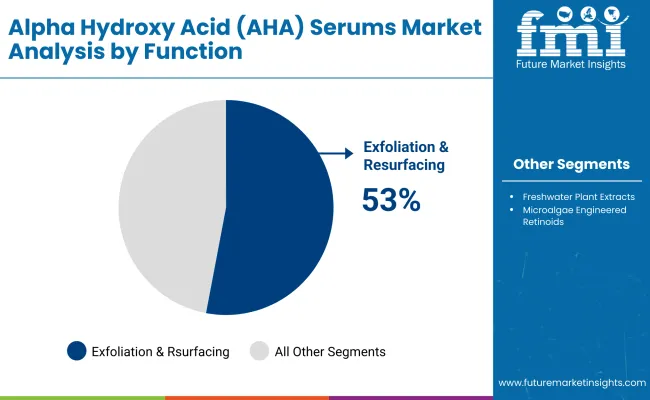
Insights into the Function Segment with Exfoliation & Resurfacing Dominating the Demand

Alpha Hydroxy Acid Aha Serums Market By Function

Function Value Share % 2025
Exfoliation & resurfacing 53%
Others 47.0%

The exfoliation & resurfacing segment is forecasted to hold 53% of the market share in 2025, led by its central role in addressing consumer concerns such as dullness, uneven texture, and clogged pores. These serums are favored for their ability to promote skin renewal and improve overall radiance, making them the entry point for most first-time AHA users. The high consumer preference for visible, fast-acting results has strengthened this category’s dominance.

Exfoliation-focused products are widely used in both daily routines and professional dermatology treatments, ensuring demand across retail, pharmacy, and clinical channels. The segment’s growth is also supported by rising awareness campaigns on safe exfoliation, which have reduced consumer hesitation around acids. With increasing global adoption of layered skincare regimens, exfoliation and resurfacing serums remain the cornerstone of AHA functionality, ensuring their continued dominance.
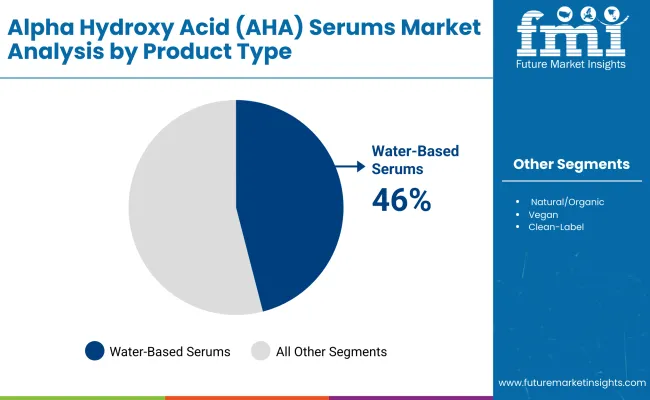
Insights into the Product Type Segment with Water-based Serums Leading in Adoption

Alpha Hydroxy Acid Aha Serums Market By Product Type

Product Type Value Share % 2025
Water-based serums 46%
Others 54.0%

The water-based serums segment is projected to account for 46% of the global Alpha Hydroxy Acid (AHA) Serums Market revenue in 2025, establishing itself as the leading product type. These formulations are favored for their lightweight texture, fast absorption, and suitability across all skin types, from oily to sensitive. Their versatility makes them highly adaptable in both everyday consumer routines and targeted treatments.

Water-based serums are also the preferred format for layering with other actives, such as hyaluronic acid, niacinamide, or retinol, which has expanded their relevance in multi-step skincare regimens. The surge in online tutorials and influencer-driven skincare routines has further accelerated their popularity. With brands innovating around stable delivery systems and clean-label formulations, water-based serums are expected to remain the dominant product type in the decade ahead.

What are the Drivers, Restraints, and Key Trends of the Global Alpha Hydroxy Acid (AHA) Serums Market?

Drivers

Rising Preference for Multi-Functional Formulations

Consumers are increasingly demanding skincare products that address multiple concerns simultaneously, such as exfoliation, brightening, acne prevention, and anti-aging. This demand is pushing brands to innovate AHA serums that combine glycolic or lactic acid with complementary actives like peptides, ceramides, or antioxidants.

Multi-functional AHA serums have gained traction in both premium and mass-market segments, as they reduce the need for multiple products while delivering targeted results. This trend is especially strong in Asia-Pacific, where consumers prefer “all-in-one” solutions and in Western markets where time efficiency and simplified routines are gaining momentum. The driver directly fuels product innovation pipelines, widening consumer appeal and increasing repeat purchase rates.

Surge in E-commerce and Social Media-Driven Adoption

E-commerce channels, combined with influencer-driven marketing, have become a powerful growth engine for AHA serums. Social media platforms like TikTok and Instagram have amplified consumer interest in glycolic acid and lactic acid serums through “before and after” testimonials, dermatologist endorsements, and viral skincare routines. Online platforms not only expand access but also educate consumers about proper concentration levels, layering techniques, and safe usage, reducing hesitancy around chemical exfoliants. Subscription models and D2C e-commerce strategies are accelerating brand loyalty, making online retail one of the fastest-growing channels in the AHA serums market globally.

Restraints

Consumer Sensitivity and Risk of Irritation

One of the biggest restraints for the AHA serums market is the risk of irritation, redness, and over-exfoliation, particularly among first-time users. Despite rising consumer education, misuse of medium to high-strength formulations remains common, leading to product discontinuation and negative consumer perception.

This restraint is particularly visible in Western markets, where consumers are more likely to experiment with high-concentration serums without professional guidance. Regulatory bodies and dermatologists emphasize caution, and this limits the speed at which high-strength (>10%) formulations can penetrate mainstream retail.

Regulatory Challenges and Labeling Compliance

The AHA serums market faces strict scrutiny around ingredient safety, permissible concentration levels, and labeling requirements across geographies. For example, in the European Union, glycolic acid concentrations above a certain threshold are classified under stricter cosmetic regulations, while the USA FDA has guidelines for maximum safe use levels.

These regulations vary widely by region, complicating global launches and increasing compliance costs. Smaller and emerging brands often struggle to navigate these regulatory hurdles, slowing their international expansion.

Key Trends

Shift Toward Blended and Gentle Acid Formulations

A strong trend in the AHA serums market is the growing preference for blended formulations that combine multiple acids (e.g., glycolic, lactic, mandelic) to deliver balanced exfoliation with reduced irritation. These blends are often paired with soothing agents such as aloe vera or centellaasiatica to make acids more accessible to sensitive skin users. This shift is reshaping the competitive landscape, as brands emphasize tolerance and safety alongside efficacy.

Clean-Label and Vegan-Certified AHA Serums on the Rise

Consumers are increasingly scrutinizing ingredient labels and seeking vegan, cruelty-free, and dermatologist-tested formulations. The adoption of clean-label positioning has grown rapidly, especially in North America and Europe, where consumers expect transparency in sourcing and manufacturing. Vegan-certified glycolic and lactic acid serums are gaining market share, and brands leveraging eco-friendly packaging and sustainable ingredient sourcing are achieving higher growth rates in retail channels.
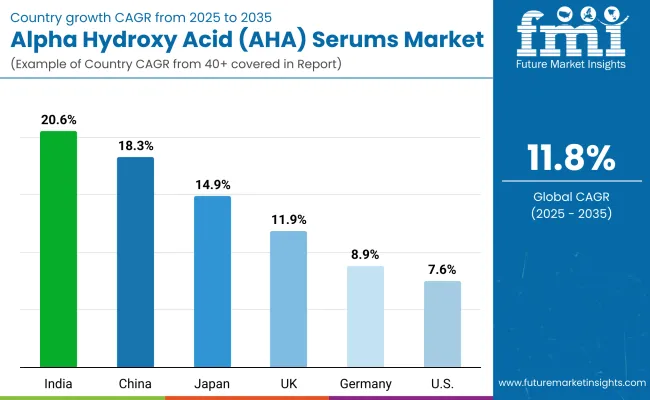
Analysis of Global Alpha Hydroxy Acid (AHA) Serums Market By Key Countries

Alpha Hydroxy Acid Aha Serums Market Country Wise Analysis

Country Estimated CAGR (2025 to 2035)
China 18.3%
USA 7.6%
India 20.6%
UK 11.9%
Germany 8.9%
Japan 14.9%

The country-wise outlook for the global Alpha Hydroxy Acid (AHA) Serums Market highlights significant regional variation in growth patterns from 2025 to 2035. India stands out with the highest estimated CAGR of 20.6%, driven by rapid urbanization, rising disposable incomes, and the increasing adoption of skincare routines among younger consumers.

The strong influence of e-commerce platforms and social media-driven beauty trends has accelerated awareness and acceptance of AHA-based products in India. China follows closely with a CAGR of 18.3%, fueled by the country’s established position as a global beauty hub, strong penetration of local and international skincare brands, and rising demand for exfoliation and brightening serums within both mass-market and premium categories. Japan also shows a robust CAGR of 14.9%, underpinned by consumer preference for advanced yet gentle formulations, with blended and low-concentration AHAs being widely favored in its skincare culture.

In comparison, Western markets are growing at a steadier pace. The UK is expected to expand at 11.9% CAGR, supported by consumer emphasis on anti-aging solutions and dermatologist-tested formulations, while Germany’s growth of 8.9% reflects a preference for clinical-grade, fragrance-free, and clean-label offerings.

The USA, while holding one of the largest market values, records a comparatively moderate CAGR of 7.6% due to its market maturity, though ongoing demand for multi-functional and dermatologist-recommended glycolic and lactic acid serums ensures steady adoption. Collectively, these trends indicate that Asia-Pacific, particularly India and China, will serve as the primary growth engines of the market, while North America and Europe maintain stable, innovation-driven expansion.
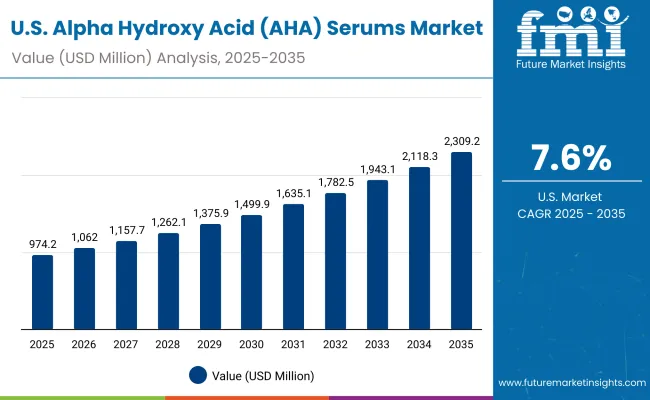
Sales Outlook for AHA Serums in the United States

Usa Alpha Hydroxy Acid Aha Serums Market

Year USA Market (USD Million)
2025 974.25
2026 1062.07
2027 1157.79
2028 1262.15
2029 1375.92
2030 1499.94
2031 1635.13
2032 1782.52
2033 1943.18
2034 2118.33
2035 2309.27

The global Alpha Hydroxy Acid (AHA) Serums Market in the United States is projected to grow at a CAGR of 7.6%, led by increased consumer spending on dermatologist-recommended formulations and clean-label products. Anti-aging and wrinkle reduction applications recorded a notable year-on-year rise, particularly among women aged 35-55.

The acne/blemish treatment segment is also expanding, with glycolic and lactic acid serums gaining traction in pharmacies and drugstores. Adoption is accelerating across e-commerce platforms, where USA consumers are purchasing medium-strength formulations bundled with brightening and hydration claims. High demand for dermatologist-tested and fragrance-free products is driving collaborations between clinical brands and retailers.

  • Anti-aging formulations are a major growth driver for premium AHA serums.
  • Pharmacies and drugstores are integrating dermatologist-backed serums into front-of-shelf displays.
  • E-commerce platforms are favoring bundled claims (brightening + anti-aging + hydration).

Growth and Expansion Outlook for AHA Serums in the United Kingdom

The global Alpha Hydroxy Acid (AHA) Serums Market in the United Kingdom is expected to grow at a CAGR of 11.9%, supported by applications in brightening and resurfacing treatments. Consumer preference for glycolic acid serums is especially strong, while mandelic acid-based blends are gaining recognition among sensitive-skin users.

Premium retailers and specialty beauty chains have accelerated product launches, offering both single-acid and blended AHA formulations to cater to diverse needs. Dermatology clinics and medical spas are expanding their use of high-strength AHA peels, while online beauty platforms continue to dominate sales of daily-use water-based serums. Regulatory clarity on product labeling and concentration thresholds has improved consumer trust.

  • Specialty retailers are expanding their portfolio with dermatologist-recommended glycolic acid products.
  • Clinics and spas are digitizing consultations, recommending customized AHA peel programs.
  • E-commerce platforms are amplifying awareness with consumer-friendly concentration guides.

Growth and Expansion Outlook for AHA Serums in India

India is witnessing the fastest growth in the global Alpha Hydroxy Acid (AHA) Serums Market, forecast to expand at a CAGR of 20.6% through 2035. A sharp increase in product penetration across tier-2 and tier-3 cities is being driven by cost-effective launches and rising consumer awareness about exfoliation and brightening benefits.

Indian consumers are showing strong adoption of medium-strength (5-10%) lactic acid and glycolic acid serums, particularly in e-commerce channels supported by influencer-driven campaigns. Local beauty brands and start-ups are entering the market with affordable vegan and clean-label AHA solutions tailored for sensitive Indian skin tones. Dermatologists are also increasingly prescribing structured regimens that combine AHA serums with sunscreens and hydration boosters.
  • E-commerce adoption is rising rapidly with tier-2 and tier-3 consumer onboarding.
  • Domestic brands are offering vegan and clean-label AHA serums for price-sensitive markets.
  • Dermatologists are integrating AHAs into acne and pigmentation treatment protocols.

Sales Outlook for AHA Serums in China

China Alpha Hydroxy Acid Aha Serums Market

The global Alpha Hydroxy Acid (AHA) Serums Market in China is expected to grow at a CAGR of 18.3%, one of the highest among leading economies. This momentum is driven by strong consumer demand for brightening and anti-aging solutions, supported by K-beauty and C-beauty influences. Urban consumers are rapidly adopting both water-based and ampoule-style AHA serums, particularly those positioned for exfoliation and whitening.

Domestic brands are competing aggressively with global leaders, launching affordable high-concentration formulations through online mega-platforms such as Tmall and JD.com. Municipal and provincial skincare campaigns promoting skin health awareness are further fueling demand, especially among younger consumers.

  • Urban consumers are favoring brightening-focused AHA ampoules and essence-toners.
  • Domestic C-beauty brands are scaling affordable AHA launches via e-commerce platforms.
  • International and local players alike are competing in mid to high-concentration glycolic blends.
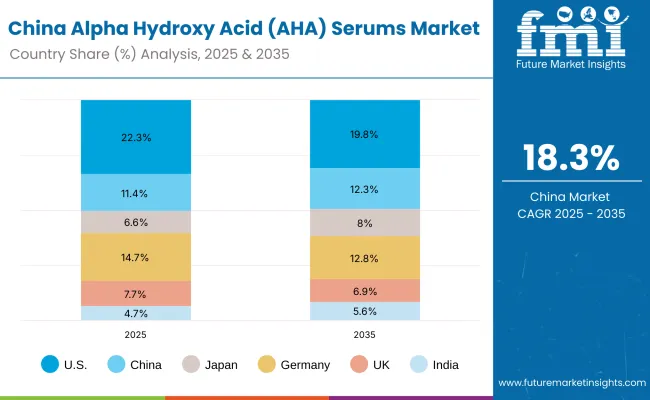
Country 2025 Share (%)
USA 22.3%
China 11.4%
Japan 6.6%
Germany 14.7%
UK 7.7%
India 4.7%
Country 2035 Share (%)
USA 19.8%
China 12.3%
Japan 8.0%
Germany 12.8%
UK 6.9%
India 5.6%

Growth Outlook for AHA Serums Market in the United States

Usa Alpha Hydroxy Acid Aha Serums Market Aha Type

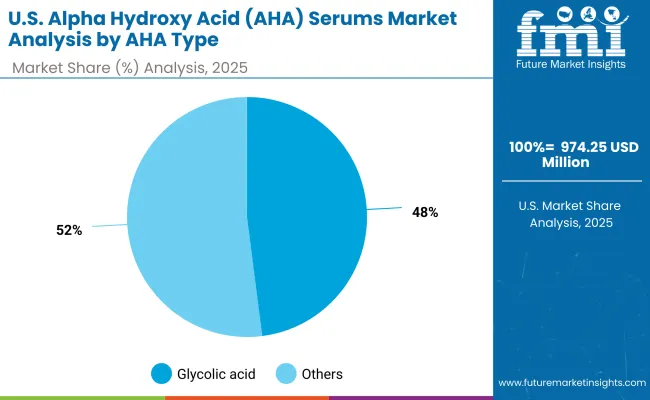
USA By AHA Type Value Share % 2025
Glycolic acid 48%
Others 52.0%

The global Alpha Hydroxy Acid (AHA) Serums Market in the United States is projected at USD 974.25 million in 2025, expanding steadily at a CAGR of 7.6% through 2035. Exfoliation & resurfacing contributes 53% of the market, while other functions including brightening, acne/blemish treatment, and anti-aging together hold 47%. This functional dominance reflects USA consumer preference for visible skin renewal outcomes, making glycolic acid and lactic acid serums the most purchased categories in both pharmacies and e-commerce.

Growth is supported by the strong presence of dermatologist-tested and fragrance-free formulations that cater to sensitive skin users. Demand is further accelerated by digital health platforms and online dermatology consultations, which increasingly recommend glycolic and lactic acid serums for acne-prone and aging skin.

E-commerce platforms like Amazon and Sephora.com amplify access, while bundled skincare kits combining AHAs with retinol or niacinamide boost basket size. Over the next decade, USA growth will rely on premiumization, multi-functional claims, and continued integration of dermatologist-driven credibility.
  • Market in the USA contributes 22.3% share in 2025 of the global market
  • Exfoliation & resurfacing leads with 53% share in 2025
  • Growth supported by dermatologist endorsements and e-commerce adoption

Opportunity Analysis of China AHA Serums Market

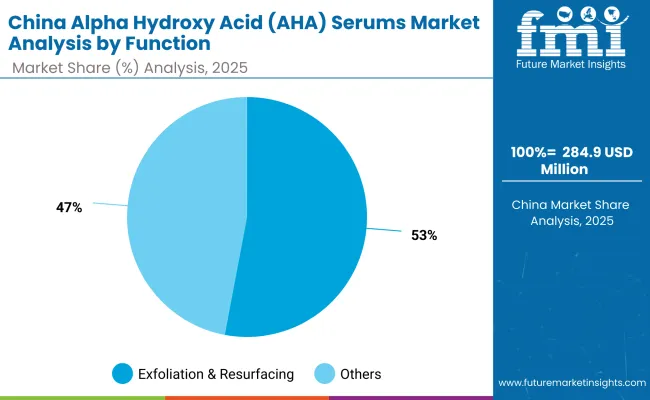
China Alpha Hydroxy Acid Aha Serums Market By Function

China By function Value Share % 2025
Exfoliation & resurfacing 53%
Others 47.0%

The global Alpha Hydroxy Acid (AHA) Serums Market in China is valued at USD 284.9 million in 2025, with exfoliation & resurfacing leading at 53%, followed by brightening and acne treatment at 47%. The dominance of exfoliation-focused serums is a direct outcome of China’s consumer landscape, where younger demographics prioritize skin clarity, smooth texture, and whitening effects. Glycolic acid and blended AHA formulations are particularly popular in essence-toner and ampoule formats, reflecting localized preferences for lighter-textured products.

This advantage positions exfoliation and brightening-focused serums as essential categories in China’s skincare sector, with rapid adoption across e-commerce platforms like Tmall and JD.com. Domestic C-beauty brands are launching affordable formulations, while international players strengthen their foothold through premium positioning. As disposable incomes rise, higher-concentration AHA products combined with AI-driven skin analysis apps will further penetrate the Chinese market. Growth is expected to remain well above global averages, making China one of the most lucrative markets by 2035.
  • Market size for China in 2025 is USD 284.9 million
  • Global market share is approximately 11.4% in 2025
  • Exfoliation & resurfacing leads at 53% due to consumer demand for whitening and texture correction

Competitive Landscape of AHA Serums Market

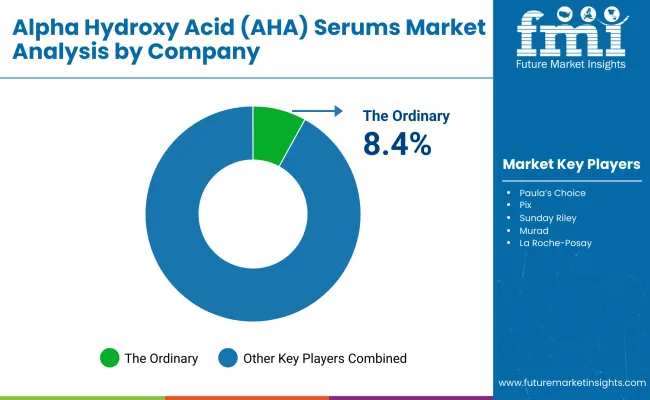
Alpha Hydroxy Acid Aha Serums Market By Company

Comapany Global Value Share 2025
The Ordinary 8.4%
Others 91.6%

The global Alpha Hydroxy Acid (AHA) Serums Market is moderately fragmented, with international leaders, regional innovators, and niche-focused brands competing across diverse consumer segments. Global leaders such as The Ordinary, Paula’s Choice, and L’Oréal Paris hold significant market share, driven by affordability, dermatologist-backed credibility, and widespread retail availability. Their strategies emphasize multi-functional serums, concentration-based product ladders, and integration of clean-label claims.

Established mid-sized players, including Pixi, COSRX, Glow Recipe, and Murad, are catering to demand for sensitive-skin friendly serums, vegan-certified offerings, and hybrid formats like exfoliating toners and essence-based AHAs. These companies accelerate adoption through influencer-driven campaigns, social media virality, and omnichannel retail partnerships across Asia, North America, and Europe.

Premium brands such as Sunday Riley and Drunk Elephant focus on higher-concentration serums and exclusive blends marketed for anti-aging and brightening. Their strength lies in luxury positioning, eco-friendly packaging, and consumer loyalty programs.

Competitive differentiation is shifting away from single-acid solutions toward portfolio breadth, multi-functional claims, and recurring consumer engagement via subscription and direct-to-consumer channels. Clean-label and vegan certifications, alongside clinical validation, are now central to competitive advantage, with e-commerce-first strategies defining the next wave of winners.

Key Developments in Global Alpha Hydroxy Acid (AHA) Serums Market

  • On February 14, 2024, The Ordinary launched its reformulated Glycolic Acid 7% Toning Solution with a new eco-friendly packaging format, emphasizing recyclability and aligning with its clean-label commitment.
  • On May 3, 2024, Paula’s Choice introduced its Clinical 20% Niacinamide Treatment blended with AHAs, targeting uneven skin tone and early signs of aging. The innovation expanded the brand’s dermatologist-tested, high-concentration portfolio.

Scope of the Report

Item Value
Quantitative Units USD 2,502.3 Million
AHA Type Glycolic acid, Lactic acid, Mandelic acid, Citric acid, Blended AHAs
Function Exfoliation & resurfacing, Brightening, Acne/blemish treatment, Anti-aging & wrinkle reductio n
Product Type Water-based serums, Gel serums, Ampoules, Exfoliating essence/toners
Concentration Low strength (<5%), Medium strength (5-10%), High strength (>10%)
Channel E-commerce, Pharmacies/drugstores, Specialty beauty retail, Mass retail
Claim Fragrance-free, Dermatologist-tested, Clean-label, Vegan
Regions Covered North America, Europe, Asia-Pacific, Latin America, Middle East & Africa
Country Covered United States, Canada, Germany, France, United Kingdom, China, Japan, India, Brazil, South Africa
Key Companies Profiled The Ordinary, Paula’s Choice, Pixi , Sunday Riley, Murad, L’Oréal Paris, Drunk Elephant, Glow Recipe, La Roche- Posay , COSRX
Additional Attributes Dollar sales by AHA type, function, and product type, adoption trends across acne and anti-aging segments, rising demand for glycolic and blended AHA formulations, sector-specific growth in e-commerce and dermatology clinics, software-enabled digital consultations and skin analysis integration, influence of clean-label and vegan claims on retail trends, regional growth momentum led by India and China, and innovations in water-based delivery systems, serum hybrids, and essence-toner applications.

Key Segments

By AHA Type:

  • Glycolic acid
  • Lactic acid
  • Mandelic acid
  • Citric acid
  • Blended AHAs

By Function:

  • Exfoliation & resurfacing
  • Brightening
  • Acne/blemish treatment
  • Anti-aging & wrinkle reduction

By Product Type:

  • Water-based serums
  • Gel serums
  • Ampoules
  • Exfoliating essence/toners

By Concentration:

  • Low strength (<5%)
  • Medium strength (5-10%)
  • High strength (>10%)

By Channel:

  • E-commerce
  • Pharmacies/drugstores
  • Specialty beauty retail
  • Mass retail

By Claim:

  • Fragrance-free
  • Dermatologist-tested
  • Clean-label
  • Vegan

By Region:

  • North America
  • Latin America
  • Europe
  • East Asia
  • South Asia & Pacific
  • Middle East and Africa

Table of Content

  1. Executive Summary
    • Global Market Outlook
    • Demand-side Trends
    • Supply-side Trends
    • Technology Roadmap Analysis
    • Analysis and Recommendations
  2. Market Overview
    • Market Coverage / Taxonomy
    • Market Definition / Scope / Limitations
  3. Market Background
    • Market Dynamics
      • Drivers
      • Restraints
      • Opportunity
      • Trends
    • Scenario Forecast
      • Demand in Optimistic Scenario
      • Demand in Likely Scenario
      • Demand in Conservative Scenario
    • Opportunity Map Analysis
    • Product Life Cycle Analysis
    • Supply Chain Analysis
    • Investment Feasibility Matrix
    • Value Chain Analysis
    • PESTLE and Porter’s Analysis
    • Regulatory Landscape
    • Regional Parent Market Outlook
    • Production and Consumption Statistics
    • Import and Export Statistics
  4. Global Analysis 2020 to 2024 and Forecast, 2025 to 2035
    • Historical Market Size Value (USD Million) Analysis, 2020 to 2024
    • Current and Future Market Size Value (USD Million) Projections, 2025 to 2035
      • Y-o-Y Growth Trend Analysis
      • Absolute $ Opportunity Analysis
  5. Global Pricing Analysis 2020 to 2024 and Forecast 2025 to 2035
  6. Global Analysis 2020 to 2024 and Forecast 2025 to 2035, By AHA Type
    • Introduction / Key Findings
    • Historical Market Size Value (USD Million) Analysis By AHA Type, 2020 to 2024
    • Current and Future Market Size Value (USD Million) Analysis and Forecast By AHA Type, 2025 to 2035
      • Glycolic acid
      • Lactic acid
      • Mandelic acid
      • Citric acid
      • Blended AHAs
    • Y-o-Y Growth Trend Analysis By AHA Type, 2020 to 2024
    • Absolute $ Opportunity Analysis By AHA Type, 2025 to 2035
  7. Global Analysis 2020 to 2024 and Forecast 2025 to 2035, By Function
    • Introduction / Key Findings
    • Historical Market Size Value (USD Million) Analysis By Function, 2020 to 2024
    • Current and Future Market Size Value (USD Million) Analysis and Forecast By Function, 2025 to 2035
      • Exfoliation & resurfacing
      • Brightening
      • Acne/blemish treatment
      • Anti-aging & wrinkle reduction
    • Y-o-Y Growth Trend Analysis By Function, 2020 to 2024
    • Absolute $ Opportunity Analysis By Function, 2025 to 2035
  8. Global Analysis 2020 to 2024 and Forecast 2025 to 2035, By Product Type
    • Introduction / Key Findings
    • Historical Market Size Value (USD Million) Analysis By Product Type, 2020 to 2024
    • Current and Future Market Size Value (USD Million) Analysis and Forecast By Product Type, 2025 to 2035
      • Water-based serums
      • Gel serums
      • Ampoules
      • Exfoliating essence/toners
    • Y-o-Y Growth Trend Analysis By Product Type, 2020 to 2024
    • Absolute $ Opportunity Analysis By Product Type, 2025 to 2035
  9. Global Analysis 2020 to 2024 and Forecast 2025 to 2035, By Concentration
    • Introduction / Key Findings
    • Historical Market Size Value (USD Million) Analysis By Concentration, 2020 to 2024
    • Current and Future Market Size Value (USD Million) Analysis and Forecast By Concentration, 2025 to 2035
      • Low strength (<5%)
      • Medium strength (5-10%)
      • High strength (>10%)
    • Y-o-Y Growth Trend Analysis By Concentration, 2020 to 2024
    • Absolute $ Opportunity Analysis By Concentration, 2025 to 2035
  10. Global Analysis 2020 to 2024 and Forecast 2025 to 2035, By Channel
    • Introduction / Key Findings
    • Historical Market Size Value (USD Million) Analysis By Channel, 2020 to 2024
    • Current and Future Market Size Value (USD Million) Analysis and Forecast By Channel, 2025 to 2035
      • E-commerce
      • Pharmacies/drugstores
      • Specialty beauty retail
      • Mass retail
    • Y-o-Y Growth Trend Analysis By Channel, 2020 to 2024
    • Absolute $ Opportunity Analysis By Channel, 2025 to 2035
  11. Global Analysis 2020 to 2024 and Forecast 2025 to 2035, By Claim
    • Introduction / Key Findings
    • Historical Market Size Value (USD Million) Analysis By Claim, 2020 to 2024
    • Current and Future Market Size Value (USD Million) Analysis and Forecast By Claim, 2025 to 2035
      • Fragrance-free
      • Dermatologist-tested
      • Clean-label
      • Vegan
    • Y-o-Y Growth Trend Analysis By Claim, 2020 to 2024
    • Absolute $ Opportunity Analysis By Claim, 2025 to 2035
  12. Global Analysis 2020 to 2024 and Forecast 2025 to 2035, By Region
    • Introduction
    • Historical Market Size Value (USD Million) Analysis By Region, 2020 to 2024
    • Current Market Size Value (USD Million) Analysis and Forecast By Region, 2025 to 2035
      • North America
      • Latin America
      • Europe
      • East Asia
      • South Asia & Pacific
      • Middle East and Africa
    • Market Attractiveness Analysis By Region
  13. North America Analysis 2020 to 2024 and Forecast 2025 to 2035, By Country
    • Historical Market Size Value (USD Million) Trend Analysis By Market Taxonomy, 2020 to 2024
    • Market Size Value (USD Million) Forecast By Market Taxonomy, 2025 to 2035
      • By Country
        • USA
        • Canada
      • By AHA Type
      • By Function
      • By Product Type
      • By Concentration
      • By Channel
      • By Claim
    • Market Attractiveness Analysis
      • By Country
      • By AHA Type
      • By Function
      • By Product Type
      • By Concentration
      • By Channel
      • By Claim
    • Key Takeaways
  14. Latin America Analysis 2020 to 2024 and Forecast 2025 to 2035, By Country
    • Historical Market Size Value (USD Million) Trend Analysis By Market Taxonomy, 2020 to 2024
    • Market Size Value (USD Million) Forecast By Market Taxonomy, 2025 to 2035
      • By Country
        • Brazil
        • Mexico
        • Colombia
        • Rest of Latin America
      • By AHA Type
      • By Function
      • By Product Type
      • By Concentration
      • By Channel
      • By Claim
    • Market Attractiveness Analysis
      • By Country
      • By AHA Type
      • By Function
      • By Product Type
      • By Concentration
      • By Channel
      • By Claim
    • Key Takeaways
  15. Europe Analysis 2020 to 2024 and Forecast 2025 to 2035, By Country
    • Historical Market Size Value (USD Million) Trend Analysis By Market Taxonomy, 2020 to 2024
    • Market Size Value (USD Million) Forecast By Market Taxonomy, 2025 to 2035
      • By Country
        • Germany
        • UK
        • France
        • Italy
        • Spain
        • Belgium
        • Netherlands
        • Nordic
        • Switzerland
        • Russia
        • Poland
        • Rest of Europe
      • By AHA Type
      • By Function
      • By Product Type
      • By Concentration
      • By Channel
      • By Claim
    • Market Attractiveness Analysis
      • By Country
      • By AHA Type
      • By Function
      • By Product Type
      • By Concentration
      • By Channel
      • By Claim
    • Key Takeaways
  16. East Asia Analysis 2020 to 2024 and Forecast 2025 to 2035, By Country
    • Historical Market Size Value (USD Million) Trend Analysis By Market Taxonomy, 2020 to 2024
    • Market Size Value (USD Million) Forecast By Market Taxonomy, 2025 to 2035
      • By Country
        • China
        • Japan
        • South Korea
      • By AHA Type
      • By Function
      • By Product Type
      • By Concentration
      • By Channel
      • By Claim
    • Market Attractiveness Analysis
      • By Country
      • By AHA Type
      • By Function
      • By Product Type
      • By Concentration
      • By Channel
      • By Claim
    • Key Takeaways
  17. South Asia & Pacific Analysis 2020 to 2024 and Forecast 2025 to 2035, By Country
    • Historical Market Size Value (USD Million) Trend Analysis By Market Taxonomy, 2020 to 2024
    • Market Size Value (USD Million) Forecast By Market Taxonomy, 2025 to 2035
      • By Country
        • India
        • Thailand
        • Malaysia
        • Indonesia
        • Singapore
        • Vietnam
        • Australia
        • New Zealand
        • Rest of South Asia
      • By AHA Type
      • By Function
      • By Product Type
      • By Concentration
      • By Channel
      • By Claim
    • Market Attractiveness Analysis
      • By Country
      • By AHA Type
      • By Function
      • By Product Type
      • By Concentration
      • By Channel
      • By Claim
    • Key Takeaways
  18. Middle East and Africa Analysis 2020 to 2024 and Forecast 2025 to 2035, By Country
    • Historical Market Size Value (USD Million) Trend Analysis By Market Taxonomy, 2020 to 2024
    • Market Size Value (USD Million) Forecast By Market Taxonomy, 2025 to 2035
      • By Country
        • Turkey
        • UAE
        • Saudi Arabia
        • Israel
        • Other GCC Countries
        • North Africa
        • South Africa
      • By AHA Type
      • By Function
      • By Product Type
      • By Concentration
      • By Channel
      • By Claim
    • Market Attractiveness Analysis
      • By Country
      • By AHA Type
      • By Function
      • By Product Type
      • By Concentration
      • By Channel
      • By Claim
    • Key Takeaways
  19. Key Countries Analysis
    • USA
      • Pricing Analysis
      • Market Share Analysis, 2024
        • By AHA Type
        • By Function
        • By Product Type
        • By Concentration
        • By Channel
        • By Claim
    • Canada
      • Pricing Analysis
      • Market Share Analysis, 2024
        • By AHA Type
        • By Function
        • By Product Type
        • By Concentration
        • By Channel
        • By Claim
    • Mexico
      • Pricing Analysis
      • Market Share Analysis, 2024
        • By AHA Type
        • By Function
        • By Product Type
        • By Concentration
        • By Channel
        • By Claim
    • Brazil
      • Pricing Analysis
      • Market Share Analysis, 2024
        • By AHA Type
        • By Function
        • By Product Type
        • By Concentration
        • By Channel
        • By Claim
    • Germany
      • Pricing Analysis
      • Market Share Analysis, 2024
        • By AHA Type
        • By Function
        • By Product Type
        • By Concentration
        • By Channel
        • By Claim
    • UK
      • Pricing Analysis
      • Market Share Analysis, 2024
        • By AHA Type
        • By Function
        • By Product Type
        • By Concentration
        • By Channel
        • By Claim
    • Italy
      • Pricing Analysis
      • Market Share Analysis, 2024
        • By AHA Type
        • By Function
        • By Product Type
        • By Concentration
        • By Channel
        • By Claim
    • Spain
      • Pricing Analysis
      • Market Share Analysis, 2024
        • By AHA Type
        • By Function
        • By Product Type
        • By Concentration
        • By Channel
        • By Claim
    • France
      • Pricing Analysis
      • Market Share Analysis, 2024
        • By AHA Type
        • By Function
        • By Product Type
        • By Concentration
        • By Channel
        • By Claim
    • India
      • Pricing Analysis
      • Market Share Analysis, 2024
        • By AHA Type
        • By Function
        • By Product Type
        • By Concentration
        • By Channel
        • By Claim
    • Australia & New Zealand
      • Pricing Analysis
      • Market Share Analysis, 2024
        • By AHA Type
        • By Function
        • By Product Type
        • By Concentration
        • By Channel
        • By Claim
    • China
      • Pricing Analysis
      • Market Share Analysis, 2024
        • By AHA Type
        • By Function
        • By Product Type
        • By Concentration
        • By Channel
        • By Claim
    • Japan
      • Pricing Analysis
      • Market Share Analysis, 2024
        • By AHA Type
        • By Function
        • By Product Type
        • By Concentration
        • By Channel
        • By Claim
    • South Korea
      • Pricing Analysis
      • Market Share Analysis, 2024
        • By AHA Type
        • By Function
        • By Product Type
        • By Concentration
        • By Channel
        • By Claim
    • Russia
      • Pricing Analysis
      • Market Share Analysis, 2024
        • By AHA Type
        • By Function
        • By Product Type
        • By Concentration
        • By Channel
        • By Claim
    • Poland
      • Pricing Analysis
      • Market Share Analysis, 2024
        • By AHA Type
        • By Function
        • By Product Type
        • By Concentration
        • By Channel
        • By Claim
    • Hungary
      • Pricing Analysis
      • Market Share Analysis, 2024
        • By AHA Type
        • By Function
        • By Product Type
        • By Concentration
        • By Channel
        • By Claim
    • Kingdom of Saudi Arabia
      • Pricing Analysis
      • Market Share Analysis, 2024
        • By AHA Type
        • By Function
        • By Product Type
        • By Concentration
        • By Channel
        • By Claim
    • South Africa
      • Pricing Analysis
      • Market Share Analysis, 2024
        • By AHA Type
        • By Function
        • By Product Type
        • By Concentration
        • By Channel
        • By Claim
  20. Market Structure Analysis
    • Competition Dashboard
    • Competition Benchmarking
    • Market Share Analysis of Top Players
      • By Regional
      • By AHA Type
      • By Function
      • By Product Type
      • By Concentration
      • By Channel
      • By Claim
  21. Competition Analysis
    • Competition Deep Dive
      • The Ordinary
        • Overview
        • Product Portfolio
        • Profitability by Market Segments (Product/Age /Sales Channel/Region)
        • Sales Footprint
        • Strategy Overview
        • Paula’s Choice
        • Pixi
        • Sunday Riley
        • Murad
        • L’Oréal Paris
        • Drunk Elephant
        • Glow Recipe
        • La Roche-Posay
        • COSRX
  22. Assumptions & Acronyms Used
  23. Research Methodology

List of Tables

  • Table 1: Global Value (USD Million) Forecast by Region, 2020-2035
  • Table 2: Global Value (USD Million) Forecast by AHA Type, 2020-2035
  • Table 3: Global Value (USD Million) Forecast by Function, 2020-2035
  • Table 4: Global Value (USD Million) Forecast by Product Type, 2020-2035
  • Table 5: Global Value (USD Million) Forecast by Concentration, 2020-2035
  • Table 6: Global Value (USD Million) Forecast by Channel, 2020-2035
  • Table 7: Global Value (USD Million) Forecast by Claim, 2020-2035
  • Table 8: North America Value (USD Million) Forecast by Country, 2020-2035
  • Table 9: North America Value (USD Million) Forecast by AHA Type, 2020-2035
  • Table 10: North America Value (USD Million) Forecast by Function, 2020-2035
  • Table 11: North America Value (USD Million) Forecast by Product Type, 2020-2035
  • Table 12: North America Value (USD Million) Forecast by Concentration, 2020-2035
  • Table 13: North America Value (USD Million) Forecast by Channel, 2020-2035
  • Table 14: North America Value (USD Million) Forecast by Claim, 2020-2035
  • Table 15: Latin America Value (USD Million) Forecast by Country, 2020-2035
  • Table 16: Latin America Value (USD Million) Forecast by AHA Type, 2020-2035
  • Table 17: Latin America Value (USD Million) Forecast by Function, 2020-2035
  • Table 18: Latin America Value (USD Million) Forecast by Product Type, 2020-2035
  • Table 19: Latin America Value (USD Million) Forecast by Concentration, 2020-2035
  • Table 20: Latin America Value (USD Million) Forecast by Channel, 2020-2035
  • Table 21: Latin America Value (USD Million) Forecast by Claim, 2020-2035
  • Table 22: Europe Value (USD Million) Forecast by Country, 2020-2035
  • Table 23: Europe Value (USD Million) Forecast by AHA Type, 2020-2035
  • Table 24: Europe Value (USD Million) Forecast by Function, 2020-2035
  • Table 25: Europe Value (USD Million) Forecast by Product Type, 2020-2035
  • Table 26: Europe Value (USD Million) Forecast by Concentration, 2020-2035
  • Table 27: Europe Value (USD Million) Forecast by Channel, 2020-2035
  • Table 28: Europe Value (USD Million) Forecast by Claim, 2020-2035
  • Table 29: East Asia Value (USD Million) Forecast by Country, 2020-2035
  • Table 30: East Asia Value (USD Million) Forecast by AHA Type, 2020-2035
  • Table 31: East Asia Value (USD Million) Forecast by Function, 2020-2035
  • Table 32: East Asia Value (USD Million) Forecast by Product Type, 2020-2035
  • Table 33: East Asia Value (USD Million) Forecast by Concentration, 2020-2035
  • Table 34: East Asia Value (USD Million) Forecast by Channel, 2020-2035
  • Table 35: East Asia Value (USD Million) Forecast by Claim, 2020-2035
  • Table 36: South Asia & Pacific Value (USD Million) Forecast by Country, 2020-2035
  • Table 37: South Asia & Pacific Value (USD Million) Forecast by AHA Type, 2020-2035
  • Table 38: South Asia & Pacific Value (USD Million) Forecast by Function, 2020-2035
  • Table 39: South Asia & Pacific Value (USD Million) Forecast by Product Type, 2020-2035
  • Table 40: South Asia & Pacific Value (USD Million) Forecast by Concentration, 2020-2035
  • Table 41: South Asia & Pacific Value (USD Million) Forecast by Channel, 2020-2035
  • Table 42: South Asia & Pacific Value (USD Million) Forecast by Claim, 2020-2035
  • Table 43: Middle East and Africa Value (USD Million) Forecast by Country, 2020-2035
  • Table 44: Middle East and Africa Value (USD Million) Forecast by AHA Type, 2020-2035
  • Table 45: Middle East and Africa Value (USD Million) Forecast by Function, 2020-2035
  • Table 46: Middle East and Africa Value (USD Million) Forecast by Product Type, 2020-2035
  • Table 47: Middle East and Africa Value (USD Million) Forecast by Concentration, 2020-2035
  • Table 48: Middle East and Africa Value (USD Million) Forecast by Channel, 2020-2035
  • Table 49: Middle East and Africa Value (USD Million) Forecast by Claim, 2020-2035

List of Figures

  • Figure 1: Global Pricing Analysis
  • Figure 2: Global Value (USD Million) Forecast 2020-2035
  • Figure 3: Global Value Share and BPS Analysis by AHA Type, 2025 and 2035
  • Figure 4: Global Y-o-Y Growth Comparison by AHA Type, 2025-2035
  • Figure 5: Global Attractiveness Analysis by AHA Type
  • Figure 6: Global Value Share and BPS Analysis by Function, 2025 and 2035
  • Figure 7: Global Y-o-Y Growth Comparison by Function, 2025-2035
  • Figure 8: Global Attractiveness Analysis by Function
  • Figure 9: Global Value Share and BPS Analysis by Product Type, 2025 and 2035
  • Figure 10: Global Y-o-Y Growth Comparison by Product Type, 2025-2035
  • Figure 11: Global Attractiveness Analysis by Product Type
  • Figure 12: Global Value Share and BPS Analysis by Concentration, 2025 and 2035
  • Figure 13: Global Y-o-Y Growth Comparison by Concentration, 2025-2035
  • Figure 14: Global Attractiveness Analysis by Concentration
  • Figure 15: Global Value Share and BPS Analysis by Channel, 2025 and 2035
  • Figure 16: Global Y-o-Y Growth Comparison by Channel, 2025-2035
  • Figure 17: Global Attractiveness Analysis by Channel
  • Figure 18: Global Value Share and BPS Analysis by Claim, 2025 and 2035
  • Figure 19: Global Y-o-Y Growth Comparison by Claim, 2025-2035
  • Figure 20: Global Attractiveness Analysis by Claim
  • Figure 21: Global Value (USD Million) Share and BPS Analysis by Region, 2025 and 2035
  • Figure 22: Global Y-o-Y Growth Comparison by Region, 2025-2035
  • Figure 23: Global Attractiveness Analysis by Region
  • Figure 24: North America Incremental $ Opportunity, 2025-2035
  • Figure 25: Latin America Incremental $ Opportunity, 2025-2035
  • Figure 26: Europe Incremental $ Opportunity, 2025-2035
  • Figure 27: East Asia Incremental $ Opportunity, 2025-2035
  • Figure 28: South Asia & Pacific Incremental $ Opportunity, 2025-2035
  • Figure 29: Middle East and Africa Incremental $ Opportunity, 2025-2035
  • Figure 30: North America Value Share and BPS Analysis by Country, 2025 and 2035
  • Figure 31: North America Value Share and BPS Analysis by AHA Type, 2025 and 2035
  • Figure 32: North America Y-o-Y Growth Comparison by AHA Type, 2025-2035
  • Figure 33: North America Attractiveness Analysis by AHA Type
  • Figure 34: North America Value Share and BPS Analysis by Function, 2025 and 2035
  • Figure 35: North America Y-o-Y Growth Comparison by Function, 2025-2035
  • Figure 36: North America Attractiveness Analysis by Function
  • Figure 37: North America Value Share and BPS Analysis by Product Type, 2025 and 2035
  • Figure 38: North America Y-o-Y Growth Comparison by Product Type, 2025-2035
  • Figure 39: North America Attractiveness Analysis by Product Type
  • Figure 40: North America Value Share and BPS Analysis by Concentration, 2025 and 2035
  • Figure 41: North America Y-o-Y Growth Comparison by Concentration, 2025-2035
  • Figure 42: North America Attractiveness Analysis by Concentration
  • Figure 43: North America Value Share and BPS Analysis by Channel, 2025 and 2035
  • Figure 44: North America Y-o-Y Growth Comparison by Channel, 2025-2035
  • Figure 45: North America Attractiveness Analysis by Channel
  • Figure 46: North America Value Share and BPS Analysis by Claim, 2025 and 2035
  • Figure 47: North America Y-o-Y Growth Comparison by Claim, 2025-2035
  • Figure 48: North America Attractiveness Analysis by Claim
  • Figure 49: Latin America Value Share and BPS Analysis by Country, 2025 and 2035
  • Figure 50: Latin America Value Share and BPS Analysis by AHA Type, 2025 and 2035
  • Figure 51: Latin America Y-o-Y Growth Comparison by AHA Type, 2025-2035
  • Figure 52: Latin America Attractiveness Analysis by AHA Type
  • Figure 53: Latin America Value Share and BPS Analysis by Function, 2025 and 2035
  • Figure 54: Latin America Y-o-Y Growth Comparison by Function, 2025-2035
  • Figure 55: Latin America Attractiveness Analysis by Function
  • Figure 56: Latin America Value Share and BPS Analysis by Product Type, 2025 and 2035
  • Figure 57: Latin America Y-o-Y Growth Comparison by Product Type, 2025-2035
  • Figure 58: Latin America Attractiveness Analysis by Product Type
  • Figure 59: Latin America Value Share and BPS Analysis by Concentration, 2025 and 2035
  • Figure 60: Latin America Y-o-Y Growth Comparison by Concentration, 2025-2035
  • Figure 61: Latin America Attractiveness Analysis by Concentration
  • Figure 62: Latin America Value Share and BPS Analysis by Channel, 2025 and 2035
  • Figure 63: Latin America Y-o-Y Growth Comparison by Channel, 2025-2035
  • Figure 64: Latin America Attractiveness Analysis by Channel
  • Figure 65: Latin America Value Share and BPS Analysis by Claim, 2025 and 2035
  • Figure 66: Latin America Y-o-Y Growth Comparison by Claim, 2025-2035
  • Figure 67: Latin America Attractiveness Analysis by Claim
  • Figure 68: Europe Value Share and BPS Analysis by Country, 2025 and 2035
  • Figure 69: Europe Value Share and BPS Analysis by AHA Type, 2025 and 2035
  • Figure 70: Europe Y-o-Y Growth Comparison by AHA Type, 2025-2035
  • Figure 71: Europe Attractiveness Analysis by AHA Type
  • Figure 72: Europe Value Share and BPS Analysis by Function, 2025 and 2035
  • Figure 73: Europe Y-o-Y Growth Comparison by Function, 2025-2035
  • Figure 74: Europe Attractiveness Analysis by Function
  • Figure 75: Europe Value Share and BPS Analysis by Product Type, 2025 and 2035
  • Figure 76: Europe Y-o-Y Growth Comparison by Product Type, 2025-2035
  • Figure 77: Europe Attractiveness Analysis by Product Type
  • Figure 78: Europe Value Share and BPS Analysis by Concentration, 2025 and 2035
  • Figure 79: Europe Y-o-Y Growth Comparison by Concentration, 2025-2035
  • Figure 80: Europe Attractiveness Analysis by Concentration
  • Figure 81: Europe Value Share and BPS Analysis by Channel, 2025 and 2035
  • Figure 82: Europe Y-o-Y Growth Comparison by Channel, 2025-2035
  • Figure 83: Europe Attractiveness Analysis by Channel
  • Figure 84: Europe Value Share and BPS Analysis by Claim, 2025 and 2035
  • Figure 85: Europe Y-o-Y Growth Comparison by Claim, 2025-2035
  • Figure 86: Europe Attractiveness Analysis by Claim
  • Figure 87: East Asia Value Share and BPS Analysis by Country, 2025 and 2035
  • Figure 88: East Asia Value Share and BPS Analysis by AHA Type, 2025 and 2035
  • Figure 89: East Asia Y-o-Y Growth Comparison by AHA Type, 2025-2035
  • Figure 90: East Asia Attractiveness Analysis by AHA Type
  • Figure 91: East Asia Value Share and BPS Analysis by Function, 2025 and 2035
  • Figure 92: East Asia Y-o-Y Growth Comparison by Function, 2025-2035
  • Figure 93: East Asia Attractiveness Analysis by Function
  • Figure 94: East Asia Value Share and BPS Analysis by Product Type, 2025 and 2035
  • Figure 95: East Asia Y-o-Y Growth Comparison by Product Type, 2025-2035
  • Figure 96: East Asia Attractiveness Analysis by Product Type
  • Figure 97: East Asia Value Share and BPS Analysis by Concentration, 2025 and 2035
  • Figure 98: East Asia Y-o-Y Growth Comparison by Concentration, 2025-2035
  • Figure 99: East Asia Attractiveness Analysis by Concentration
  • Figure 100: East Asia Value Share and BPS Analysis by Channel, 2025 and 2035
  • Figure 101: East Asia Y-o-Y Growth Comparison by Channel, 2025-2035
  • Figure 102: East Asia Attractiveness Analysis by Channel
  • Figure 103: East Asia Value Share and BPS Analysis by Claim, 2025 and 2035
  • Figure 104: East Asia Y-o-Y Growth Comparison by Claim, 2025-2035
  • Figure 105: East Asia Attractiveness Analysis by Claim
  • Figure 106: South Asia & Pacific Value Share and BPS Analysis by Country, 2025 and 2035
  • Figure 107: South Asia & Pacific Value Share and BPS Analysis by AHA Type, 2025 and 2035
  • Figure 108: South Asia & Pacific Y-o-Y Growth Comparison by AHA Type, 2025-2035
  • Figure 109: South Asia & Pacific Attractiveness Analysis by AHA Type
  • Figure 110: South Asia & Pacific Value Share and BPS Analysis by Function, 2025 and 2035
  • Figure 111: South Asia & Pacific Y-o-Y Growth Comparison by Function, 2025-2035
  • Figure 112: South Asia & Pacific Attractiveness Analysis by Function
  • Figure 113: South Asia & Pacific Value Share and BPS Analysis by Product Type, 2025 and 2035
  • Figure 114: South Asia & Pacific Y-o-Y Growth Comparison by Product Type, 2025-2035
  • Figure 115: South Asia & Pacific Attractiveness Analysis by Product Type
  • Figure 116: South Asia & Pacific Value Share and BPS Analysis by Concentration, 2025 and 2035
  • Figure 117: South Asia & Pacific Y-o-Y Growth Comparison by Concentration, 2025-2035
  • Figure 118: South Asia & Pacific Attractiveness Analysis by Concentration
  • Figure 119: South Asia & Pacific Value Share and BPS Analysis by Channel, 2025 and 2035
  • Figure 120: South Asia & Pacific Y-o-Y Growth Comparison by Channel, 2025-2035
  • Figure 121: South Asia & Pacific Attractiveness Analysis by Channel
  • Figure 122: South Asia & Pacific Value Share and BPS Analysis by Claim, 2025 and 2035
  • Figure 123: South Asia & Pacific Y-o-Y Growth Comparison by Claim, 2025-2035
  • Figure 124: South Asia & Pacific Attractiveness Analysis by Claim
  • Figure 125: Middle East and Africa Value Share and BPS Analysis by Country, 2025 and 2035
  • Figure 126: Middle East and Africa Value Share and BPS Analysis by AHA Type, 2025 and 2035
  • Figure 127: Middle East and Africa Y-o-Y Growth Comparison by AHA Type, 2025-2035
  • Figure 128: Middle East and Africa Attractiveness Analysis by AHA Type
  • Figure 129: Middle East and Africa Value Share and BPS Analysis by Function, 2025 and 2035
  • Figure 130: Middle East and Africa Y-o-Y Growth Comparison by Function, 2025-2035
  • Figure 131: Middle East and Africa Attractiveness Analysis by Function
  • Figure 132: Middle East and Africa Value Share and BPS Analysis by Product Type, 2025 and 2035
  • Figure 133: Middle East and Africa Y-o-Y Growth Comparison by Product Type, 2025-2035
  • Figure 134: Middle East and Africa Attractiveness Analysis by Product Type
  • Figure 135: Middle East and Africa Value Share and BPS Analysis by Concentration, 2025 and 2035
  • Figure 136: Middle East and Africa Y-o-Y Growth Comparison by Concentration, 2025-2035
  • Figure 137: Middle East and Africa Attractiveness Analysis by Concentration
  • Figure 138: Middle East and Africa Value Share and BPS Analysis by Channel, 2025 and 2035
  • Figure 139: Middle East and Africa Y-o-Y Growth Comparison by Channel, 2025-2035
  • Figure 140: Middle East and Africa Attractiveness Analysis by Channel
  • Figure 141: Middle East and Africa Value Share and BPS Analysis by Claim, 2025 and 2035
  • Figure 142: Middle East and Africa Y-o-Y Growth Comparison by Claim, 2025-2035
  • Figure 143: Middle East and Africa Attractiveness Analysis by Claim
  • Figure 144: Global - Tier Structure Analysis
  • Figure 145: Global - Company Share Analysis

Frequently Asked Questions

How big is the global AHA Serums Market in 2025?

The global Alpha Hydroxy Acid (AHA) Serums Market is estimated to be valued at USD 2,502.3 million in 2025.

What will be the size of the global AHA Serums Market in 2035?

The market size for the global Alpha Hydroxy Acid (AHA) Serums Market is projected to reach USD 7,653.4 million by 2035.

How much will be the global AHA Serums Market growth between 2025 and 2035?

The global Alpha Hydroxy Acid (AHA) Serums Market is expected to grow at a CAGR of 11.8% between 2025 and 2035.

What are the key product types in the global AHA Serums Market?

The key product types in the global Alpha Hydroxy Acid (AHA) Serums Market are water-based serums, gel serums, ampoules, and exfoliating essence/toners.

Which AHA type is expected to contribute significant share in the global AHA Serums Market in 2025?

In terms of AHA type, the glycolic acid segment is projected to command 48% share in the global Alpha Hydroxy Acid (AHA) Serums Market in 2025.

Explore Similar Insights

Future Market Insights

Alpha Hydroxy Acid (AHA) Serums Market

Chat With

MaRIA

Hi There, I am MaRIA, Your Market Research Intelligence Assistant. How may I help you?