


Non-Halogenated Flame Retardants Market : Global Industry Analysis and Opportunity Assessment, 2036
Non-Halogenated Flame Retardants Market is segmented by Product Type, End-Use Industry, Application, and Region. Forecast for 2026 to 2036
- Market Size (2026): USD 4.5 Bn
- Forecast (2036): USD 7.9 Bn
- CAGR (2026 to 2036): 5.8%
How big is the Non-Halogenated Flame Retardants Market in 2026?
USD 4.5 billion in 2026, reaching USD 7.9 billion by 2036 at a 5.8% CAGR
The non-halogenated flame retardants market is estimated at USD 4.5 billion in 2026 and is forecast to reach USD 7.9 billion by 2036 at a 5.8% CAGR. Phosphorous Based accounts for 46.7% of product type revenue in 2026, while Electronics Industry leads end-use industry at 39.5%. Demand is shaped by buyers consolidating purchases around the phosphorous based category to control cost and qualification effort.
Growth reflects steady replacement and upgrade cycles across materials end users rather than one-off spikes. Adoption is increasing due to buyers consolidating spend with vendors that minimize requalification and lead-time risk. The fastest expansion sits in USA at 5.9% CAGR, followed by South Korea at 5.9%, where buying centers prioritize reshoring and infrastructure-bill allocations.
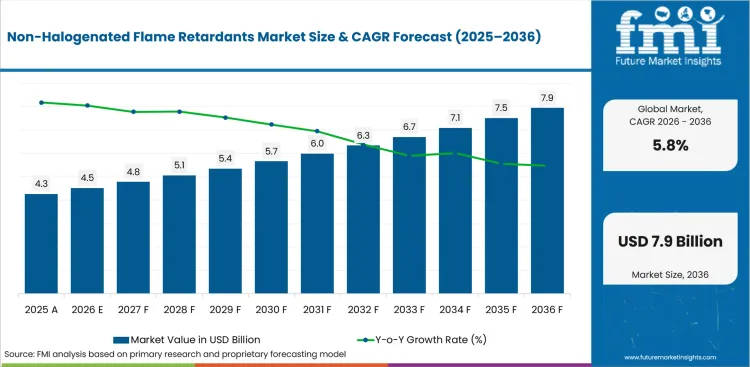
Summary of the Non-Halogenated Flame Retardants Market
| Market Signal | Commercial Impact |
|---|---|
| Demand and Growth Drivers | Recurring replacement demand and high switching costs keep phosphorous based procurement durable.
|
| Product and Segment View | Phosphorous Based and Electronics Industry lead their respective segments in 2026.
|
| Geography and Competitive Outlook | USA is expected to remain the key growth market, with Clariant International Ltd. and Albemarle Corporation leading competition.
|
| Analyst Perspective | Buyers now judge phosphorous based on performance and total cost of ownership, not headline price.
|
Why is the Non-Halogenated Flame Retardants Market growing?
Rising Phosphorous Based and Electronics Industry demand across materials end users
- Sustained procurement of phosphorous based is shaped by replacement cycles and capacity additions among materials buyers in both established and emerging markets.
- USA leads growth at 5.9% CAGR, supported by reshoring and infrastructure-bill allocations and tariff structures on imported grades.
- Electronics Industry holds 39.5% of end-use industry revenue, indicating where standardization is concentrating buyer spend.
Demand is shaped by buyers seeking consistent phosphorous based supply across multiple sites while limiting requalification. Adoption is increasing due to the operational cost of switching suppliers, which favors incumbents with broad product type coverage and responsive service.
How is the Non-Halogenated Flame Retardants Market segmented?
By Product Type, End-Use Industry, Application, Technology and Distribution Channel
- Phosphorous Based leads the product type category with 46.7% share in 2026 on the strength of buyer familiarity and supply availability.
- Electronics Industry leads the end-use industry category with 39.5% share as specifications standardize across buyer sites.
- PO anchors the application category, marking where incremental volume is consolidating.
Why does Phosphorous Based lead the Non-Halogenated Flame Retardants Market?
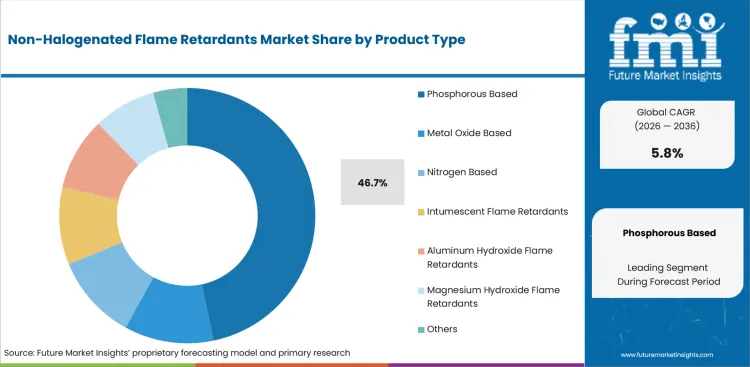
- Phosphorous Based is expected to hold 46.7% of product type revenue in 2026 because buyers retain it for predictable performance and lower requalification effort.
How big is the Electronics Industry segment in the Non-Halogenated Flame Retardants Market?
About 39.5% share, led by Electronics Industry
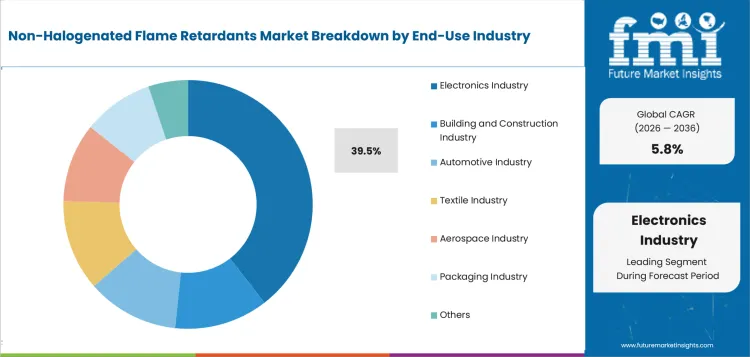
- Electronics Industry is forecast to hold 39.5% of end-use industry revenue in 2026.
How do the remaining segments shape the Non-Halogenated Flame Retardants Market?
- By application, PO is the leading category in 2026.
- By technology, Intumescent Technology is the leading category in 2026.
- By distribution channel, Direct Sales is the leading category in 2026.
What drives and restrains the Non-Halogenated Flame Retardants Market?
Driven by phosphorous based replacement demand; restrained by qualification and cost barriers
Recurring product type procurement supports expansion, while upfront cost and certification effort limit faster adoption among smaller buyers.
- Driver: materials operators sustain phosphorous based demand through replacement and capacity additions, keeping procurement recurring across the forecast period.
- Restraint: Certification and requalification effort for new product type specifications slows substitution, particularly for smaller buyers with limited engineering capacity.
- Opportunity: Suppliers offering electronics industry configurations that drop into existing workflows can widen adoption without full replacement.
Demand is shaped by buyers protecting continuity of supply, which rewards incumbents with broad product type portfolios.
Which factors support expansion in the Non-Halogenated Flame Retardants Market?
Replacement demand, standardization, and service coverage support market value
- Market value is supported by phosphorous based replacement purchases before aftermarket and service revenue accrues.
- Supplier pricing reflects product type performance and availability before service coverage affects renewal demand.
- Buyers compare qualification time and support response before committing to multi-site standardization on electronics industry.
Which countries are growing fastest in the Non-Halogenated Flame Retardants Market?
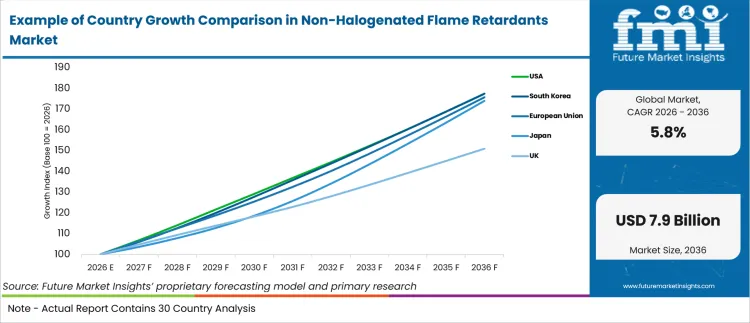
| Country / Region | CAGR |
|---|---|
| USA | 5.9% |
| South Korea | 5.9% |
| European Union | 5.8% |
| Japan | 5.7% |
| UK | 4.2% |
Source: FMI's proprietary forecasting model and primary research
How do country-level CAGRs compare in the market?
Country growth in the market is expected to vary through 2036, with USA at 5.9%, South Korea at 5.9%, European Union at 5.8%, Japan at 5.7%, and UK at 4.2%. USA is projected to grow fastest among the profiled countries and UK the slowest. Higher-growth markets are shaped more by new demand formation, while established markets weigh documented performance and supply continuity before account expansion.
- USA is projected at 5.9% CAGR through 2036. Buyers in USA weight tariff structures on imported grades heavily when committing to new specifications. USA's exposure to reshoring and infrastructure-bill allocations keeps replacement and expansion spending firm. Where tariff structures on imported grades applies, specification activity concentrates in the Northeast and West Coast metro corridors.
- South Korea is projected at 5.9% CAGR through 2036. South Korea demand rests on battery and electronics downstream pull, with domestic producer integration with chaebol supply chains adding a second pillar of support. Procurement in South Korea tracks battery and electronics downstream pull, which sets the pace of new commitments. Domestic producer integration with chaebol supply chains underwrites multi-year demand visibility rather than spot purchasing.
- European Union is projected at 5.8% CAGR through 2036. European Union demand rests on EU REACH compliance, with carbon-border adjustment exposure adding a second pillar of support. EU REACH compliance is the primary pull, converting policy intent into firm electronics industry orders. Procurement in European Union tracks carbon-border adjustment exposure, which sets the pace of new commitments.
- Japan is projected at 5.7% CAGR through 2036. Japan demand rests on JIS conformity and long qualification cycles, with high-purity grade specialization adding a second pillar of support. JIS conformity and long qualification cycles is the primary pull, converting policy intent into firm electronics industry orders. Where high-purity grade specialization applies, specification activity concentrates in the Greater Tokyo and Kansai regions.
- UK is projected at 4.2% CAGR through 2036. UK's trajectory is set less by price than by energy and feedstock cost volatility. Energy and feedstock cost volatility is the primary pull, converting policy intent into firm electronics industry orders. Buyers cite post-Brexit chemical registration (UK REACH) as the reason electronics industry budgets are released ahead of schedule.
Who are the leading companies in the Non-Halogenated Flame Retardants Market?
Clariant International Ltd., Albemarle Corporation, Israel Chemicals Ltd. (ICL), LANXESS AG and BASF SE
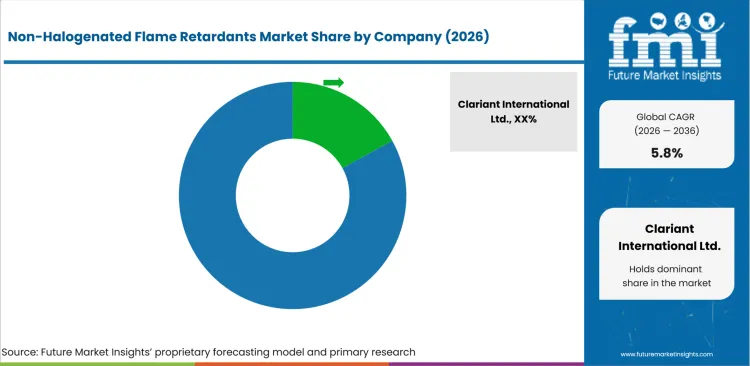
Clariant International Ltd. and Albemarle Corporation compete through supply depth and qualification support across materials buyers. Israel Chemicals Ltd. (ICL) maintains position through portfolio breadth, while service coverage and lead-time reliability are further competitive levers.
Who are the key players in the Non-Halogenated Flame Retardants Market?
Key global companies leading the market include:
- Clariant International Ltd., Albemarle Corporation, Israel Chemicals Ltd. (ICL), LANXESS AG and BASF SE maintain leading positions through established manufacturing, portfolio breadth, and direct procurement relationships.
- Italmatch Chemicals S.p.A, Nabaltec AG and FRX Polymers Inc. compete through specialized configurations, competitive pricing, and localized distribution in high-growth markets.
- DuPont de Nemours, Inc. targets underserved applications and regional markets to establish initial procurement positions.
How do top Non-Halogenated Flame Retardants Market companies compare?
Clariant International Ltd. and Albemarle Corporation lead on scale; Israel Chemicals Ltd. (ICL) also has a global footprint, while LANXESS AG and BASF SE are more regionally concentrated.
| Company | Portfolio Breadth | Qualification Depth | Supply Scale | Geographic Footprint |
|---|---|---|---|---|
| Clariant International Ltd. | High | High | Strong | Global |
| Albemarle Corporation | High | High | Strong | Global |
| Israel Chemicals Ltd. (ICL) | Medium | Medium | Moderate | Global |
| LANXESS AG | High | Medium | Moderate | Regional |
| BASF SE | Medium | Medium | Moderate | Regional |
Source: Future Market Insights competitive analysis, 2026.
Key Players in the Non-Halogenated Flame Retardants Market
Integrated Producers
- Clariant International Ltd.
- LANXESS AG
- Nabaltec AG
- DuPont de Nemours, Inc.
Specialty Suppliers
- Albemarle Corporation
- BASF SE
- FRX Polymers Inc.
Regional Players
- Israel Chemicals Ltd. (ICL)
- Italmatch Chemicals S.p.A
- Huber Engineered Materials
Non-Halogenated Flame Retardants Market - Scope & Definition
| Attribute | Detail |
|---|---|
| Market Definition | Products and solutions within the non-halogenated flame retardants market spanning Product Type, End-Use Industry and Application categories |
| Key Segments Covered | Phosphorous Based, Electronics Industry and PO and related materials applications |
| Applications Covered | PO, Epoxy, UPE and Rubber |
| End-Use Industries | Electronics Industry, Building and Construction Industry, Automotive Industry and Textile Industry |
| Inclusions | Commercially sold product type, end-use industry, and associated configurations |
| Exclusions | Custom one-off systems, standalone services, and raw inputs outside the non-halogenated flame retardants market boundary |
Non-Halogenated Flame Retardants Market - Research Methodology
| Method | Description |
|---|---|
| Primary Research | FMI analyst interviews with materials suppliers, distributors, and procurement teams across major markets |
| Desk Research | Review of official activity data, regulatory releases, company disclosures, and production statistics |
| Market Sizing & Forecasting | Bottom-up sizing using segment revenue, adoption rates, replacement demand, and country-level activity |
| Data Validation | Cross-verification against public evidence, supplier portfolios, and official indicators |
What does the Non-Halogenated Flame Retardants Market report cover?
2021 to 2025 history and 2026 to 2036 forecasts across all segments and 30+ countries
| Parameter | Details |
|---|---|
| Forecast period | 2026 to 2036 |
| Historical period | 2021 to 2025 |
| Quantitative unit | Revenue in USD billion |
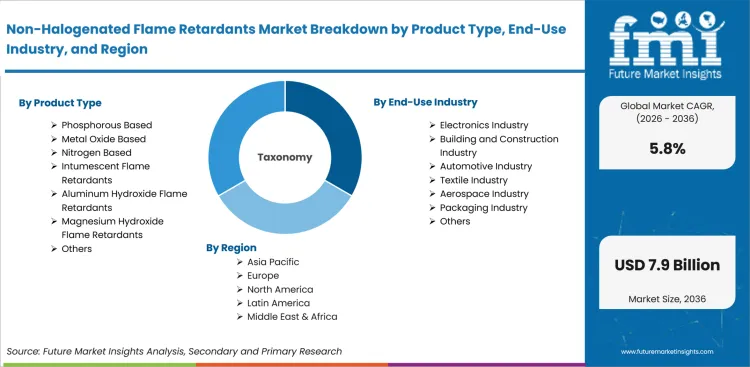
| By Product Type | Phosphorous Based, Metal Oxide Based, Nitrogen Based, Intumescent Flame Retardants, Aluminum Hydroxide Flame Retardants and Magnesium Hydroxide Flame Retardants |
| By End-Use Industry | Electronics Industry, Building and Construction Industry, Automotive Industry, Textile Industry, Aerospace Industry and Packaging Industry |
| By Application | PO, Epoxy, UPE, Rubber, PVC and PU |
| By Technology | Intumescent Technology, Endothermic Decomposition Technology and Gas Phase Radical Quenching |
| By Distribution Channel | Direct Sales, Distributor Sales and Online Sales |
| Regions covered | North America, Latin America, Western Europe, Eastern Europe, East Asia, South Asia and Pacific, Middle East and Africa |
| Countries covered | USA, South Korea, European Union (Western and Eastern Europe), Japan, UK |
| Key companies profiled | Clariant International Ltd., Albemarle Corporation, Israel Chemicals Ltd. (ICL), LANXESS AG and BASF SE |
| Approach | Bottom-up segment-boundary approach using adoption, replacement demand, and supplier disclosures |
Market Segmentation Analysis
Non-Halogenated Flame Retardants Market Segmented by Product Type:
- Phosphorous Based
- Ammonium Polyphosphate
- Red Phosphorus
- Organophosphorus Compounds
- Metal Oxide Based
- Nitrogen Based
- Melamine
- Melamine Derivatives
- Intumescent Flame Retardants
- Expandable Graphite Systems
- Intumescent Coating Systems
- Aluminum Hydroxide Flame Retardants
- Standard Aluminum Hydroxide
- Surface Treated Aluminum Hydroxide
- Magnesium Hydroxide Flame Retardants
- Standard Magnesium Hydroxide
- Modified Magnesium Hydroxide
- Others
Non-Halogenated Flame Retardants Market Segmented by End-Use Industry:
- Electronics Industry
- Consumer Electronics
- Industrial Electronics
- Building and Construction Industry
- Residential Construction
- Commercial Construction
- Automotive Industry
- Passenger Vehicles
- Commercial Vehicles
- Textile Industry
- Industrial Textiles
- Apparel
- Aerospace Industry
- Aircraft Manufacturers
- Packaging Industry
- Packaging Manufacturers
- Others
Non-Halogenated Flame Retardants Market Segmented by Application:
- PO
- Epoxy
- UPE
- Rubber
- PVC
- PU
- Styrenics
- ETP
- Others
Non-Halogenated Flame Retardants Market Segmented by Technology:
- Intumescent Technology
- Char Forming Systems
- Endothermic Decomposition Technology
- Heat Absorbing Systems
- Gas Phase Radical Quenching
- Flame Inhibition Systems
Non-Halogenated Flame Retardants Market Segmented by Distribution Channel:
- Direct Sales
- OEM Supply Agreements
- Industrial Contracts
- Distributor Sales
- Chemical Distributors
- Regional Suppliers
- Online Sales
- E Commerce Platforms
- Company Websites
Non-Halogenated Flame Retardants Market by Region:
- North America
- USA
- Canada
- Mexico
- Latin America
- Brazil
- Chile
- Rest of Latin America
- Western Europe
- Germany
- UK
- Italy
- Spain
- France
- Nordic
- BENELUX
- Rest of Western Europe
- Eastern Europe
- Russia
- Poland
- Hungary
- Balkan & Baltic
- Rest of Eastern Europe
- East Asia
- China
- Japan
- South Korea
- South Asia and Pacific
- India
- ASEAN
- Australia & New Zealand
- Rest of South Asia and Pacific
- Middle East & Africa
- Kingdom of Saudi Arabia
- Other GCC Countries
- Türkiye
- South Africa
- Other African Union
- Rest of Middle East & Africa
Research Sources and Bibliography
- World Bank. (2026, March). World development indicators database.
- International Trade Centre. (2025, November). Trade statistics for international business development.
- OECD. (2026, February). Economic outlook and industry statistics.
- USA Geological Survey. (2026, January). Mineral commodity summaries 2026.
- European Chemicals Agency. (2025, November). REACH registered substances database.
This bibliography is provided for reader reference and is not exhaustive.
This Report Answers
- Market size estimates for 2026 and forecasts through 2036 for the non-halogenated flame retardants market.
- Segment demand across product type and end-use industry with leading sub-segment shares.
- Country-level growth analysis covering USA, South Korea, European Union, Japan and other markets.
- Company positioning across Clariant International Ltd., Albemarle Corporation and Israel Chemicals Ltd. (ICL) and regional players.
- Assessment of drivers and restraints with procurement patterns across end-use buyers.
Frequently Asked Questions
What should procurement leaders evaluate before selecting suppliers?
Procurement leaders should evaluate specification evidence, second-source availability, service response, price discipline and fit with product type requirements across electronics industry, building and construction industry, automotive industry and textile industry.
What is a restraint in the Non-Halogenated Flame Retardants Market?
The main restraint is proof burden. Buyers slow down when non-halogenated flame retardants lacks the specification evidence, testing records or supplier response needed for account approval. Certification and requalification effort for new product type specifications slows substitution, particularly for smaller buyers with limited engineering capacity.
Where should a new buyer start in the non-halogenated flame retardants market?
Phosphorous Based is usually the starting point, because buyers retain it for predictable performance and lower requalification effort. Within product type it carries the widest supply availability, which shortens qualification for a first order.
What business problem does the Non-Halogenated Flame Retardants Market address?
The market addresses a practical operating gap. Buyers need non-halogenated flame retardants formats that perform in the intended use case while fitting current sourcing, qualification and service workflows across PO, epoxy, UPE and rubber.
Which companies compete in the Non-Halogenated Flame Retardants Market?
Key companies include Clariant International Ltd., LANXESS AG, Nabaltec AG, DuPont de Nemours, Inc., Albemarle Corporation, BASF SE, FRX Polymers Inc. and Israel Chemicals Ltd. (ICL). Competition is focused on qualification time, second-source availability, portfolio breadth and support response.
Table of Content
- Key Takeaways
- Market Size and CAGR
- Top Growth Driver
- Fastest Growing Segment
- Leading Region
- Key Companies
- Emerging Opportunities
- Executive Summary
- Global Market Outlook
- Demand-side Trends
- Supply-side Trends
- Technology Roadmap Analysis
- Analysis and Recommendations
- Analyst Perspective (What is happening? Why now? What should investors know?)
- Key Questions Answered
- How large is the market?
- What is the CAGR?
- What are key trends?
- Which region dominates?
- Who are the leaders?
- Market Overview
- Market Coverage / Taxonomy
- Market Definition / Scope / Limitations
- Research Methodology
- Chapter Orientation
- Analytical Lens and Working Hypotheses
- Market Structure, Signals, and Trend Drivers
- Benchmarking and Cross-market Comparability
- Market Sizing, Forecasting, and Opportunity Mapping
- Research Design and Evidence Framework
- Desk Research Programme (Secondary Evidence)
- Expert Input and Fieldwork (Primary Evidence)
- Tooling, Models, and Reference Databases
- Data Engineering and Model Build
- Quality Assurance and Audit Trail
- Market Background
- Market Dynamics (Drivers, Restraints, Opportunity, Trends)
- Scenario Forecast (Optimistic, Likely, Conservative)
- Impact Analysis
- AI Impact
- Sustainability Impact
- Regulatory Impact
- Technology Impact
- Consumer / Buyer Analysis
- Purchase Drivers
- Adoption Barriers
- Buyer Journey
- Opportunity Map Analysis
- Product Life Cycle Analysis
- Supply Chain Analysis
- Investment Feasibility Matrix
- Value Chain Analysis
- PESTLE and Porter's Analysis
- Regulatory Landscape
- Regional Parent Market Outlook
- Production and Consumption Statistics
- Import and Export Statistics
- Global Market Analysis and Forecast, 2021 to 2036
- Historical Market Size Value (USD Billion) Analysis, 2021 to 2025
- Current and Future Market Size Value (USD Billion) Projections, 2026 to 2036
- Y-o-Y Growth Trend Analysis
- Absolute $ Opportunity Analysis
- Global Market Pricing Analysis, 2021 to 2036
- Global Market Analysis and Forecast, By Product Type, 2021 to 2036
- Introduction / Key Findings
- Historical Market Size Value (USD Billion) Analysis By Product Type, 2021 to 2025
- Current and Future Market Size Value (USD Billion) Analysis and Forecast By Product Type, 2026 to 2036
- Phosphorous Based
- Ammonium Polyphosphate
- Red Phosphorus
- Organophosphorus Compounds
- Metal Oxide Based
- Nitrogen Based
- Melamine
- Melamine Derivatives
- Intumescent Flame Retardants
- Expandable Graphite Systems
- Intumescent Coating Systems
- Aluminum Hydroxide Flame Retardants
- Standard Aluminum Hydroxide
- Surface Treated Aluminum Hydroxide
- Magnesium Hydroxide Flame Retardants
- Standard Magnesium Hydroxide
- Modified Magnesium Hydroxide
- Others
- Phosphorous Based
- Y-o-Y Growth Trend Analysis By Product Type, 2021 to 2025
- Absolute $ Opportunity Analysis By Product Type, 2026 to 2036
- Global Market Analysis and Forecast, By End-Use Industry, 2021 to 2036
- Introduction / Key Findings
- Historical Market Size Value (USD Billion) Analysis By End-Use Industry, 2021 to 2025
- Current and Future Market Size Value (USD Billion) Analysis and Forecast By End-Use Industry, 2026 to 2036
- Electronics Industry
- Consumer Electronics
- Industrial Electronics
- Building and Construction Industry
- Residential Construction
- Commercial Construction
- Automotive Industry
- Passenger Vehicles
- Commercial Vehicles
- Textile Industry
- Industrial Textiles
- Apparel
- Aerospace Industry
- Aircraft Manufacturers
- Packaging Industry
- Packaging Manufacturers
- Others
- Electronics Industry
- Y-o-Y Growth Trend Analysis By End-Use Industry, 2021 to 2025
- Absolute $ Opportunity Analysis By End-Use Industry, 2026 to 2036
- Global Market Analysis and Forecast, By Application, 2021 to 2036
- Introduction / Key Findings
- Historical Market Size Value (USD Billion) Analysis By Application, 2021 to 2025
- Current and Future Market Size Value (USD Billion) Analysis and Forecast By Application, 2026 to 2036
- PO
- Epoxy
- UPE
- Rubber
- PVC
- PU
- Styrenics
- ETP
- Others
- PO
- Y-o-Y Growth Trend Analysis By Application, 2021 to 2025
- Absolute $ Opportunity Analysis By Application, 2026 to 2036
- Global Market Analysis and Forecast, By Technology, 2021 to 2036
- Introduction / Key Findings
- Historical Market Size Value (USD Billion) Analysis By Technology, 2021 to 2025
- Current and Future Market Size Value (USD Billion) Analysis and Forecast By Technology, 2026 to 2036
- Intumescent Technology
- Char Forming Systems
- Endothermic Decomposition Technology
- Heat Absorbing Systems
- Gas Phase Radical Quenching
- Flame Inhibition Systems
- Intumescent Technology
- Y-o-Y Growth Trend Analysis By Technology, 2021 to 2025
- Absolute $ Opportunity Analysis By Technology, 2026 to 2036
- Global Market Analysis and Forecast, By Distribution Channel, 2021 to 2036
- Introduction / Key Findings
- Historical Market Size Value (USD Billion) Analysis By Distribution Channel, 2021 to 2025
- Current and Future Market Size Value (USD Billion) Analysis and Forecast By Distribution Channel, 2026 to 2036
- Direct Sales
- OEM Supply Agreements
- Industrial Contracts
- Distributor Sales
- Chemical Distributors
- Regional Suppliers
- Online Sales
- E Commerce Platforms
- Company Websites
- Direct Sales
- Y-o-Y Growth Trend Analysis By Distribution Channel, 2021 to 2025
- Absolute $ Opportunity Analysis By Distribution Channel, 2026 to 2036
- Global Market Analysis and Forecast, By Region, 2021 to 2036
- Introduction
- Historical Market Size Value (USD Billion) Analysis By Region, 2021 to 2025
- Current Market Size Value (USD Billion) Analysis and Forecast By Region, 2026 to 2036
- North America
- Latin America
- Western Europe
- Eastern Europe
- East Asia
- South Asia and Pacific
- Middle East and Africa
- Market Attractiveness Analysis By Region
- North America Market Analysis and Forecast, By Country, 2021 to 2036
- Historical Market Size Value (USD Billion) Trend Analysis By Market Taxonomy, 2021 to 2025
- Market Size Value (USD Billion) Forecast By Market Taxonomy, 2026 to 2036
- By Country
- USA
- Canada
- By Product Type
- By End-Use Industry
- By Application
- By Technology
- By Distribution Channel
- By Country
- Market Attractiveness Analysis
- By Country
- By Product Type
- By End-Use Industry
- By Application
- By Technology
- By Distribution Channel
- Key Takeaways
- Latin America Market Analysis and Forecast, By Country
- Historical Market Size Value (USD Billion) Trend Analysis By Market Taxonomy, 2021 to 2025
- Market Size Value (USD Billion) Forecast By Market Taxonomy, 2026 to 2036
- By Country
- Brazil
- Mexico
- Chile
- Rest of Latin America
- By Product Type
- By End-Use Industry
- By Application
- By Technology
- By Distribution Channel
- By Country
- Market Attractiveness Analysis
- By Country
- By Product Type
- By End-Use Industry
- By Application
- By Technology
- By Distribution Channel
- Key Takeaways
- Western Europe Market Analysis and Forecast, By Country
- Historical Market Size Value (USD Billion) Trend Analysis By Market Taxonomy, 2021 to 2025
- Market Size Value (USD Billion) Forecast By Market Taxonomy, 2026 to 2036
- By Country
- Germany
- UK
- Italy
- Spain
- France
- Nordic
- BENELUX
- Rest of Western Europe
- By Product Type
- By End-Use Industry
- By Application
- By Technology
- By Distribution Channel
- By Country
- Market Attractiveness Analysis
- By Country
- By Product Type
- By End-Use Industry
- By Application
- By Technology
- By Distribution Channel
- Key Takeaways
- Eastern Europe Market Analysis and Forecast, By Country
- Historical Market Size Value (USD Billion) Trend Analysis By Market Taxonomy, 2021 to 2025
- Market Size Value (USD Billion) Forecast By Market Taxonomy, 2026 to 2036
- By Country
- Russia
- Poland
- Hungary
- Balkan & Baltic
- Rest of Eastern Europe
- By Product Type
- By End-Use Industry
- By Application
- By Technology
- By Distribution Channel
- By Country
- Market Attractiveness Analysis
- By Country
- By Product Type
- By End-Use Industry
- By Application
- By Technology
- By Distribution Channel
- Key Takeaways
- East Asia Market Analysis and Forecast, By Country
- Historical Market Size Value (USD Billion) Trend Analysis By Market Taxonomy, 2021 to 2025
- Market Size Value (USD Billion) Forecast By Market Taxonomy, 2026 to 2036
- By Country
- China
- Japan
- South Korea
- By Product Type
- By End-Use Industry
- By Application
- By Technology
- By Distribution Channel
- By Country
- Market Attractiveness Analysis
- By Country
- By Product Type
- By End-Use Industry
- By Application
- By Technology
- By Distribution Channel
- Key Takeaways
- South Asia and Pacific Market Analysis and Forecast, By Country
- Historical Market Size Value (USD Billion) Trend Analysis By Market Taxonomy, 2021 to 2025
- Market Size Value (USD Billion) Forecast By Market Taxonomy, 2026 to 2036
- By Country
- India
- ASEAN
- Australia & New Zealand
- Rest of South Asia and Pacific
- By Product Type
- By End-Use Industry
- By Application
- By Technology
- By Distribution Channel
- By Country
- Market Attractiveness Analysis
- By Country
- By Product Type
- By End-Use Industry
- By Application
- By Technology
- By Distribution Channel
- Key Takeaways
- Middle East and Africa Market Analysis and Forecast, By Country
- Historical Market Size Value (USD Billion) Trend Analysis By Market Taxonomy, 2021 to 2025
- Market Size Value (USD Billion) Forecast By Market Taxonomy, 2026 to 2036
- By Country
- Kingdom of Saudi Arabia
- Other GCC Countries
- Türkiye
- South Africa
- Other African Union
- Rest of Middle East and Africa
- By Product Type
- By End-Use Industry
- By Application
- By Technology
- By Distribution Channel
- By Country
- Market Attractiveness Analysis
- By Country
- By Product Type
- By End-Use Industry
- By Application
- By Technology
- By Distribution Channel
- Key Takeaways
- Key Countries Market Analysis
- USA
- Pricing Analysis
- Market Share Analysis, 2025
- By Product Type
- By End-Use Industry
- By Application
- By Technology
- By Distribution Channel
- Canada
- Pricing Analysis
- Market Share Analysis, 2025
- By Product Type
- By End-Use Industry
- By Application
- By Technology
- By Distribution Channel
- Mexico
- Pricing Analysis
- Market Share Analysis, 2025
- By Product Type
- By End-Use Industry
- By Application
- By Technology
- By Distribution Channel
- Brazil
- Pricing Analysis
- Market Share Analysis, 2025
- By Product Type
- By End-Use Industry
- By Application
- By Technology
- By Distribution Channel
- Chile
- Pricing Analysis
- Market Share Analysis, 2025
- By Product Type
- By End-Use Industry
- By Application
- By Technology
- By Distribution Channel
- Germany
- Pricing Analysis
- Market Share Analysis, 2025
- By Product Type
- By End-Use Industry
- By Application
- By Technology
- By Distribution Channel
- UK
- Pricing Analysis
- Market Share Analysis, 2025
- By Product Type
- By End-Use Industry
- By Application
- By Technology
- By Distribution Channel
- Italy
- Pricing Analysis
- Market Share Analysis, 2025
- By Product Type
- By End-Use Industry
- By Application
- By Technology
- By Distribution Channel
- Spain
- Pricing Analysis
- Market Share Analysis, 2025
- By Product Type
- By End-Use Industry
- By Application
- By Technology
- By Distribution Channel
- France
- Pricing Analysis
- Market Share Analysis, 2025
- By Product Type
- By End-Use Industry
- By Application
- By Technology
- By Distribution Channel
- India
- Pricing Analysis
- Market Share Analysis, 2025
- By Product Type
- By End-Use Industry
- By Application
- By Technology
- By Distribution Channel
- ASEAN
- Pricing Analysis
- Market Share Analysis, 2025
- By Product Type
- By End-Use Industry
- By Application
- By Technology
- By Distribution Channel
- Australia & New Zealand
- Pricing Analysis
- Market Share Analysis, 2025
- By Product Type
- By End-Use Industry
- By Application
- By Technology
- By Distribution Channel
- China
- Pricing Analysis
- Market Share Analysis, 2025
- By Product Type
- By End-Use Industry
- By Application
- By Technology
- By Distribution Channel
- Japan
- Pricing Analysis
- Market Share Analysis, 2025
- By Product Type
- By End-Use Industry
- By Application
- By Technology
- By Distribution Channel
- South Korea
- Pricing Analysis
- Market Share Analysis, 2025
- By Product Type
- By End-Use Industry
- By Application
- By Technology
- By Distribution Channel
- Russia
- Pricing Analysis
- Market Share Analysis, 2025
- By Product Type
- By End-Use Industry
- By Application
- By Technology
- By Distribution Channel
- Poland
- Pricing Analysis
- Market Share Analysis, 2025
- By Product Type
- By End-Use Industry
- By Application
- By Technology
- By Distribution Channel
- Hungary
- Pricing Analysis
- Market Share Analysis, 2025
- By Product Type
- By End-Use Industry
- By Application
- By Technology
- By Distribution Channel
- Kingdom of Saudi Arabia
- Pricing Analysis
- Market Share Analysis, 2025
- By Product Type
- By End-Use Industry
- By Application
- By Technology
- By Distribution Channel
- Türkiye
- Pricing Analysis
- Market Share Analysis, 2025
- By Product Type
- By End-Use Industry
- By Application
- By Technology
- By Distribution Channel
- South Africa
- Pricing Analysis
- Market Share Analysis, 2025
- By Product Type
- By End-Use Industry
- By Application
- By Technology
- By Distribution Channel
- USA
- Market Structure Analysis
- Competition Dashboard
- Competition Benchmarking
- Market Share Analysis of Top Players
- By Regional
- By Product Type
- By End-Use Industry
- By Application
- By Technology
- By Distribution Channel
- Emerging Startups
- Innovation Benchmarking
- Competition Analysis
- Competition Deep Dive
- Clariant International Ltd.
- Overview
- Product Portfolio
- Profitability by Market Segments
- Sales Footprint
- Strategy Overview
- Marketing Strategy
- Product Strategy
- Channel Strategy
- Albemarle Corporation
- Israel Chemicals Ltd. (ICL)
- LANXESS AG
- BASF SE
- Italmatch Chemicals S.p.A
- Nabaltec AG
- FRX Polymers Inc.
- Huber Engineered Materials
- DuPont de Nemours, Inc.
- Clariant International Ltd.
- Case Studies
- Success Stories
- Recent Developments
- Competition Deep Dive
- Assumptions & Acronyms Used


