Reports

- Global Locations -

Headquarters

Future Market Insights, Inc.

Christiana Corporate, 200
Continental Drive, Suite 401,
Newark, Delaware - 19713,
United States

T: +1-845-579-5705

Americas

Future Market Insights, Inc.

616 Corporate Way, Suite 2-9018,
Valley Cottage, NY 10989, United States

T: +1-347-918-3531

MEA

Future Market Insights

1602-6 Jumeirah Bay X2 Tower, Plot No: JLT-PH2-X2A,
Jumeirah Lakes Towers, Dubai,
United Arab Emirates

Europe

Future Market Insights

3rd Floor, 207 Regent Street,
W1B 3HH London
United Kingdom

T: + 44 (0) 20 8123 9659
D: +44 (0) 20 3287 4268

Asia Pacific

Future Market Insights

IndiaLand Global Tech Park, Unit UG-1, Behind Grand HighStreet, Phase 1, Hinjawadi, MH, Pune – 411057, India

Algal Protein Market Snapshot (2023 to 2033)

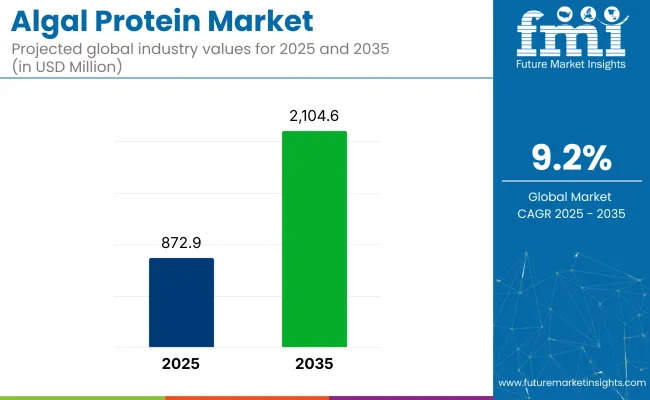
The estimated size of the algal protein market in 2022 was close to US$ 703.89 million. A shift in consumer preference from adopting animal-based proteins to plant-based alternatives is estimated to augment the demand for algal protein. It is likely to have produced US$ 1,772.7 million by 2033, alongside a CAGR of 9% from 2023 to 2033.

Algae is one of the abundant forms of plant life that contains chlorophyll, found in both marines as well as freshwaters. Algal protein is the protein derived from algae, ranging from single cell microalgae to large seaweeds. The protein derived from different algae, such as microalgae and seaweed, contains high protein levels.

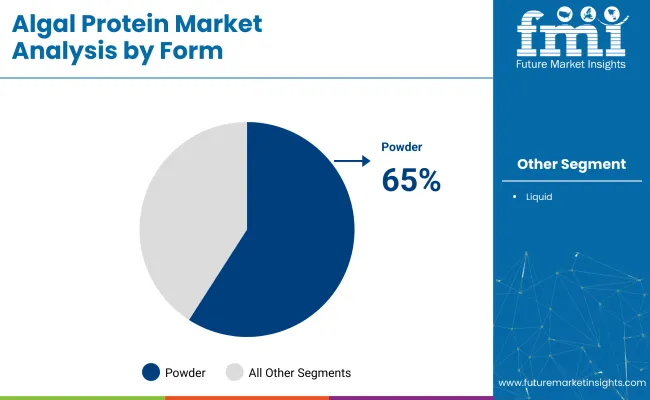
Algae living in marine waters consist of protein nearly 60% of its weight, which is higher in comparison to algae living in freshwater. Algal proteins are commonly extracted from specific types of algae such as green algae, red algae, and blue algae, which can be processed into diverse forms such as powder, liquid, pastes, and capsules.

Report Attribute Details
Estimated Market Value (2022) US$ 703.89 million
Expected Market Value (2023) US$ 732 million
Projected Forecast Value (2033) US$ 1,772.7 million
Anticipated Growth Rate (2023 to 2033) 9%

Don't pay for what you don't need

Customize your report by selecting specific countries or regions and save 30%!

Algal Protein Market Historical Analysis (2018 to 2022) Vs. Forecast Outlook (2023 to 2033)

The algal protein market is estimated to have reached a sum of US$ 624.2 million in 2018. During the historical period, 2018 to 2022, the algal protein market registered a 3.0% CAGR.

Some algae such as chlorella and spirulina compose high protein content. For instance, chlorella contains around 58 grams of protein in 100 grams of it, which is significantly higher compared to animal protein. Freshwater algal proteins are majorly derived from spirulina, which is a cyanobacterium (green-blue algae) and is one of the richest sources of protein that contains all essential minerals, carotenoids, and amino acids.

Increasing consumption of algal proteins, owing to the growing awareness regarding their health benefits is estimated to bolster the sales in the global market.

What is primarily Driving the Regional Market for Algal Proteins?

Applications across various end-use Industries to Bolster Demand

Algal proteins extracted from marine and freshwater algae are gaining immense popularity among industries such as food & beverage, animal feed, and cosmetics, owing to their excellent nutritional capabilities, amino acid profile, cells damage repairing properties, and others.

These proteins are finding a wide range of application across the nutrition and supplement sectors, as consumption of algal proteins assist in boosting the immune system, reducing fatigue, improving digestion, building endurance, and boosting energy levels. Algal proteins are increasingly being adopted by athletes, sportspersons, bodybuilders, and others, thereby, facilitating the growth in the market.

A swift rise in trend of veganism and vegetarianism is being witnessed across the globe, due to the rising awareness regarding physical health, animal welfare, and ethical reasons. For instance, according to a report by the MaedAlertHelp Organization, the population of vegans has reached around 79 million across the globe by January 2021. This rise in vegetarian and vegan population is estimated to accelerate the sales of plant-based proteins such as algal proteins, thereby, bolstering the growth in the global market.

Nandini Roy Choudhury

Principal Consultant

Talk to Analyst

Find your sweet spots for generating winning opportunities in this market.

What are the Challenges Faced by the Algal Protein Market?

Global Warming and Increasing Costs of Raw Materials to Impede the Growth

Cultivation of algae predominantly depends upon the air moisture content and climatic conditions. High temperature affects the cultivation of algae such as spirulina, preventing the formation of thicker algae due to high rate of water evaporation.

Increasing temperature across the world due to global warming and rising instances such as draught and changes in the salinity of freshwaters is declining the production of algae, which is in turn, hindering the growth in the market. Extravagant cost of algal protein and rising availability of various plant-based protein alternatives such as soy protein, pea protein, and others are hampering the sales of algal protein in the market.

Category-wise Insights

Which Type of Algal Protein is Likely to Gain Traction during the Forecast Period?

Spirulina is Likely to Hold the Leading Market share by Type

Spirulina commanded the largest market share in the type sector in 2022, contributing to about 62% of global market revenue. Spirulina is a high source of protein when compared to other sources made from plants since it has fifty percent to seventy percent protein by dry mass, while soy flour only has 35%. The qualities of spirulina, including as its high mineral and vitamin concentrations, low nucleic acid concentration, and ease of cell wall digestion when compared to other microorganisms, have drawn the attention of several food and feed makers.

Spirulina is increasingly being used as a functional food as a result of the European Food Safety Authority's (EFSA), the Food and Drug Administration's (FDA), along with other well-known food regulatory authorities' designation of it as Generally Recognized as Safe (GRAS). Algae are becoming increasingly recognized as a crucial part of the protein problem-solving process since several species may give great protein outputs per unit of land.

By Application, Which Segment can Gain Traction during the Forecast Period?

The Dietary Segment is likely to Occupy the Lion’s Share in the Global Market

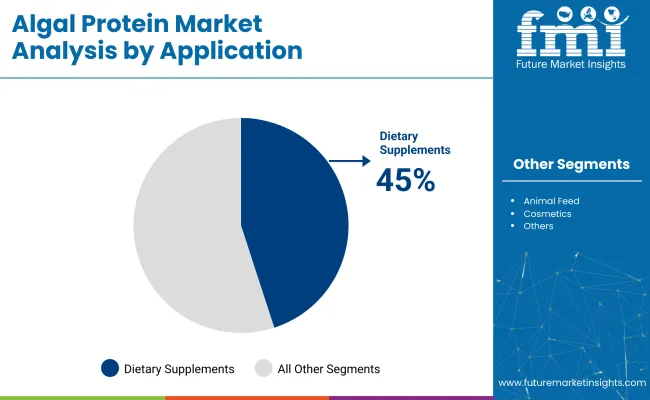
Dietary supplements represented 48.3% of the share of the overall sales in 2022. During the projected period, demand for the product is anticipated to increase owing to the expansion of the nutraceuticals industries in China, India, and Japan as a result of the increased popularity of health supplements.

Chlorella along with spirulina are well-liked algal protein-based nutritional supplements in the area and throughout the world in powder, fluid, tablet, paste, as well as capsule forms.

Get the data you need at a Fraction of the cost

Personalize your report by choosing insights you need
and save 40%!

Comparative View of the Adjacent Markets

Algal Protein Market:

Attributes Algal Protein Market
CAGR (2023 to 2033) 9%
Market Value 2023 US$ 732 million
Growth Factor Plant-based proteins have gained significant popularity in developed economies like the United States of America and Europe as people gravitate more and more toward vegan along with plant-based diets.
Future Opportunities The growing need for alternative proteins, such as algae, is anticipated to drive the growth of the algal protein market.
Market Trends Consumer demand has grown due to the increasing appeal of algae nutraceuticals, particularly spirulina-based goods, which has facilitated business expansion.

Algae Proteins Market:

Attributes Algae Proteins Market
CAGR (2023 to 2033) 5.5%
Market Value 2023 US$ 750 million
Growth Factor The increased recognition of algae as a viable and dependable source of protein might be connected to the rise in demand for algal protein.
Future Opportunities Algae protein has become a popular alternative protein and is utilized in feed, nutraceuticals, and functional foods because of its high protein concentration.
Market Trends Algal protein is being used more often in applications, since manufacturers of processed foods, nutraceuticals, and drinks are always looking for new sources of nutrients to add to the substantial protein content of their goods.

Algae Oil Market:

Attributes Algae Oil Market
CAGR (2023 to 2033) 4.7%
Market Value 2023 US$ 2.1 billion
Growth Factor One of the main factors promoting the rise of natural goods and, consequently, the market for algae oil, is their adaptability and the associated health benefits.
Future Opportunities A growing need for natural goods that are more effective has producers searching farther and further for natural ingredients; propelling the growth.
Market Trends Over the next ten years, there will be a huge increase in demand for algal oil in nutritional supplements due to the rising necessity of preserving vitals as well as boosting immunity.

Region-wise Analysis

Why is North America Emerging as an Opportunistic Algal Protein Market?

Growing Prevalence of Immune and Cardiac Diseases to Proliferate the Growth

Future Market Insights states that North America is estimated to account for the dominant share in the global algal protein market between 2022 and 2032. A significant portion of the North American algal protein market is likely to be occupied by the United States. In 2022, the United States market for algal protein was estimated to have acquired a 26.9% market share.

A significant rise in burden of diseases such as thrombosis, atherosclerosis, cancers, and arthritis is being experienced across the countries such as the United States and Canada, creating strong demand for preventive supplements. According to a study by the American Cancer Society, nearly 1.9 million new cases of cancers were estimated to be diagnosed across the USA, causing around 608,570 fatalities in the year 2021.

It assists in enhancing the immune system, improving cardiovascular function, and reducing allergies & inflammation as the algal protein contains omega-3 fatty acids and carotenoid, it is increasingly being prescribed for the prevention of aforementioned diseases. Growing prevalence of such diseases is projected to augment the demand for algal protein in the North America market.

How is Asia Pacific Contributing to the Growth of the Algal Protein Market?

Rising Demand for Plant-based Products to Aid the Market Growth

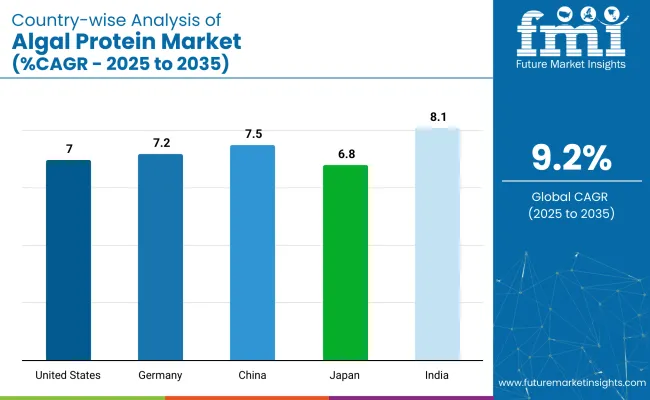
As per FMI, Asia Pacific is anticipated to project rapid growth in the global algal protein market during the forecast period 2022 to 2032. The Chinese algal protein market is anticipated to register a 10.3% CAGR through 2033. The Indian market, on the other hand, is seeking to garner a 12.5% CAGR from 2023 to 2033.

The demand for plant-based proteins is surging at a rapid pace, owing to the increasing vegetarian population and growing adoption on the back of its health benefits. Leading supplement manufacturers are increasingly emphasizing on launching novel plant-based protein products to capitalize on the existing opportunities.

For instance, in 2021, Prolgae, a leading plant-based proteins supplement company, announced launching organic sweet spirulina algae powder and protein bars in the Indian market. A multiplicity of such product launches are estimated to accelerate the sales of algal protein in the Asia Pacific Excluding Japan market.

Market Competition

Leading players are aiming at launching new products and expanding their production capacity to gain edge in the highly competitive market. A vast number of participants in the market have made the worldwide algal protein sector extremely competitive. The leading corporations are concentrating on capacity expansions, in various end-user sectors like animal feed, cosmetics, and food & beverage, collaborations, mergers & acquisitions, and new product innovations.

The key players in this market include:

  • Far East Microalgae Industries, Co., Ltd.
  • Bio-engineering Co., Ltd.
  • Tianjin Norland Biotech Co., Ltd.
  • Prolgae, NB Laboratories
  • Cyanotech Corporation, C.B.N.
  • Gong Bih Enterprise Co., Ltd.
  • Taiwan Chlorella Manufacturing Company Ltd
  • Algenol Biotech
  • Fuqing King Dnarmsa Spirulina Co., Ltd.
  • Sun Chlorella Corporation.

Some of the products being launched by the key players are:

  • Tofurky, a firm that produces plant-based meat, teamed up with Triton Algae Innovations in 2021 to market algae-based meat innovations that use Triton's essential red, protein-rich, non-GMO algae. Triton's essential red algae, which is abundant in Vitamin A, protein, and iron, is expected to play a significant role in the formulation of new products in the future as algae as well as microalgae components continue to be popular due to their sustainability advantages.
  • Corbion and Nestle SA teamed together in 2022 to advance the range of plant-based products. The two will collaborate on the creation of microalgae-based components that may be added to vegan dishes to enhance their nutrition, flavor, and sustainability. In comparison to other traditional components, Nestlé along with Corbion will create microalgae-based products that have less carbon, water, as well as land footprints.

Report Scope

Report Attribute Details
Growth Rate CAGR of 9% from 2022 to 2032
Market value in 2023 US$ 732 million
Market value in 2033 US$ 1772.7 million
Base Year for Estimation 2022
Historical Data 2018 to 2022
Forecast Period 2023 to 2033
Quantitative Units US$ million for value
Report Coverage Revenue Forecast, Volume Forecast, Company Ranking, Competitive Landscape, Growth Factors, Trends, and Pricing Analysis
Segments Covered
  • Product Form
  • Product Source
  • Type
  • Application
  • Region
Regions Covered
  • North America
  • Latin America
  • Western Europe
  • Eastern Europe
  • South Asia and Pacific
  • East Asia
  • Middle East and Africa
Key Countries Profiled
  • United States
  • Canada
  • Mexico
  • Brazil
  • Germany
  • United Kingdom
  • France
  • Spain
  • Italy
  • Poland
  • Russia
  • Czech Republic
  • Romania
  • India
  • Bangladesh
  • Australia
  • New Zealand
  • Japan
  • China
  • South Korea
  • GCC countries
  • South Africa
  • Israel
Key Companies Profiled
  • Far East Microalgae Industries, Co., Ltd.
  • Bio-engineering Co., Ltd.
  • Tianjin Norland Biotech Co., Ltd.
  • Prolgae, NB Laboratories
  • Cyanotech Corporation, C.B.N.
  • Gong Bih Enterprise Co., Ltd.
  • Taiwan Chlorella Manufacturing Company Ltd
  • Algenol Biotech
  • Fuqing King Dnarmsa Spirulina Co., Ltd.
  • Sun Chlorella Corporation
Customization & Pricing Available on Request

Key Segments Profiled in the Algal Protein Market

By Product Form:

  • Powder
  • Liquid

By Product Source:

  • Marine Algae
  • Fresh Water Algae

By Type:

  • Spirulina
  • Chlorella

By Application:

  • Dietary Supplements
  • Food & Beverage
  • Animal Feed
  • Cosmetics
  • Others

By Region:

  • North America
  • Latin America
  • Western Europe
  • Eastern Europe
  • South Asia and Pacific
  • East Asia
  • Middle East and Africa

Frequently Asked Questions

What is the anticipated growth of the algal protein market from 2023 to 2033?

The algal protein market is expected to grow at a 9% CAGR from 2023 to 2033.

What can be expected from the global market for algal protein by 2023?

By 2023, the algal protein market is estimated to gain US$ 732 million.

What is anticipated be the total market valuation by 2033?

By 2033, the algal protein market valuation might reach a sum of US$ 1772.7 million.

In comparison to the global market, what will be the outlook of the United States market?

Algal protein sales in the US were predicted to reach a market share of 26.9% in 2022.

By product type, which segment gaining traction for the sales of algal protein?

In 2022, spirulina held the greatest market share in the type sector and was responsible for nearly 62% of worldwide market revenue.

Which application of algal protein is sought to be more popular in 2023?

In 2022, dietary supplements accounted for almost 48.3% of total sales.

Table of Content

1. Executive Summary

    1.1. Global Market Outlook

    1.2. Demand-side Trends

    1.3. Supply-side Trends

    1.4. Technology Roadmap Analysis

    1.5. Analysis and Recommendations

2. Market Overview

    2.1. Market Coverage / Taxonomy

    2.2. Market Definition / Scope / Limitations

3. Market Background

    3.1. Market Dynamics

        3.1.1. Drivers

        3.1.2. Restraints

        3.1.3. Opportunity

        3.1.4. Trends

    3.2. Scenario Forecast

        3.2.1. Demand in Optimistic Scenario

        3.2.2. Demand in Likely Scenario

        3.2.3. Demand in Conservative Scenario

    3.3. Opportunity Map Analysis

    3.4. Product Life Cycle Analysis

    3.5. Supply Chain Analysis

        3.5.1. Supply Side Participants and their Roles

            3.5.1.1. Producers

            3.5.1.2. Mid-Level Participants (Traders/ Agents/ Brokers)

            3.5.1.3. Wholesalers and Distributors

        3.5.2. Value Added and Value Created at Node in the Supply Chain

        3.5.3. List of Raw Material Suppliers

        3.5.4. List of Existing and Potential Buyer’s

    3.6. Investment Feasibility Matrix

    3.7. Value Chain Analysis

        3.7.1. Profit Margin Analysis

        3.7.2. Wholesalers and Distributors

        3.7.3. Retailers

    3.8. PESTLE and Porter’s Analysis

    3.9. Regulatory Landscape

        3.9.1. By Key Regions

        3.9.2. By Key Countries

    3.10. Regional Parent Market Outlook

    3.11. Production and Consumption Statistics

    3.12. Import and Export Statistics

4. Global Market Analysis 2018 to 2022 and Forecast, 2023 to 2033

    4.1. Historical Market Size Value (US$ Million) & Volume (Tons) Analysis, 2018 to 2022

    4.2. Current and Future Market Size Value (US$ Million) & Volume (Tons) Projections, 2023 to 2033

        4.2.1. Y-o-Y Growth Trend Analysis

        4.2.2. Absolute $ Opportunity Analysis

5. Global Market Analysis 2018 to 2022 and Forecast 2023 to 2033, By Form

    5.1. Introduction / Key Findings

    5.2. Historical Market Size Value (US$ Million) & Volume (Tons) Analysis By Form, 2018 to 2022

    5.3. Current and Future Market Size Value (US$ Million) & Volume (Tons) Analysis and Forecast By Form, 2023 to 2033

        5.3.1. Powder

        5.3.2. Liquid

    5.4. Y-o-Y Growth Trend Analysis By Form, 2018 to 2022

    5.5. Absolute $ Opportunity Analysis By Form, 2023 to 2033

6. Global Market Analysis 2018 to 2022 and Forecast 2023 to 2033, By Source

    6.1. Introduction / Key Findings

    6.2. Historical Market Size Value (US$ Million) & Volume (Tons) Analysis By Source, 2018 to 2022

    6.3. Current and Future Market Size Value (US$ Million) & Volume (Tons) Analysis and Forecast By Source, 2023 to 2033

        6.3.1. Marine Algae

        6.3.2. Fresh Water Algae

    6.4. Y-o-Y Growth Trend Analysis By Source, 2018 to 2022

    6.5. Absolute $ Opportunity Analysis By Source, 2023 to 2033

7. Global Market Analysis 2018 to 2022 and Forecast 2023 to 2033, By Type

    7.1. Introduction / Key Findings

    7.2. Historical Market Size Value (US$ Million) & Volume (Tons) Analysis By Type, 2018 to 2022

    7.3. Current and Future Market Size Value (US$ Million) & Volume (Tons) Analysis and Forecast By Type, 2023 to 2033

        7.3.1. Spirulina

        7.3.2. Chlorella

    7.4. Y-o-Y Growth Trend Analysis By Type, 2018 to 2022

    7.5. Absolute $ Opportunity Analysis By Type, 2023 to 2033

8. Global Market Analysis 2018 to 2022 and Forecast 2023 to 2033, By Application

    8.1. Introduction / Key Findings

    8.2. Historical Market Size Value (US$ Million) & Volume (Tons) Analysis By Application, 2018 to 2022

    8.3. Current and Future Market Size Value (US$ Million) & Volume (Tons) Analysis and Forecast By Application, 2023 to 2033

        8.3.1. Dietary Supplements

        8.3.2. Food & Beverage

        8.3.3. Animal Feed

        8.3.4. Cosmetics

        8.3.5. Others

    8.4. Y-o-Y Growth Trend Analysis By Application, 2018 to 2022

    8.5. Absolute $ Opportunity Analysis By Application, 2023 to 2033

9. Global Market Analysis 2018 to 2022 and Forecast 2023 to 2033, By Region

    9.1. Introduction

    9.2. Historical Market Size Value (US$ Million) & Volume (Tons) Analysis By Region, 2018 to 2022

    9.3. Current Market Size Value (US$ Million) & Volume (Tons) Analysis and Forecast By Region, 2023 to 2033

        9.3.1. North America

        9.3.2. Latin America

        9.3.3. Western Europe

        9.3.4. Eastern Europe

        9.3.5. South Asia and Pacific

        9.3.6. East Asia

        9.3.7. Middle East and Africa

    9.4. Market Attractiveness Analysis By Region

10. North America Market Analysis 2018 to 2022 and Forecast 2023 to 2033, By Country

    10.1. Historical Market Size Value (US$ Million) & Volume (Tons) Trend Analysis By Market Taxonomy, 2018 to 2022

    10.2. Market Size Value (US$ Million) & Volume (Tons) Forecast By Market Taxonomy, 2023 to 2033

        10.2.1. By Country

            10.2.1.1. USA

            10.2.1.2. Canada

        10.2.2. By Form

        10.2.3. By Source

        10.2.4. By Type

        10.2.5. By Application

    10.3. Market Attractiveness Analysis

        10.3.1. By Country

        10.3.2. By Form

        10.3.3. By Source

        10.3.4. By Type

        10.3.5. By Application

    10.4. Key Takeaways

11. Latin America Market Analysis 2018 to 2022 and Forecast 2023 to 2033, By Country

    11.1. Historical Market Size Value (US$ Million) & Volume (Tons) Trend Analysis By Market Taxonomy, 2018 to 2022

    11.2. Market Size Value (US$ Million) & Volume (Tons) Forecast By Market Taxonomy, 2023 to 2033

        11.2.1. By Country

            11.2.1.1. Brazil

            11.2.1.2. Mexico

            11.2.1.3. Rest of Latin America

        11.2.2. By Form

        11.2.3. By Source

        11.2.4. By Type

        11.2.5. By Application

    11.3. Market Attractiveness Analysis

        11.3.1. By Country

        11.3.2. By Form

        11.3.3. By Source

        11.3.4. By Type

        11.3.5. By Application

    11.4. Key Takeaways

12. Western Europe Market Analysis 2018 to 2022 and Forecast 2023 to 2033, By Country

    12.1. Historical Market Size Value (US$ Million) & Volume (Tons) Trend Analysis By Market Taxonomy, 2018 to 2022

    12.2. Market Size Value (US$ Million) & Volume (Tons) Forecast By Market Taxonomy, 2023 to 2033

        12.2.1. By Country

            12.2.1.1. Germany

            12.2.1.2. UK

            12.2.1.3. France

            12.2.1.4. Spain

            12.2.1.5. Italy

            12.2.1.6. Rest of Western Europe

        12.2.2. By Form

        12.2.3. By Source

        12.2.4. By Type

        12.2.5. By Application

    12.3. Market Attractiveness Analysis

        12.3.1. By Country

        12.3.2. By Form

        12.3.3. By Source

        12.3.4. By Type

        12.3.5. By Application

    12.4. Key Takeaways

13. Eastern Europe Market Analysis 2018 to 2022 and Forecast 2023 to 2033, By Country

    13.1. Historical Market Size Value (US$ Million) & Volume (Tons) Trend Analysis By Market Taxonomy, 2018 to 2022

    13.2. Market Size Value (US$ Million) & Volume (Tons) Forecast By Market Taxonomy, 2023 to 2033

        13.2.1. By Country

            13.2.1.1. Poland

            13.2.1.2. Russia

            13.2.1.3. Czech Republic

            13.2.1.4. Romania

            13.2.1.5. Rest of Eastern Europe

        13.2.2. By Form

        13.2.3. By Source

        13.2.4. By Type

        13.2.5. By Application

    13.3. Market Attractiveness Analysis

        13.3.1. By Country

        13.3.2. By Form

        13.3.3. By Source

        13.3.4. By Type

        13.3.5. By Application

    13.4. Key Takeaways

14. South Asia and Pacific Market Analysis 2018 to 2022 and Forecast 2023 to 2033, By Country

    14.1. Historical Market Size Value (US$ Million) & Volume (Tons) Trend Analysis By Market Taxonomy, 2018 to 2022

    14.2. Market Size Value (US$ Million) & Volume (Tons) Forecast By Market Taxonomy, 2023 to 2033

        14.2.1. By Country

            14.2.1.1. India

            14.2.1.2. Bangladesh

            14.2.1.3. Australia

            14.2.1.4. New Zealand

            14.2.1.5. Rest of South Asia and Pacific

        14.2.2. By Form

        14.2.3. By Source

        14.2.4. By Type

        14.2.5. By Application

    14.3. Market Attractiveness Analysis

        14.3.1. By Country

        14.3.2. By Form

        14.3.3. By Source

        14.3.4. By Type

        14.3.5. By Application

    14.4. Key Takeaways

15. East Asia Market Analysis 2018 to 2022 and Forecast 2023 to 2033, By Country

    15.1. Historical Market Size Value (US$ Million) & Volume (Tons) Trend Analysis By Market Taxonomy, 2018 to 2022

    15.2. Market Size Value (US$ Million) & Volume (Tons) Forecast By Market Taxonomy, 2023 to 2033

        15.2.1. By Country

            15.2.1.1. China

            15.2.1.2. Japan

            15.2.1.3. South Korea

        15.2.2. By Form

        15.2.3. By Source

        15.2.4. By Type

        15.2.5. By Application

    15.3. Market Attractiveness Analysis

        15.3.1. By Country

        15.3.2. By Form

        15.3.3. By Source

        15.3.4. By Type

        15.3.5. By Application

    15.4. Key Takeaways

16. Middle East and Africa Market Analysis 2018 to 2022 and Forecast 2023 to 2033, By Country

    16.1. Historical Market Size Value (US$ Million) & Volume (Tons) Trend Analysis By Market Taxonomy, 2018 to 2022

    16.2. Market Size Value (US$ Million) & Volume (Tons) Forecast By Market Taxonomy, 2023 to 2033

        16.2.1. By Country

            16.2.1.1. GCC Countries

            16.2.1.2. South Africa

            16.2.1.3. Israel

            16.2.1.4. Rest of MEA

        16.2.2. By Form

        16.2.3. By Source

        16.2.4. By Type

        16.2.5. By Application

    16.3. Market Attractiveness Analysis

        16.3.1. By Country

        16.3.2. By Form

        16.3.3. By Source

        16.3.4. By Type

        16.3.5. By Application

    16.4. Key Takeaways

17. Key Countries Market Analysis

    17.1. USA

        17.1.1. Pricing Analysis

        17.1.2. Market Share Analysis, 2022

            17.1.2.1. By Form

            17.1.2.2. By Source

            17.1.2.3. By Type

            17.1.2.4. By Application

    17.2. Canada

        17.2.1. Pricing Analysis

        17.2.2. Market Share Analysis, 2022

            17.2.2.1. By Form

            17.2.2.2. By Source

            17.2.2.3. By Type

            17.2.2.4. By Application

    17.3. Brazil

        17.3.1. Pricing Analysis

        17.3.2. Market Share Analysis, 2022

            17.3.2.1. By Form

            17.3.2.2. By Source

            17.3.2.3. By Type

            17.3.2.4. By Application

    17.4. Mexico

        17.4.1. Pricing Analysis

        17.4.2. Market Share Analysis, 2022

            17.4.2.1. By Form

            17.4.2.2. By Source

            17.4.2.3. By Type

            17.4.2.4. By Application

    17.5. Germany

        17.5.1. Pricing Analysis

        17.5.2. Market Share Analysis, 2022

            17.5.2.1. By Form

            17.5.2.2. By Source

            17.5.2.3. By Type

            17.5.2.4. By Application

    17.6. UK

        17.6.1. Pricing Analysis

        17.6.2. Market Share Analysis, 2022

            17.6.2.1. By Form

            17.6.2.2. By Source

            17.6.2.3. By Type

            17.6.2.4. By Application

    17.7. France

        17.7.1. Pricing Analysis

        17.7.2. Market Share Analysis, 2022

            17.7.2.1. By Form

            17.7.2.2. By Source

            17.7.2.3. By Type

            17.7.2.4. By Application

    17.8. Spain

        17.8.1. Pricing Analysis

        17.8.2. Market Share Analysis, 2022

            17.8.2.1. By Form

            17.8.2.2. By Source

            17.8.2.3. By Type

            17.8.2.4. By Application

    17.9. Italy

        17.9.1. Pricing Analysis

        17.9.2. Market Share Analysis, 2022

            17.9.2.1. By Form

            17.9.2.2. By Source

            17.9.2.3. By Type

            17.9.2.4. By Application

    17.10. Poland

        17.10.1. Pricing Analysis

        17.10.2. Market Share Analysis, 2022

            17.10.2.1. By Form

            17.10.2.2. By Source

            17.10.2.3. By Type

            17.10.2.4. By Application

    17.11. Russia

        17.11.1. Pricing Analysis

        17.11.2. Market Share Analysis, 2022

            17.11.2.1. By Form

            17.11.2.2. By Source

            17.11.2.3. By Type

            17.11.2.4. By Application

    17.12. Czech Republic

        17.12.1. Pricing Analysis

        17.12.2. Market Share Analysis, 2022

            17.12.2.1. By Form

            17.12.2.2. By Source

            17.12.2.3. By Type

            17.12.2.4. By Application

    17.13. Romania

        17.13.1. Pricing Analysis

        17.13.2. Market Share Analysis, 2022

            17.13.2.1. By Form

            17.13.2.2. By Source

            17.13.2.3. By Type

            17.13.2.4. By Application

    17.14. India

        17.14.1. Pricing Analysis

        17.14.2. Market Share Analysis, 2022

            17.14.2.1. By Form

            17.14.2.2. By Source

            17.14.2.3. By Type

            17.14.2.4. By Application

    17.15. Bangladesh

        17.15.1. Pricing Analysis

        17.15.2. Market Share Analysis, 2022

            17.15.2.1. By Form

            17.15.2.2. By Source

            17.15.2.3. By Type

            17.15.2.4. By Application

    17.16. Australia

        17.16.1. Pricing Analysis

        17.16.2. Market Share Analysis, 2022

            17.16.2.1. By Form

            17.16.2.2. By Source

            17.16.2.3. By Type

            17.16.2.4. By Application

    17.17. New Zealand

        17.17.1. Pricing Analysis

        17.17.2. Market Share Analysis, 2022

            17.17.2.1. By Form

            17.17.2.2. By Source

            17.17.2.3. By Type

            17.17.2.4. By Application

    17.18. China

        17.18.1. Pricing Analysis

        17.18.2. Market Share Analysis, 2022

            17.18.2.1. By Form

            17.18.2.2. By Source

            17.18.2.3. By Type

            17.18.2.4. By Application

    17.19. Japan

        17.19.1. Pricing Analysis

        17.19.2. Market Share Analysis, 2022

            17.19.2.1. By Form

            17.19.2.2. By Source

            17.19.2.3. By Type

            17.19.2.4. By Application

    17.20. South Korea

        17.20.1. Pricing Analysis

        17.20.2. Market Share Analysis, 2022

            17.20.2.1. By Form

            17.20.2.2. By Source

            17.20.2.3. By Type

            17.20.2.4. By Application

    17.21. GCC Countries

        17.21.1. Pricing Analysis

        17.21.2. Market Share Analysis, 2022

            17.21.2.1. By Form

            17.21.2.2. By Source

            17.21.2.3. By Type

            17.21.2.4. By Application

    17.22. South Africa

        17.22.1. Pricing Analysis

        17.22.2. Market Share Analysis, 2022

            17.22.2.1. By Form

            17.22.2.2. By Source

            17.22.2.3. By Type

            17.22.2.4. By Application

    17.23. Israel

        17.23.1. Pricing Analysis

        17.23.2. Market Share Analysis, 2022

            17.23.2.1. By Form

            17.23.2.2. By Source

            17.23.2.3. By Type

            17.23.2.4. By Application

18. Market Structure Analysis

    18.1. Competition Dashboard

    18.2. Competition Benchmarking

    18.3. Market Share Analysis of Top Players

        18.3.1. By Regional

        18.3.2. By Form

        18.3.3. By Source

        18.3.4. By Type

        18.3.5. By Application

19. Competition Analysis

    19.1. Competition Deep Dive

        19.1.1. Far East Microalgae Industries, Co., Ltd.

            19.1.1.1. Overview

            19.1.1.2. Product Portfolio

            19.1.1.3. Profitability by Market Segments

            19.1.1.4. Sales Footprint

            19.1.1.5. Strategy Overview

                19.1.1.5.1. Marketing Strategy

                19.1.1.5.2. Product Strategy

                19.1.1.5.3. Channel Strategy

        19.1.2. Bio-engineering Co., Ltd.

            19.1.2.1. Overview

            19.1.2.2. Product Portfolio

            19.1.2.3. Profitability by Market Segments

            19.1.2.4. Sales Footprint

            19.1.2.5. Strategy Overview

                19.1.2.5.1. Marketing Strategy

                19.1.2.5.2. Product Strategy

                19.1.2.5.3. Channel Strategy

        19.1.3. Tianjin Norland Biotech Co., Ltd.

            19.1.3.1. Overview

            19.1.3.2. Product Portfolio

            19.1.3.3. Profitability by Market Segments

            19.1.3.4. Sales Footprint

            19.1.3.5. Strategy Overview

                19.1.3.5.1. Marketing Strategy

                19.1.3.5.2. Product Strategy

                19.1.3.5.3. Channel Strategy

        19.1.4. NB Laboratories

            19.1.4.1. Overview

            19.1.4.2. Product Portfolio

            19.1.4.3. Profitability by Market Segments

            19.1.4.4. Sales Footprint

            19.1.4.5. Strategy Overview

                19.1.4.5.1. Marketing Strategy

                19.1.4.5.2. Product Strategy

                19.1.4.5.3. Channel Strategy

        19.1.5. Cyanotech Corporation, C.B.N.

            19.1.5.1. Overview

            19.1.5.2. Product Portfolio

            19.1.5.3. Profitability by Market Segments

            19.1.5.4. Sales Footprint

            19.1.5.5. Strategy Overview

                19.1.5.5.1. Marketing Strategy

                19.1.5.5.2. Product Strategy

                19.1.5.5.3. Channel Strategy

        19.1.6. Gong Bih Enterprise Co., Ltd.

            19.1.6.1. Overview

            19.1.6.2. Product Portfolio

            19.1.6.3. Profitability by Market Segments

            19.1.6.4. Sales Footprint

            19.1.6.5. Strategy Overview

                19.1.6.5.1. Marketing Strategy

                19.1.6.5.2. Product Strategy

                19.1.6.5.3. Channel Strategy

        19.1.7. Taiwan Chlorella Manufacturing Company Ltd

            19.1.7.1. Overview

            19.1.7.2. Product Portfolio

            19.1.7.3. Profitability by Market Segments

            19.1.7.4. Sales Footprint

            19.1.7.5. Strategy Overview

                19.1.7.5.1. Marketing Strategy

                19.1.7.5.2. Product Strategy

                19.1.7.5.3. Channel Strategy

        19.1.8. Algenol Biotech

            19.1.8.1. Overview

            19.1.8.2. Product Portfolio

            19.1.8.3. Profitability by Market Segments

            19.1.8.4. Sales Footprint

            19.1.8.5. Strategy Overview

                19.1.8.5.1. Marketing Strategy

                19.1.8.5.2. Product Strategy

                19.1.8.5.3. Channel Strategy

        19.1.9. Fuqing King Dnarmsa Spirulina Co., Ltd.

            19.1.9.1. Overview

            19.1.9.2. Product Portfolio

            19.1.9.3. Profitability by Market Segments

            19.1.9.4. Sales Footprint

            19.1.9.5. Strategy Overview

                19.1.9.5.1. Marketing Strategy

                19.1.9.5.2. Product Strategy

                19.1.9.5.3. Channel Strategy

        19.1.10. Sun Chlorella Corporation.

            19.1.10.1. Overview

            19.1.10.2. Product Portfolio

            19.1.10.3. Profitability by Market Segments

            19.1.10.4. Sales Footprint

            19.1.10.5. Strategy Overview

                19.1.10.5.1. Marketing Strategy

                19.1.10.5.2. Product Strategy

                19.1.10.5.3. Channel Strategy

20. Assumptions & Acronyms Used

21. Research Methodology

Don't pay for what you don't need

Customize your report by selecting specific countries or regions and save 30%!

List of Tables

Table 1: Global Market Value (US$ Million) Forecast by Region, 2018 to 2033

Table 2: Global Market Volume (Tons) Forecast by Region, 2018 to 2033

Table 3: Global Market Value (US$ Million) Forecast by Form, 2018 to 2033

Table 4: Global Market Volume (Tons) Forecast by Form, 2018 to 2033

Table 5: Global Market Value (US$ Million) Forecast by Source, 2018 to 2033

Table 6: Global Market Volume (Tons) Forecast by Source, 2018 to 2033

Table 7: Global Market Value (US$ Million) Forecast by Type, 2018 to 2033

Table 8: Global Market Volume (Tons) Forecast by Type, 2018 to 2033

Table 9: Global Market Value (US$ Million) Forecast by Application, 2018 to 2033

Table 10: Global Market Volume (Tons) Forecast by Application, 2018 to 2033

Table 11: North America Market Value (US$ Million) Forecast by Country, 2018 to 2033

Table 12: North America Market Volume (Tons) Forecast by Country, 2018 to 2033

Table 13: North America Market Value (US$ Million) Forecast by Form, 2018 to 2033

Table 14: North America Market Volume (Tons) Forecast by Form, 2018 to 2033

Table 15: North America Market Value (US$ Million) Forecast by Source, 2018 to 2033

Table 16: North America Market Volume (Tons) Forecast by Source, 2018 to 2033

Table 17: North America Market Value (US$ Million) Forecast by Type, 2018 to 2033

Table 18: North America Market Volume (Tons) Forecast by Type, 2018 to 2033

Table 19: North America Market Value (US$ Million) Forecast by Application, 2018 to 2033

Table 20: North America Market Volume (Tons) Forecast by Application, 2018 to 2033

Table 21: Latin America Market Value (US$ Million) Forecast by Country, 2018 to 2033

Table 22: Latin America Market Volume (Tons) Forecast by Country, 2018 to 2033

Table 23: Latin America Market Value (US$ Million) Forecast by Form, 2018 to 2033

Table 24: Latin America Market Volume (Tons) Forecast by Form, 2018 to 2033

Table 25: Latin America Market Value (US$ Million) Forecast by Source, 2018 to 2033

Table 26: Latin America Market Volume (Tons) Forecast by Source, 2018 to 2033

Table 27: Latin America Market Value (US$ Million) Forecast by Type, 2018 to 2033

Table 28: Latin America Market Volume (Tons) Forecast by Type, 2018 to 2033

Table 29: Latin America Market Value (US$ Million) Forecast by Application, 2018 to 2033

Table 30: Latin America Market Volume (Tons) Forecast by Application, 2018 to 2033

Table 31: Western Europe Market Value (US$ Million) Forecast by Country, 2018 to 2033

Table 32: Western Europe Market Volume (Tons) Forecast by Country, 2018 to 2033

Table 33: Western Europe Market Value (US$ Million) Forecast by Form, 2018 to 2033

Table 34: Western Europe Market Volume (Tons) Forecast by Form, 2018 to 2033

Table 35: Western Europe Market Value (US$ Million) Forecast by Source, 2018 to 2033

Table 36: Western Europe Market Volume (Tons) Forecast by Source, 2018 to 2033

Table 37: Western Europe Market Value (US$ Million) Forecast by Type, 2018 to 2033

Table 38: Western Europe Market Volume (Tons) Forecast by Type, 2018 to 2033

Table 39: Western Europe Market Value (US$ Million) Forecast by Application, 2018 to 2033

Table 40: Western Europe Market Volume (Tons) Forecast by Application, 2018 to 2033

Table 41: Eastern Europe Market Value (US$ Million) Forecast by Country, 2018 to 2033

Table 42: Eastern Europe Market Volume (Tons) Forecast by Country, 2018 to 2033

Table 43: Eastern Europe Market Value (US$ Million) Forecast by Form, 2018 to 2033

Table 44: Eastern Europe Market Volume (Tons) Forecast by Form, 2018 to 2033

Table 45: Eastern Europe Market Value (US$ Million) Forecast by Source, 2018 to 2033

Table 46: Eastern Europe Market Volume (Tons) Forecast by Source, 2018 to 2033

Table 47: Eastern Europe Market Value (US$ Million) Forecast by Type, 2018 to 2033

Table 48: Eastern Europe Market Volume (Tons) Forecast by Type, 2018 to 2033

Table 49: Eastern Europe Market Value (US$ Million) Forecast by Application, 2018 to 2033

Table 50: Eastern Europe Market Volume (Tons) Forecast by Application, 2018 to 2033

Table 51: South Asia and Pacific Market Value (US$ Million) Forecast by Country, 2018 to 2033

Table 52: South Asia and Pacific Market Volume (Tons) Forecast by Country, 2018 to 2033

Table 53: South Asia and Pacific Market Value (US$ Million) Forecast by Form, 2018 to 2033

Table 54: South Asia and Pacific Market Volume (Tons) Forecast by Form, 2018 to 2033

Table 55: South Asia and Pacific Market Value (US$ Million) Forecast by Source, 2018 to 2033

Table 56: South Asia and Pacific Market Volume (Tons) Forecast by Source, 2018 to 2033

Table 57: South Asia and Pacific Market Value (US$ Million) Forecast by Type, 2018 to 2033

Table 58: South Asia and Pacific Market Volume (Tons) Forecast by Type, 2018 to 2033

Table 59: South Asia and Pacific Market Value (US$ Million) Forecast by Application, 2018 to 2033

Table 60: South Asia and Pacific Market Volume (Tons) Forecast by Application, 2018 to 2033

Table 61: East Asia Market Value (US$ Million) Forecast by Country, 2018 to 2033

Table 62: East Asia Market Volume (Tons) Forecast by Country, 2018 to 2033

Table 63: East Asia Market Value (US$ Million) Forecast by Form, 2018 to 2033

Table 64: East Asia Market Volume (Tons) Forecast by Form, 2018 to 2033

Table 65: East Asia Market Value (US$ Million) Forecast by Source, 2018 to 2033

Table 66: East Asia Market Volume (Tons) Forecast by Source, 2018 to 2033

Table 67: East Asia Market Value (US$ Million) Forecast by Type, 2018 to 2033

Table 68: East Asia Market Volume (Tons) Forecast by Type, 2018 to 2033

Table 69: East Asia Market Value (US$ Million) Forecast by Application, 2018 to 2033

Table 70: East Asia Market Volume (Tons) Forecast by Application, 2018 to 2033

Table 71: Middle East and Africa Market Value (US$ Million) Forecast by Country, 2018 to 2033

Table 72: Middle East and Africa Market Volume (Tons) Forecast by Country, 2018 to 2033

Table 73: Middle East and Africa Market Value (US$ Million) Forecast by Form, 2018 to 2033

Table 74: Middle East and Africa Market Volume (Tons) Forecast by Form, 2018 to 2033

Table 75: Middle East and Africa Market Value (US$ Million) Forecast by Source, 2018 to 2033

Table 76: Middle East and Africa Market Volume (Tons) Forecast by Source, 2018 to 2033

Table 77: Middle East and Africa Market Value (US$ Million) Forecast by Type, 2018 to 2033

Table 78: Middle East and Africa Market Volume (Tons) Forecast by Type, 2018 to 2033

Table 79: Middle East and Africa Market Value (US$ Million) Forecast by Application, 2018 to 2033

Table 80: Middle East and Africa Market Volume (Tons) Forecast by Application, 2018 to 2033
Nandini Roy Choudhury

Principal Consultant

Talk to Analyst

Find your sweet spots for generating winning opportunities in this market.

List of Charts

Figure 1: Global Market Value (US$ Million) by Form, 2023 to 2033

Figure 2: Global Market Value (US$ Million) by Source, 2023 to 2033

Figure 3: Global Market Value (US$ Million) by Type, 2023 to 2033

Figure 4: Global Market Value (US$ Million) by Application, 2023 to 2033

Figure 5: Global Market Value (US$ Million) by Region, 2023 to 2033

Figure 6: Global Market Value (US$ Million) Analysis by Region, 2018 to 2033

Figure 7: Global Market Volume (Tons) Analysis by Region, 2018 to 2033

Figure 8: Global Market Value Share (%) and BPS Analysis by Region, 2023 to 2033

Figure 9: Global Market Y-o-Y Growth (%) Projections by Region, 2023 to 2033

Figure 10: Global Market Value (US$ Million) Analysis by Form, 2018 to 2033

Figure 11: Global Market Volume (Tons) Analysis by Form, 2018 to 2033

Figure 12: Global Market Value Share (%) and BPS Analysis by Form, 2023 to 2033

Figure 13: Global Market Y-o-Y Growth (%) Projections by Form, 2023 to 2033

Figure 14: Global Market Value (US$ Million) Analysis by Source, 2018 to 2033

Figure 15: Global Market Volume (Tons) Analysis by Source, 2018 to 2033

Figure 16: Global Market Value Share (%) and BPS Analysis by Source, 2023 to 2033

Figure 17: Global Market Y-o-Y Growth (%) Projections by Source, 2023 to 2033

Figure 18: Global Market Value (US$ Million) Analysis by Type, 2018 to 2033

Figure 19: Global Market Volume (Tons) Analysis by Type, 2018 to 2033

Figure 20: Global Market Value Share (%) and BPS Analysis by Type, 2023 to 2033

Figure 21: Global Market Y-o-Y Growth (%) Projections by Type, 2023 to 2033

Figure 22: Global Market Value (US$ Million) Analysis by Application, 2018 to 2033

Figure 23: Global Market Volume (Tons) Analysis by Application, 2018 to 2033

Figure 24: Global Market Value Share (%) and BPS Analysis by Application, 2023 to 2033

Figure 25: Global Market Y-o-Y Growth (%) Projections by Application, 2023 to 2033

Figure 26: Global Market Attractiveness by Form, 2023 to 2033

Figure 27: Global Market Attractiveness by Source, 2023 to 2033

Figure 28: Global Market Attractiveness by Type, 2023 to 2033

Figure 29: Global Market Attractiveness by Application, 2023 to 2033

Figure 30: Global Market Attractiveness by Region, 2023 to 2033

Figure 31: North America Market Value (US$ Million) by Form, 2023 to 2033

Figure 32: North America Market Value (US$ Million) by Source, 2023 to 2033

Figure 33: North America Market Value (US$ Million) by Type, 2023 to 2033

Figure 34: North America Market Value (US$ Million) by Application, 2023 to 2033

Figure 35: North America Market Value (US$ Million) by Country, 2023 to 2033

Figure 36: North America Market Value (US$ Million) Analysis by Country, 2018 to 2033

Figure 37: North America Market Volume (Tons) Analysis by Country, 2018 to 2033

Figure 38: North America Market Value Share (%) and BPS Analysis by Country, 2023 to 2033

Figure 39: North America Market Y-o-Y Growth (%) Projections by Country, 2023 to 2033

Figure 40: North America Market Value (US$ Million) Analysis by Form, 2018 to 2033

Figure 41: North America Market Volume (Tons) Analysis by Form, 2018 to 2033

Figure 42: North America Market Value Share (%) and BPS Analysis by Form, 2023 to 2033

Figure 43: North America Market Y-o-Y Growth (%) Projections by Form, 2023 to 2033

Figure 44: North America Market Value (US$ Million) Analysis by Source, 2018 to 2033

Figure 45: North America Market Volume (Tons) Analysis by Source, 2018 to 2033

Figure 46: North America Market Value Share (%) and BPS Analysis by Source, 2023 to 2033

Figure 47: North America Market Y-o-Y Growth (%) Projections by Source, 2023 to 2033

Figure 48: North America Market Value (US$ Million) Analysis by Type, 2018 to 2033

Figure 49: North America Market Volume (Tons) Analysis by Type, 2018 to 2033

Figure 50: North America Market Value Share (%) and BPS Analysis by Type, 2023 to 2033

Figure 51: North America Market Y-o-Y Growth (%) Projections by Type, 2023 to 2033

Figure 52: North America Market Value (US$ Million) Analysis by Application, 2018 to 2033

Figure 53: North America Market Volume (Tons) Analysis by Application, 2018 to 2033

Figure 54: North America Market Value Share (%) and BPS Analysis by Application, 2023 to 2033

Figure 55: North America Market Y-o-Y Growth (%) Projections by Application, 2023 to 2033

Figure 56: North America Market Attractiveness by Form, 2023 to 2033

Figure 57: North America Market Attractiveness by Source, 2023 to 2033

Figure 58: North America Market Attractiveness by Type, 2023 to 2033

Figure 59: North America Market Attractiveness by Application, 2023 to 2033

Figure 60: North America Market Attractiveness by Country, 2023 to 2033

Figure 61: Latin America Market Value (US$ Million) by Form, 2023 to 2033

Figure 62: Latin America Market Value (US$ Million) by Source, 2023 to 2033

Figure 63: Latin America Market Value (US$ Million) by Type, 2023 to 2033

Figure 64: Latin America Market Value (US$ Million) by Application, 2023 to 2033

Figure 65: Latin America Market Value (US$ Million) by Country, 2023 to 2033

Figure 66: Latin America Market Value (US$ Million) Analysis by Country, 2018 to 2033

Figure 67: Latin America Market Volume (Tons) Analysis by Country, 2018 to 2033

Figure 68: Latin America Market Value Share (%) and BPS Analysis by Country, 2023 to 2033

Figure 69: Latin America Market Y-o-Y Growth (%) Projections by Country, 2023 to 2033

Figure 70: Latin America Market Value (US$ Million) Analysis by Form, 2018 to 2033

Figure 71: Latin America Market Volume (Tons) Analysis by Form, 2018 to 2033

Figure 72: Latin America Market Value Share (%) and BPS Analysis by Form, 2023 to 2033

Figure 73: Latin America Market Y-o-Y Growth (%) Projections by Form, 2023 to 2033

Figure 74: Latin America Market Value (US$ Million) Analysis by Source, 2018 to 2033

Figure 75: Latin America Market Volume (Tons) Analysis by Source, 2018 to 2033

Figure 76: Latin America Market Value Share (%) and BPS Analysis by Source, 2023 to 2033

Figure 77: Latin America Market Y-o-Y Growth (%) Projections by Source, 2023 to 2033

Figure 78: Latin America Market Value (US$ Million) Analysis by Type, 2018 to 2033

Figure 79: Latin America Market Volume (Tons) Analysis by Type, 2018 to 2033

Figure 80: Latin America Market Value Share (%) and BPS Analysis by Type, 2023 to 2033

Figure 81: Latin America Market Y-o-Y Growth (%) Projections by Type, 2023 to 2033

Figure 82: Latin America Market Value (US$ Million) Analysis by Application, 2018 to 2033

Figure 83: Latin America Market Volume (Tons) Analysis by Application, 2018 to 2033

Figure 84: Latin America Market Value Share (%) and BPS Analysis by Application, 2023 to 2033

Figure 85: Latin America Market Y-o-Y Growth (%) Projections by Application, 2023 to 2033

Figure 86: Latin America Market Attractiveness by Form, 2023 to 2033

Figure 87: Latin America Market Attractiveness by Source, 2023 to 2033

Figure 88: Latin America Market Attractiveness by Type, 2023 to 2033

Figure 89: Latin America Market Attractiveness by Application, 2023 to 2033

Figure 90: Latin America Market Attractiveness by Country, 2023 to 2033

Figure 91: Western Europe Market Value (US$ Million) by Form, 2023 to 2033

Figure 92: Western Europe Market Value (US$ Million) by Source, 2023 to 2033

Figure 93: Western Europe Market Value (US$ Million) by Type, 2023 to 2033

Figure 94: Western Europe Market Value (US$ Million) by Application, 2023 to 2033

Figure 95: Western Europe Market Value (US$ Million) by Country, 2023 to 2033

Figure 96: Western Europe Market Value (US$ Million) Analysis by Country, 2018 to 2033

Figure 97: Western Europe Market Volume (Tons) Analysis by Country, 2018 to 2033

Figure 98: Western Europe Market Value Share (%) and BPS Analysis by Country, 2023 to 2033

Figure 99: Western Europe Market Y-o-Y Growth (%) Projections by Country, 2023 to 2033

Figure 100: Western Europe Market Value (US$ Million) Analysis by Form, 2018 to 2033

Figure 101: Western Europe Market Volume (Tons) Analysis by Form, 2018 to 2033

Figure 102: Western Europe Market Value Share (%) and BPS Analysis by Form, 2023 to 2033

Figure 103: Western Europe Market Y-o-Y Growth (%) Projections by Form, 2023 to 2033

Figure 104: Western Europe Market Value (US$ Million) Analysis by Source, 2018 to 2033

Figure 105: Western Europe Market Volume (Tons) Analysis by Source, 2018 to 2033

Figure 106: Western Europe Market Value Share (%) and BPS Analysis by Source, 2023 to 2033

Figure 107: Western Europe Market Y-o-Y Growth (%) Projections by Source, 2023 to 2033

Figure 108: Western Europe Market Value (US$ Million) Analysis by Type, 2018 to 2033

Figure 109: Western Europe Market Volume (Tons) Analysis by Type, 2018 to 2033

Figure 110: Western Europe Market Value Share (%) and BPS Analysis by Type, 2023 to 2033

Figure 111: Western Europe Market Y-o-Y Growth (%) Projections by Type, 2023 to 2033

Figure 112: Western Europe Market Value (US$ Million) Analysis by Application, 2018 to 2033

Figure 113: Western Europe Market Volume (Tons) Analysis by Application, 2018 to 2033

Figure 114: Western Europe Market Value Share (%) and BPS Analysis by Application, 2023 to 2033

Figure 115: Western Europe Market Y-o-Y Growth (%) Projections by Application, 2023 to 2033

Figure 116: Western Europe Market Attractiveness by Form, 2023 to 2033

Figure 117: Western Europe Market Attractiveness by Source, 2023 to 2033

Figure 118: Western Europe Market Attractiveness by Type, 2023 to 2033

Figure 119: Western Europe Market Attractiveness by Application, 2023 to 2033

Figure 120: Western Europe Market Attractiveness by Country, 2023 to 2033

Figure 121: Eastern Europe Market Value (US$ Million) by Form, 2023 to 2033

Figure 122: Eastern Europe Market Value (US$ Million) by Source, 2023 to 2033

Figure 123: Eastern Europe Market Value (US$ Million) by Type, 2023 to 2033

Figure 124: Eastern Europe Market Value (US$ Million) by Application, 2023 to 2033

Figure 125: Eastern Europe Market Value (US$ Million) by Country, 2023 to 2033

Figure 126: Eastern Europe Market Value (US$ Million) Analysis by Country, 2018 to 2033

Figure 127: Eastern Europe Market Volume (Tons) Analysis by Country, 2018 to 2033

Figure 128: Eastern Europe Market Value Share (%) and BPS Analysis by Country, 2023 to 2033

Figure 129: Eastern Europe Market Y-o-Y Growth (%) Projections by Country, 2023 to 2033

Figure 130: Eastern Europe Market Value (US$ Million) Analysis by Form, 2018 to 2033

Figure 131: Eastern Europe Market Volume (Tons) Analysis by Form, 2018 to 2033

Figure 132: Eastern Europe Market Value Share (%) and BPS Analysis by Form, 2023 to 2033

Figure 133: Eastern Europe Market Y-o-Y Growth (%) Projections by Form, 2023 to 2033

Figure 134: Eastern Europe Market Value (US$ Million) Analysis by Source, 2018 to 2033

Figure 135: Eastern Europe Market Volume (Tons) Analysis by Source, 2018 to 2033

Figure 136: Eastern Europe Market Value Share (%) and BPS Analysis by Source, 2023 to 2033

Figure 137: Eastern Europe Market Y-o-Y Growth (%) Projections by Source, 2023 to 2033

Figure 138: Eastern Europe Market Value (US$ Million) Analysis by Type, 2018 to 2033

Figure 139: Eastern Europe Market Volume (Tons) Analysis by Type, 2018 to 2033

Figure 140: Eastern Europe Market Value Share (%) and BPS Analysis by Type, 2023 to 2033

Figure 141: Eastern Europe Market Y-o-Y Growth (%) Projections by Type, 2023 to 2033

Figure 142: Eastern Europe Market Value (US$ Million) Analysis by Application, 2018 to 2033

Figure 143: Eastern Europe Market Volume (Tons) Analysis by Application, 2018 to 2033

Figure 144: Eastern Europe Market Value Share (%) and BPS Analysis by Application, 2023 to 2033

Figure 145: Eastern Europe Market Y-o-Y Growth (%) Projections by Application, 2023 to 2033

Figure 146: Eastern Europe Market Attractiveness by Form, 2023 to 2033

Figure 147: Eastern Europe Market Attractiveness by Source, 2023 to 2033

Figure 148: Eastern Europe Market Attractiveness by Type, 2023 to 2033

Figure 149: Eastern Europe Market Attractiveness by Application, 2023 to 2033

Figure 150: Eastern Europe Market Attractiveness by Country, 2023 to 2033

Figure 151: South Asia and Pacific Market Value (US$ Million) by Form, 2023 to 2033

Figure 152: South Asia and Pacific Market Value (US$ Million) by Source, 2023 to 2033

Figure 153: South Asia and Pacific Market Value (US$ Million) by Type, 2023 to 2033

Figure 154: South Asia and Pacific Market Value (US$ Million) by Application, 2023 to 2033

Figure 155: South Asia and Pacific Market Value (US$ Million) by Country, 2023 to 2033

Figure 156: South Asia and Pacific Market Value (US$ Million) Analysis by Country, 2018 to 2033

Figure 157: South Asia and Pacific Market Volume (Tons) Analysis by Country, 2018 to 2033

Figure 158: South Asia and Pacific Market Value Share (%) and BPS Analysis by Country, 2023 to 2033

Figure 159: South Asia and Pacific Market Y-o-Y Growth (%) Projections by Country, 2023 to 2033

Figure 160: South Asia and Pacific Market Value (US$ Million) Analysis by Form, 2018 to 2033

Figure 161: South Asia and Pacific Market Volume (Tons) Analysis by Form, 2018 to 2033

Figure 162: South Asia and Pacific Market Value Share (%) and BPS Analysis by Form, 2023 to 2033

Figure 163: South Asia and Pacific Market Y-o-Y Growth (%) Projections by Form, 2023 to 2033

Figure 164: South Asia and Pacific Market Value (US$ Million) Analysis by Source, 2018 to 2033

Figure 165: South Asia and Pacific Market Volume (Tons) Analysis by Source, 2018 to 2033

Figure 166: South Asia and Pacific Market Value Share (%) and BPS Analysis by Source, 2023 to 2033

Figure 167: South Asia and Pacific Market Y-o-Y Growth (%) Projections by Source, 2023 to 2033

Figure 168: South Asia and Pacific Market Value (US$ Million) Analysis by Type, 2018 to 2033

Figure 169: South Asia and Pacific Market Volume (Tons) Analysis by Type, 2018 to 2033

Figure 170: South Asia and Pacific Market Value Share (%) and BPS Analysis by Type, 2023 to 2033

Figure 171: South Asia and Pacific Market Y-o-Y Growth (%) Projections by Type, 2023 to 2033

Figure 172: South Asia and Pacific Market Value (US$ Million) Analysis by Application, 2018 to 2033

Figure 173: South Asia and Pacific Market Volume (Tons) Analysis by Application, 2018 to 2033

Figure 174: South Asia and Pacific Market Value Share (%) and BPS Analysis by Application, 2023 to 2033

Figure 175: South Asia and Pacific Market Y-o-Y Growth (%) Projections by Application, 2023 to 2033

Figure 176: South Asia and Pacific Market Attractiveness by Form, 2023 to 2033

Figure 177: South Asia and Pacific Market Attractiveness by Source, 2023 to 2033

Figure 178: South Asia and Pacific Market Attractiveness by Type, 2023 to 2033

Figure 179: South Asia and Pacific Market Attractiveness by Application, 2023 to 2033

Figure 180: South Asia and Pacific Market Attractiveness by Country, 2023 to 2033

Figure 181: East Asia Market Value (US$ Million) by Form, 2023 to 2033

Figure 182: East Asia Market Value (US$ Million) by Source, 2023 to 2033

Figure 183: East Asia Market Value (US$ Million) by Type, 2023 to 2033

Figure 184: East Asia Market Value (US$ Million) by Application, 2023 to 2033

Figure 185: East Asia Market Value (US$ Million) by Country, 2023 to 2033

Figure 186: East Asia Market Value (US$ Million) Analysis by Country, 2018 to 2033

Figure 187: East Asia Market Volume (Tons) Analysis by Country, 2018 to 2033

Figure 188: East Asia Market Value Share (%) and BPS Analysis by Country, 2023 to 2033

Figure 189: East Asia Market Y-o-Y Growth (%) Projections by Country, 2023 to 2033

Figure 190: East Asia Market Value (US$ Million) Analysis by Form, 2018 to 2033

Figure 191: East Asia Market Volume (Tons) Analysis by Form, 2018 to 2033

Figure 192: East Asia Market Value Share (%) and BPS Analysis by Form, 2023 to 2033

Figure 193: East Asia Market Y-o-Y Growth (%) Projections by Form, 2023 to 2033

Figure 194: East Asia Market Value (US$ Million) Analysis by Source, 2018 to 2033

Figure 195: East Asia Market Volume (Tons) Analysis by Source, 2018 to 2033

Figure 196: East Asia Market Value Share (%) and BPS Analysis by Source, 2023 to 2033

Figure 197: East Asia Market Y-o-Y Growth (%) Projections by Source, 2023 to 2033

Figure 198: East Asia Market Value (US$ Million) Analysis by Type, 2018 to 2033

Figure 199: East Asia Market Volume (Tons) Analysis by Type, 2018 to 2033

Figure 200: East Asia Market Value Share (%) and BPS Analysis by Type, 2023 to 2033

Figure 201: East Asia Market Y-o-Y Growth (%) Projections by Type, 2023 to 2033

Figure 202: East Asia Market Value (US$ Million) Analysis by Application, 2018 to 2033

Figure 203: East Asia Market Volume (Tons) Analysis by Application, 2018 to 2033

Figure 204: East Asia Market Value Share (%) and BPS Analysis by Application, 2023 to 2033

Figure 205: East Asia Market Y-o-Y Growth (%) Projections by Application, 2023 to 2033

Figure 206: East Asia Market Attractiveness by Form, 2023 to 2033

Figure 207: East Asia Market Attractiveness by Source, 2023 to 2033

Figure 208: East Asia Market Attractiveness by Type, 2023 to 2033

Figure 209: East Asia Market Attractiveness by Application, 2023 to 2033

Figure 210: East Asia Market Attractiveness by Country, 2023 to 2033

Figure 211: Middle East and Africa Market Value (US$ Million) by Form, 2023 to 2033

Figure 212: Middle East and Africa Market Value (US$ Million) by Source, 2023 to 2033

Figure 213: Middle East and Africa Market Value (US$ Million) by Type, 2023 to 2033

Figure 214: Middle East and Africa Market Value (US$ Million) by Application, 2023 to 2033

Figure 215: Middle East and Africa Market Value (US$ Million) by Country, 2023 to 2033

Figure 216: Middle East and Africa Market Value (US$ Million) Analysis by Country, 2018 to 2033

Figure 217: Middle East and Africa Market Volume (Tons) Analysis by Country, 2018 to 2033

Figure 218: Middle East and Africa Market Value Share (%) and BPS Analysis by Country, 2023 to 2033

Figure 219: Middle East and Africa Market Y-o-Y Growth (%) Projections by Country, 2023 to 2033

Figure 220: Middle East and Africa Market Value (US$ Million) Analysis by Form, 2018 to 2033

Figure 221: Middle East and Africa Market Volume (Tons) Analysis by Form, 2018 to 2033

Figure 222: Middle East and Africa Market Value Share (%) and BPS Analysis by Form, 2023 to 2033

Figure 223: Middle East and Africa Market Y-o-Y Growth (%) Projections by Form, 2023 to 2033

Figure 224: Middle East and Africa Market Value (US$ Million) Analysis by Source, 2018 to 2033

Figure 225: Middle East and Africa Market Volume (Tons) Analysis by Source, 2018 to 2033

Figure 226: Middle East and Africa Market Value Share (%) and BPS Analysis by Source, 2023 to 2033

Figure 227: Middle East and Africa Market Y-o-Y Growth (%) Projections by Source, 2023 to 2033

Figure 228: Middle East and Africa Market Value (US$ Million) Analysis by Type, 2018 to 2033

Figure 229: Middle East and Africa Market Volume (Tons) Analysis by Type, 2018 to 2033

Figure 230: Middle East and Africa Market Value Share (%) and BPS Analysis by Type, 2023 to 2033

Figure 231: Middle East and Africa Market Y-o-Y Growth (%) Projections by Type, 2023 to 2033

Figure 232: Middle East and Africa Market Value (US$ Million) Analysis by Application, 2018 to 2033

Figure 233: Middle East and Africa Market Volume (Tons) Analysis by Application, 2018 to 2033

Figure 234: Middle East and Africa Market Value Share (%) and BPS Analysis by Application, 2023 to 2033

Figure 235: Middle East and Africa Market Y-o-Y Growth (%) Projections by Application, 2023 to 2033

Figure 236: Middle East and Africa Market Attractiveness by Form, 2023 to 2033

Figure 237: Middle East and Africa Market Attractiveness by Source, 2023 to 2033

Figure 238: Middle East and Africa Market Attractiveness by Type, 2023 to 2033

Figure 239: Middle East and Africa Market Attractiveness by Application, 2023 to 2033

Figure 240: Middle East and Africa Market Attractiveness by Country, 2023 to 2033

Recommendations

Food and Beverage

Algae Fats Market

Published : March 2023

Food and Beverage

Algae Proteins Market

Published : February 2023

Food and Beverage

Algae Omega Market

Published : October 2022

Food and Beverage

Algae Oil Market

Published : June 2022

Explore Food and Beverage Insights

View Reports