The Policy Orchestration Market is estimated to be valued at USD 678.9 million in 2025 and is projected to reach USD 1116.4 million by 2035, registering a compound annual growth rate (CAGR) of 5.1% over the forecast period.
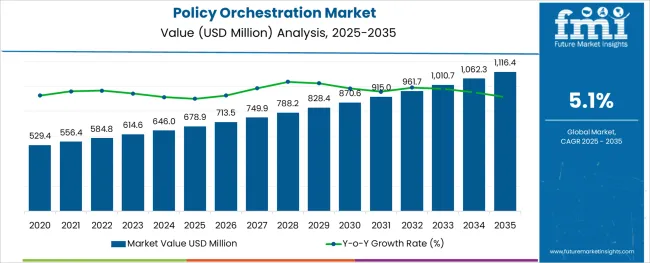
The policy orchestration market is evolving rapidly in response to increasing network complexity, growing cybersecurity threats, and the rising need for unified policy governance across hybrid IT environments. Organizations are focusing on automating security policy management to reduce manual errors, accelerate compliance processes, and respond to dynamic threat landscapes.
Policy orchestration solutions enable seamless coordination across firewalls, cloud platforms, and endpoint protection tools by aligning security policies with business objectives. The shift toward zero trust architectures and multi cloud deployments has further intensified the demand for centralized orchestration systems that ensure policy consistency and operational agility.
With continued enterprise digital transformation and expanding regulatory requirements, the market is poised for robust growth as businesses seek scalable and intelligent orchestration frameworks.
The market is segmented by Solution, Enterprise Size, and Industry and region. By Solution, the market is divided into Policy Orchestration Platform and Services. In terms of Enterprise Size, the market is classified into Small Offices (1-9 employees), Small Enterprises (10-99 employees), Medium-sized Enterprise (100-499 employees), Large Enterprises (500-999 employees), and Very Large Enterprises (1,000+ employees).
Based on Industry, the market is segmented into Finance, Manufacturing & Resources, Distribution Services, Services, Public Sector, and Infrastructure. Regionally, the market is classified into North America, Latin America, Western Europe, Eastern Europe, Balkan & Baltic Countries, Russia & Belarus, Central Asia, East Asia, South Asia & Pacific, and the Middle East & Africa.
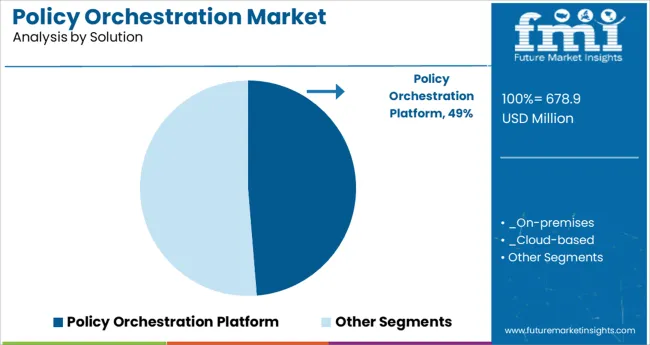
The policy orchestration platform segment is expected to account for 48.70% of total market revenue by 2025 within the solution category, establishing it as the leading segment. This dominance is driven by its ability to centralize and automate policy management across diverse network architectures, improving visibility, consistency, and compliance.
The platform facilitates rapid policy updates, minimizes configuration drift, and enhances incident response efficiency. Organizations adopting complex cloud and hybrid infrastructures prefer platform based orchestration due to its scalable architecture and integration flexibility.
Additionally, advancements in AI driven policy modeling and adaptive workflows have further reinforced the platform’s position as the preferred solution for enterprises looking to streamline governance and reduce risk exposure.
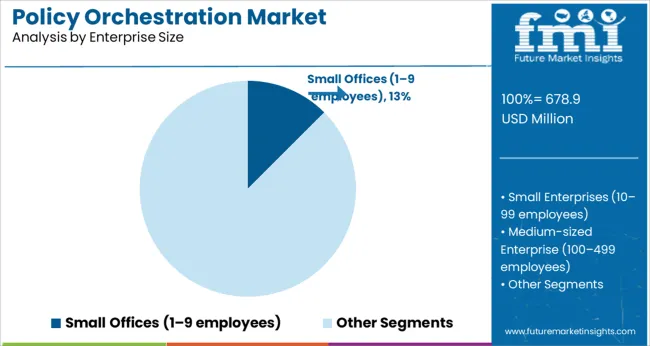
The small offices segment, representing 12.50% of total market revenue by 2025, holds a notable position within the enterprise size category. This share is supported by the growing accessibility of cloud based orchestration tools and the increasing cybersecurity awareness among smaller businesses.
With limited IT personnel and budgets, small offices are increasingly adopting automated policy orchestration to simplify security management and ensure baseline protection across devices and users. The affordability and ease of deployment of modular orchestration platforms have made them viable even for micro enterprises.
As remote work, endpoint proliferation, and digital payment adoption continue to rise, small offices are recognizing the importance of maintaining consistent policy enforcement, driving adoption within this segment.
The policy orchestration is expected to grow at 3.1% CAGR between 2025 to 2035 and the market grew by 5.1% between 2020 to 2024.
The reasons attributing for the growth in the policy orchestration market over the forecast period are digitization in enterprises occurring across regions and enterprises, the emergence of large enterprises, and the improving the economy across the South Asia and Pacific region over the forecast period.
Companies often implement various security policies and measures that were disparate in nature implementing policies and controls by using Linux, Mac controls, and group policy objects, this leads to greater use of security resources that a company has and could create the potential risk of breaches and regulatory issues due to manual errors and miscommunication.
Having a central solution that manages all the technologies in the organization despite their different technical configurations, for imposing the organization policies assists in the reduction of various manual processes and improves the security of the organization, policy orchestration allows the aforementioned things and that is the primary driver for the policy orchestration market.
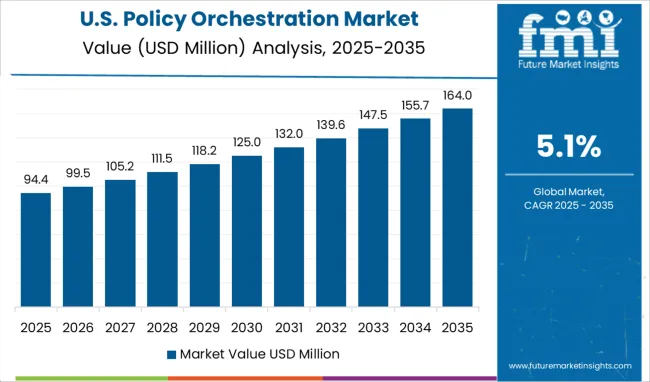
North America held the largest market share for the policy orchestration market in 2024, with a market share of 21.2%. While South Asia and the Pacific are estimated to be the fastest-growing regions with a CAGR of 6.4%,
North America has several large enterprises across various industries. This region is also one of the most targeted regions, creating the necessity for cyber security solutions and regulations. South Asia and the Pacific is a rapidly growing regions with several large and small enterprises, the number of large enterprises is increasing in this region, a growing market for policy orchestration.
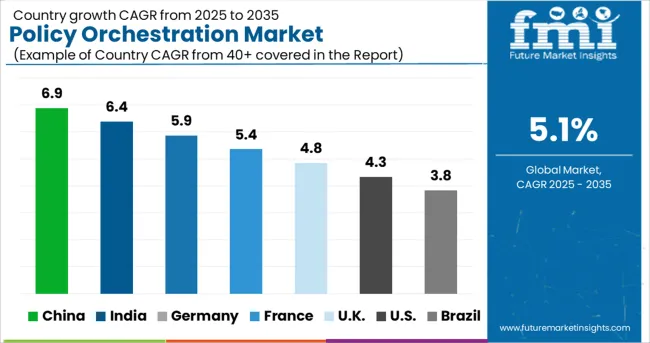
The presence of large enterprises in this country makes it a target of several cyber-attacks and data breaches. The country is also home to several social media companies with users that span across the globe, increasing the importance of security policies orchestration across these enterprises, and being one of the most targeted countries, small and medium-sized enterprises are highly prone to security attacks as well. Having a proper policy orchestration solution could assist companies
India has a fast-growing IT and telecom industry, and a unique feature of this country is that the technology industry here is massive. Due to technology development in this region, the IT services industry was one of the most targeted industries in India by cyber criminals. Because of the high population in this country, the workforce is also quite large, raising concerns about the policies to be implemented because of work-from-home practices.
The UK has a large BFSI industry, and this industry is under constant threat from cyber attackers because of the financial aspects it deals with. Since policy orchestration can assist in protecting software products and applications from cyber threats, policy orchestration solutions and services could find a strong marketplace.
Due to the presence of two countries in similar economic conditions and high cyber-security threats, the demand for policy orchestration is high in this region. The industries in this region are established. The government has various regulations for e-discovery compliance and security.
Latin America has high revenue volatility because of the presence of several countries with varying economic conditions. The industries that use policy orchestration are not highly developed in this region, with the maximum economic growth being driven by Brazil and Mexico, causing a higher barrier to entry.
Europe is often a target for cyber attackers and has various regulations in place for business activities. Industries that use policy orchestration are well established, reducing barriers to entry. The countries that fall within Europe have wide economic conditions, raising revenue volatility.
Cyber-attacks are increasing in South Asia and the Pacific because of the developing economy. The region has high revenue volatility. The competition in this region can be high because of the presence of numerous vendors providing solutions in the same domain.
East Asia has less revenue volatility because the countries that fall into this region have similar economic conditions. The enterprises in this region need to implement security policies in a stringent manner because of government regulations and the cyber-attacks that are faced in this region.
The Middle East and Africa have high revenue volatility due to the vast differences in economic conditions. The cyber-attacks this region faces are low; however, the necessary security measures are not in place, causing the damage of cyber-attacks to be high and creating a potential opportunity for policy orchestration.
Policy orchestration is a solution that allows a common solution for the implementation of policies across all devices and organizations. The demand for this solution is driven by factors such as growing cyber security concerns and the need for a common interface for managing policies across the enterprise, which becomes a necessity, allowing the market for policy orchestration solutions to have a higher market share of 56.3% by Solution.
Large enterprises have the ability to make large-scale investments in their infrastructure and have several hardware and software, that require policy orchestration. These companies are often multinational and have to consider the policies, rules, and regulations that exist in different countries. For this reason, large enterprises had the largest market share of 55.6% by enterprise size in 2024.
The healthcare sector had witnessed a boom during the pandemic and needed the deployment of various hardware and software solutions; however, at the same time, there were numerous malware and cyber-attacks designed particularly for targeting the healthcare sector; during the pandemic, this sector was one of the most targeted sectors.
If a certain similar event that could increase the pressure on the healthcare sector were to occur again, so would the cyberattacks. To improve the security of the equipment both internally and externally, policy orchestration solutions could be deployed.
For these reasons, the healthcare sector is the fastest-growing segment by industry, with a CAGR of 6.9% over the forecast period.
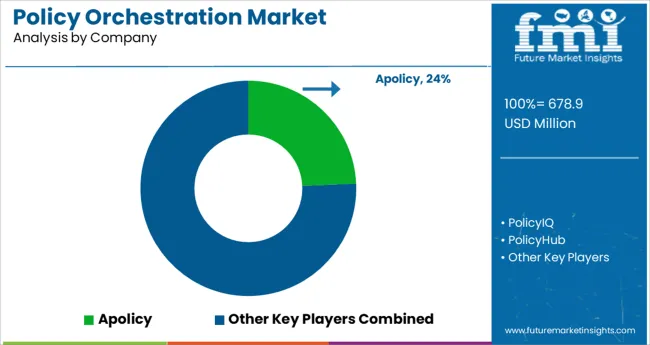
Policy orchestration vendors are providing solutions and services based on the cloud and provide cloud security policy orchestration (CSPO) solutions. Most of the companies operating in this domain are in the IT and telecom sectors and also offer solutions like identity orchestration.
| Attribute | Details |
|---|---|
| Market value in 2024 | USD 537.6 Million |
| Market CAGR 2025 to 2035 | 5.1% |
| Share of top 5 players | Around 45% |
| Forecast Period | 2025 to 2035 |
| Historical Data Available for | 2020 to 2024 |
| Market Analysis | million for Value |
| Key Regions Covered | North America; Latin America; Europe; South Asia & Pacific; East Asia; and the Middle East & Africa |
| Key Countries Covered | USA, Canada, Germany, UK, France, Italy, Spain, Russia, China, Japan, South Korea, India, Australia & New Zealand, GCC Countries, Turkey, and South Africa |
| Key Segments Covered | The solution, Enterprise Size, Industry, and Region |
| Key Companies Profiled | Apolicy; PolicyIQ; PolicyHub; Immuta Inc; Tufin; Trellix; McAfee; TrueOps; Logic Manager; Micro Focus; FireMon; Forescout; Orchestral.io; Synopsys |
| Report Coverage | Market Forecast, Company Share Analysis, Competition Intelligence, DROT Analysis, Market Dynamics and Challenges, and Strategic Growth Initiatives |
| Customization & Pricing | Available upon Request |
The global policy orchestration market is estimated to be valued at USD 678.9 million in 2025.
It is projected to reach USD 1,116.4 million by 2035.
The market is expected to grow at a 5.1% CAGR between 2025 and 2035.
The key product types are policy orchestration platform, _on-premises, _cloud-based, services, _professional services and _managed services.
small offices (1–9 employees) segment is expected to dominate with a 12.5% industry share in 2025.


Our Research Products

The "Full Research Suite" delivers actionable market intel, deep dives on markets or technologies, so clients act faster, cut risk, and unlock growth.

The Leaderboard benchmarks and ranks top vendors, classifying them as Established Leaders, Leading Challengers, or Disruptors & Challengers.

Locates where complements amplify value and substitutes erode it, forecasting net impact by horizon

We deliver granular, decision-grade intel: market sizing, 5-year forecasts, pricing, adoption, usage, revenue, and operational KPIs—plus competitor tracking, regulation, and value chains—across 60 countries broadly.

Spot the shifts before they hit your P&L. We track inflection points, adoption curves, pricing moves, and ecosystem plays to show where demand is heading, why it is changing, and what to do next across high-growth markets and disruptive tech

Real-time reads of user behavior. We track shifting priorities, perceptions of today’s and next-gen services, and provider experience, then pace how fast tech moves from trial to adoption, blending buyer, consumer, and channel inputs with social signals (#WhySwitch, #UX).

Partner with our analyst team to build a custom report designed around your business priorities. From analysing market trends to assessing competitors or crafting bespoke datasets, we tailor insights to your needs.
Supplier Intelligence
Discovery & Profiling
Capacity & Footprint
Performance & Risk
Compliance & Governance
Commercial Readiness
Who Supplies Whom
Scorecards & Shortlists
Playbooks & Docs
Category Intelligence
Definition & Scope
Demand & Use Cases
Cost Drivers
Market Structure
Supply Chain Map
Trade & Policy
Operating Norms
Deliverables
Buyer Intelligence
Account Basics
Spend & Scope
Procurement Model
Vendor Requirements
Terms & Policies
Entry Strategy
Pain Points & Triggers
Outputs
Pricing Analysis
Benchmarks
Trends
Should-Cost
Indexation
Landed Cost
Commercial Terms
Deliverables
Brand Analysis
Positioning & Value Prop
Share & Presence
Customer Evidence
Go-to-Market
Digital & Reputation
Compliance & Trust
KPIs & Gaps
Outputs
Full Research Suite comprises of:
Market outlook & trends analysis
Interviews & case studies
Strategic recommendations
Vendor profiles & capabilities analysis
5-year forecasts
8 regions and 60+ country-level data splits
Market segment data splits
12 months of continuous data updates
DELIVERED AS:
PDF EXCEL ONLINE
Network Security Policy Management Market Size and Share Forecast Outlook 2025 to 2035
Cloud-Based Data Orchestration – AI for Smarter Insights
Service Orchestration Market Size and Share Forecast Outlook 2025 to 2035
Security Orchestration Automation and Response (SOAR) Market Size and Share Forecast Outlook 2025 to 2035
Microservices Orchestration Market Growth - Trends & Forecast 2025 to 2035
Virtual Power Plant (VPP) and V2G Orchestration Market Analysis - Size, Share, and Forecast Outlook 2025 to 2035

Thank you!
You will receive an email from our Business Development Manager. Please be sure to check your SPAM/JUNK folder too.
Chat With
MaRIA