

- Market Size (2026)
- USD 520.0 Mn
- Forecast (2036)
- USD 1112.3 Mn
- CAGR (2026 to 2036)
- 7.9%
How big is the Poultry Emulsification Additives Market in 2026?
USD 520.0 million in 2026 and USD 1,112.3 million by 2036 at a 7.9% CAGR.
The poultry emulsification additives demand is shifting from basic additive sourcing toward formulation control and feed-efficiency proof. Feed mills assess microbial source validation and gut-health claims during ration design. OECD-FAO reported poultry consumption will account for 62% of additional meat consumed globally by 2034, giving additive suppliers a measured signal for nutrition-linked product planning.
Feed-cost pressure keeps emulsification additives inside buyer discussions as mills seek better fat use and diet consistency. Source selection is tied to handling stability and evidence supporting nutrient utilization. Department for Environment, Food and Rural Affairs reported poultry feed prices decreased 11% in 2024, making buyers more selective about additive claims and trial proof.
Production scale also supports supplier qualification across poultry-focused feed systems. USDA reported combined broiler and chicken sales value reached USD 81.7 billion in 2025, up 16% from 2024. Output value keeps feed additive programs linked to quality checks and operating records.
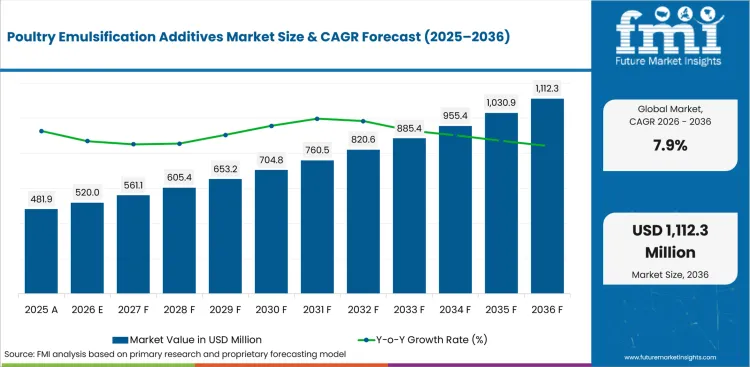
| Metric | Value |
|---|---|
| 2025 Market Size | USD 481.9 million |
| 2026 Market Size | USD 520.0 million |
| 2036 Market Size | USD 1,112.3 million |
| Forecast CAGR (2026-2036) | 7.9% |
| Leading Form | Dry |
| Dry Share (2026) | 38.0% |
| Leading Livestock | Poultry |
| Poultry Share (2026) | 37.5% |
| Leading Source | Microbial |
| Microbial Share (2026) | 35.5% |
| Fastest-growing Country | India |
| India CAGR by 2036 | 7.1% |
Summary of the Poultry Emulsification Additives Market
| Market Signal | Commercial Impact |
|---|---|
| Demand and Growth Drivers | Demand for poultry emulsification additives is increasing as feed mills connect formulation stability with diet performance across poultry programs.
|
| Product and Segment View | Segment demand is led by dry formats and microbial source choices that match established feed handling and technical review practices.
|
| Geography and Growth Outlook | Regional demand is shaped by poultry production density and supplier ability to support local documentation practices.
|
| Competitive Landscape |
|
| Analyst Perspective | Poultry emulsification additives are shifting into a formulation-control input as buyers connect additive use with feed efficiency and animal performance.
|
How is the poultry emulsification additives market segmented?
The poultry emulsification additives industry is segmented by form, source, livestock, function, and sales channel.
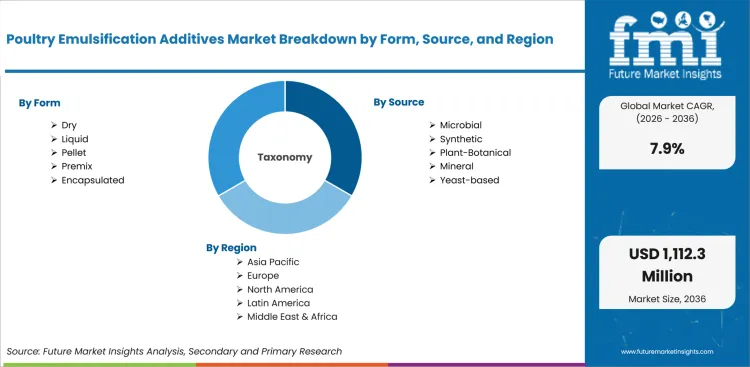
The poultry emulsification additives market is segmented by form, source, livestock, function, and sales channel. By form, coverage includes Dry, Liquid, Pellet, Premix, and Encapsulated. By source, coverage includes Synthetic, Microbial, Plant/Botanical, Mineral, and Yeast-based. By livestock, coverage includes Poultry, Broilers, Layers, Turkey, and Other poultry. By function, coverage includes Gut health, Growth performance, Immunity, Nutrient utilization, and Stress management. By sales channel, coverage includes Direct Feed Mill Supply, Premix Distributors, Integrator-Owned Feed Mills, Veterinary Nutrition Channels, and Specialty Additive Distributors.
Why do dry formats lead within the form segment?
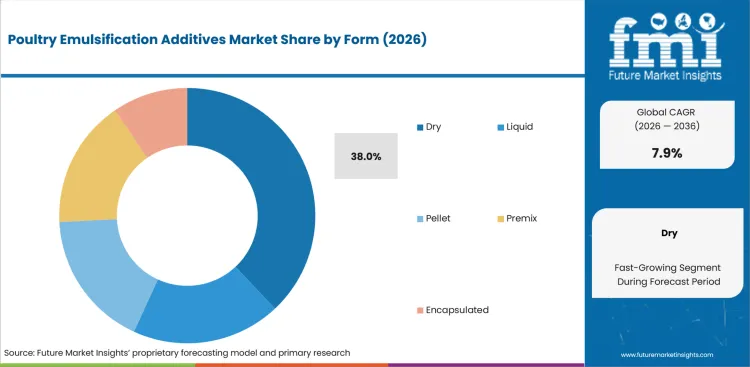
Dry formats lead through dosing ease and compatibility with standard premix handling. Feed mills need additive formats that blend consistently through mash and premix routines. Alltech reported world feed production increased 2.9% to 1.44 billion metric tons in 2025, making handling reliability more valuable for additives used across high-throughput feed plants.
- Dry formats are expected to account for 38.0% share in 2026, driven by dosing control and lower handling complexity across feed mills. Operators prefer dry products for blending routines requiring steady dispersion without extra equipment changes.
- Liquid and encapsulated formats remain useful in selected feed programs. Dry products keep selection strength once buyers compare shelf stability and application support across poultry diets.
What supports demand for microbial source choices?
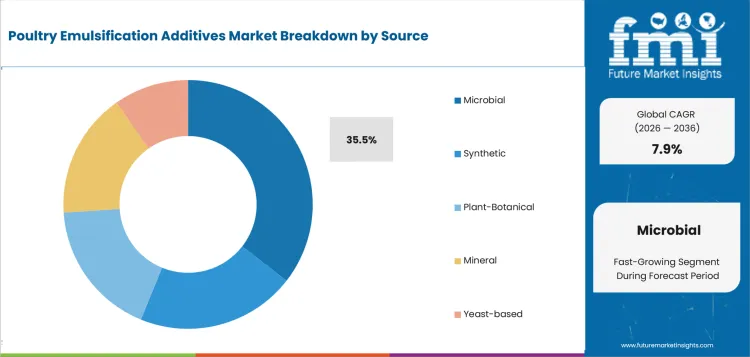
Microbial source choices gain attention through traceability and compatibility with animal nutrition documentation. Feed additive buyers assess source origin before commercial use. DSM-Firmenich reported sale of its 50% stake in the Feed Enzymes Alliance for EUR 1.5 billion in 2025, showing commercial weight around enzyme-led and microbial feed pathways.
- Microbial sources are projected to hold 35.5% share in 2026, reflected by buyer interest in traceable and technically documented additive inputs. Nutrition teams use source evidence to check batch consistency before wider ration use.
- Synthetic and plant-based sources retain value in cost-sensitive or label-specific programs. Microbial options gain consideration once suppliers provide stability data and application support for poultry diets.
How do poultry applications shape the livestock segment?
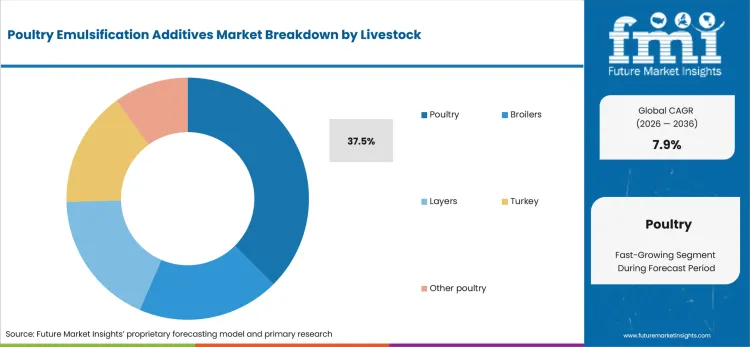
Poultry applications form the main demand pool through feed conversion sensitivity and frequent ration adjustment. Broiler and layer operations need feed inputs that support diet consistency across production cycles. Statistics Canada reported egg farmers produced 997.2 million dozen eggs in 2025, up 9.2% from 2024, showing output intensity that keeps formulation support important.
- Poultry is anticipated to represent 37.5% share in 2026, supported by feed efficiency pressure across broilers and turkey programs. Supplier approval depends on species-specific documentation and repeatable diet performance.
- Broilers and layers add value through production-cycle intensity. Poultry remains the main livestock base, while turkey and other poultry programs increase demand for more specific formulation support.
What market factors influence gut health functions?
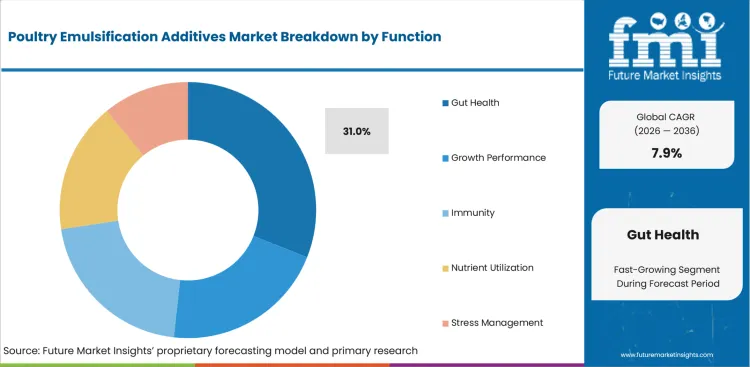
Gut health functions influence buying decisions as poultry producers link feed additives with nutrient utilization and bird resilience. Feed programs need claims that can be checked through trials and performance records. FDA reported medically important antimicrobial sales and distribution for food-producing animals increased 16% between 2023 and 2024, keeping gut-health alternatives inside feed review.
- Gut health is set to secure 31.0% share in 2026, driven by feed programs requiring performance evidence and better diet stability. Buyers prefer additives that can be assessed through practical trial outcomes.
- Growth performance and nutrient utilization functions remain important in feed planning. Gut health keeps buyer attention once suppliers connect additive use with measurable feed conversion and animal performance records.
How do direct feed mill supply channels shape sales decisions?
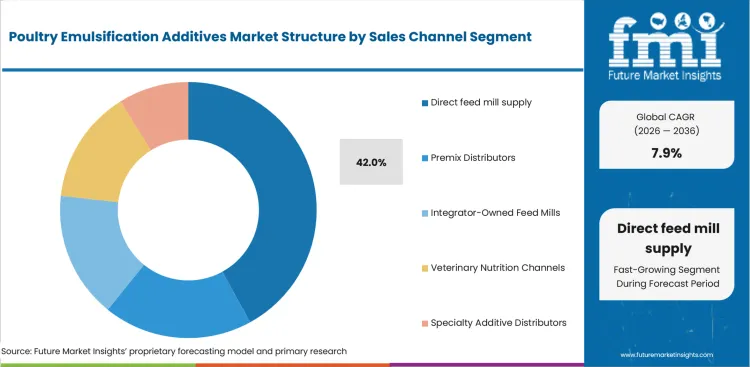
Direct feed mill supply supports additive approval as mills require batch records and technical support before routine use. Supplier contact with nutrition and quality teams reduces interpretation gaps during formulation trials. Cargill stated its Engerwitzdorf micronutrition expansion will raise annual capacity to 30,000 metric tons, showing how direct technical supply can support feed additive scale.
- Direct feed mill supply is expected to account for 42.0% share in 2026, shaped by buyer preference for technical support and predictable additive documentation. Mills value supplier access during dosing and trial review.
- Premix distributors and specialty additive distributors remain important for smaller buyers. Direct supply keeps value once formulation teams need rapid troubleshooting and clear product accountability.
What are the drivers, restraints, and opportunities in the poultry emulsification additives market?
Near-term purchases are shaped by feed-cost pressure and species-specific premix opportunities outlined below.
- Driver: Feed-cost pressure and raw-material variability push buyers toward additives that improve ration consistency and nutrient use.
- Restraint: Adoption slows once farm trials and mill-handling practices do not align across species programs.
- Opportunity: Species-specific premixes and service packages create a practical path into mills that need measurable feed outcomes.
Feed-cost pressure supports additive demand as mills seek better fat dispersion and fewer diet corrections. Emulsification additives help nutrition teams manage oil use and batch consistency during ration changes. USDA reported combined poultry production value at USD 81.7 billion in 2025, up 16% from 2024, giving suppliers a scale signal for performance-linked feed inputs.
Trial complexity remains a restraint for smaller suppliers. Feed programs need proof across handling, bird response, and mill routines before commercial approval. Department for Environment, Food and Rural Affairs reported total poultry meat production at 177.4 thousand tonnes in May 2026, down 0.7% from May 2025, showing how output changes can tighten buyer review of additive spending.
Species-specific premixes create an opportunity for suppliers able to connect emulsification with documented feed outcomes. Large hatchery and poultry systems need additives matching volume routines and quality checks. Eurostat reported 10.5 billion eggs placed in incubation for meat utility chicks in 2024, creating a practical base for poultry-focused nutrition support.
Which country CAGRs are profiled in the poultry emulsification additives market?
.webp "Top Country Growth Comparison Poultry Emulsification Additives Market Cagr (2026 2036)")
| Country | CAGR |
| India | 7.1% |
| China | 5.9% |
| United States | 4.7% |
| South Korea | 4.6% |
| United Kingdom | 4.3% |
| Germany | 4.0% |
| Japan | 3.4% |
Source: Future Market Insights analysis, 2026.
How do country-level CAGRs compare in the poultry emulsification additives market?
Country CAGR profiles in the poultry emulsification additives market reflect source documentation and nutrition service needs. India and China show faster adoption through poultry production expansion and larger feed conversion pressure. The United States and South Korea stand in a mid-tier adoption band shaped by commercial broiler programs and structured formulation review. United Kingdom and Germany show steadier feed additive use through documentation-led buying and feed plant discipline. Japan reflects a careful evidence cycle as quality files and stable supplier performance guide account conversion.
- India is projected at 7.1% CAGR by 2036, helped by integrated poultry scale as Press Information Bureau reported commercial poultry contributed 125.98 billion eggs or 84.49% of national output in 2024-25, supporting additive use across high-volume layer and broiler diets.
- China is forecast at 5.9% CAGR through 2036, reinforced by feed-efficiency review after the National Bureau of Statistics reported poultry output reached 28.37 million tons in 2025 and increased 6.7% over 2024, strengthening the case for ration-stability additives.
- United States is expected to expand at 4.7% CAGR over the forecast period, backed by broiler scale since USDA Economic Research Service projected 2026 broiler production at 49.146 billion pounds, keeping fat dispersion and feed conversion evidence central to supplier approval.
- South Korea is estimated at 4.6% CAGR by 2036, supported by concentrated chicken programs as USDA Foreign Agricultural Service projected 2026 production at 925,000 metric tons and up 0.5% from 2025, making trial proof useful for commercial feed buyers.
- United Kingdom is projected at 4.3% CAGR through 2036, guided by feed-cost review as Department for Environment, Food and Rural Affairs reported poultry feed prices decreased 4.0% in 2025, raising scrutiny around additive value and mill-level performance claims.
- Germany is forecast at 4.0% CAGR by 2036, underpinned by compound feed recovery after German Animal Nutrition Association data showed production rose 2.9% to nearly 22.5 million tonnes in 2025, supporting documentation-led feed additive assessment.
- Japan is predicted at 3.4% CAGR through 2036, shaped by careful sourcing as USDA Foreign Agricultural Service projected 2026 chicken total distribution at 3.125 million metric tons, favoring suppliers with stable batches and concise quality files.
Who are the notable companies in the Poultry Emulsification Additives Market?
Cargill, ADM, DSM-Firmenich, Kemin Industries, Alltech, Novonesis, Adisseo, and Trouw Nutrition are notable companies shaping poultry emulsification additives and animal nutrition systems.
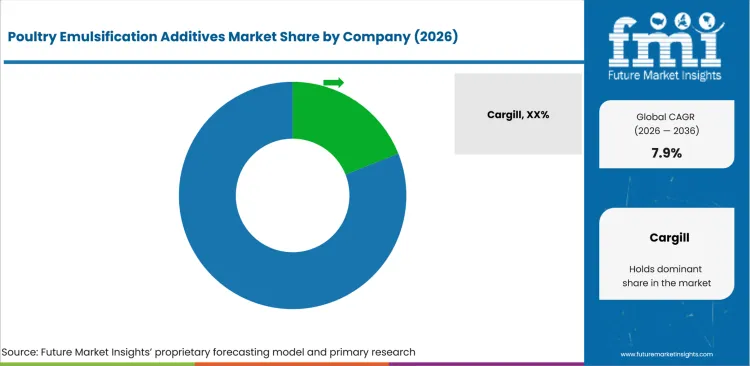
Competition in poultry emulsification additives is grouped by buyer expectations around formulation support and feed mill service. Cargill and ADM bring ingredient supply and feed channel depth. Kemin Industries, Alltech, and Adisseo compete across specialty additive portfolios and species support. DSM-Firmenich, Novonesis, and Trouw Nutrition support feed programs based on nutrition knowledge and premix services.
- Cargill and ADM compete depending on ingredient access and feed mill relationships. Buyers review such suppliers for supply reliability and practical application support.
- Kemin Industries, Alltech, and Adisseo strengthen competition led by specialty additive portfolios. Nutrition teams use such suppliers for gut-health and mill-handling support.
- DSM-Firmenich and Novonesis support enzyme and biosolution pathways linked to feed efficiency. Buyer interest rises once additive evidence must align with animal performance records.
- Trouw Nutrition competes based on premix knowledge and farm-facing nutrition service. Channel support remains useful for buyers managing trial scale-up and documentation.
Competitive Benchmarking: Poultry Emulsification Additives Market
| Company | Species Coverage | Technical Service Fit | Premix or Mill Integration | Geographic Reach |
| Cargill | High | High | High | Global |
| ADM | Medium | Medium | Medium | Global |
| DSM-Firmenich | High | High | High | Global |
| Kemin Industries | Strong | Strong | Strong | Global |
| Alltech | Strong | Strong | Strong | Global |
| Novonesis | High | High | High | Global |
| Adisseo | High | High | High | Global |
| Trouw Nutrition | Strong | Strong | Strong | Global |
Source: Future Market Insights competitive analysis, 2026.
Key Developments in the Poultry Emulsification Additives Market
- In June 2025, Novonesis completed acquisition of DSM-Firmenich’s share of the Feed Enzyme Alliance. Sale and distribution control improved Novonesis’ position across animal biosolutions and feed enzyme programs.
- In November 2025, Cargill completed expansion of its Engerwitzdorf micronutrition facility. Annual production capacity increased to 30,000 metric tons, supporting feed additive buyers needing supply assurance and quality discipline.
- In May 2026, Sinochem reported Adisseo launched Sanion Tetra 50 and Sanion Tetra 70. Protected sodium butyrate formats added gut-health support for feed buyers evaluating handling quality and nutrition performance.
Key Players in the Poultry Emulsification Additives Market
Integrated Feed and Ingredient Suppliers
- Cargill
- ADM
- Trouw Nutrition
Specialty Additive Suppliers
- Kemin Industries
- Alltech
- Adisseo
Biotechnology and Enzyme Specialists
- DSM-Firmenich
- Novonesis
Poultry Emulsification Additives Market - Report Scope
| Coverage field | Report scope |
| Market breakdown | Poultry Emulsification Additives Market Breakdown By Form, Source, Livestock, Function, and Sales Channel |
| Market Definition | Products and related solutions used as feed additive inputs to improve formulation, fat dispersion, diet consistency, animal performance, quality control, and operating reliability for poultry feed buyers |
| Regions Covered | North America, Latin America, Western Europe, Eastern Europe, East Asia, South Asia and Pacific, Middle East and Africa |
| Countries Covered | United States, United Kingdom, Germany, Japan, China, South Korea, India, and 30+ countries |
| Key Companies Profiled | Cargill, ADM, DSM-Firmenich, Kemin Industries, Alltech, Novonesis, Adisseo, Trouw Nutrition |
| Forecast Period | 2026 to 2036 |
| Approach | Hybrid bottom-up and top-down methodology using feed output, additive adoption, form mix, source positioning, livestock intensity, supplier reach, and country-level nutrition demand signals |
Source: Future Market Insights analysis, 2026.
Poultry Emulsification Additives Market - Research Methodology
| Method | Approach |
| Primary Research | FMI analysts reviewed inputs from nutrition teams, feed mill managers, quality teams, farm operations teams, additive suppliers, distributors, technical specialists, and channel partners. Discussions focused on additive use, blending behavior, supplier selection, trial barriers, and measurable operating value. |
| Desk Research | Desk research covered poultry production data, feed ingredient signals, official livestock statistics, company launch updates, animal nutrition references, and public datasets connected to feed additives. Product coverage was checked against form, source, livestock, function, and commercial feed application. |
| Market Sizing and Forecasting | Model design combined 2026 baseline value, form adoption, source mix, poultry feed intensity, function demand, supplier reach, country CAGR assumptions, and documented feed additive use signals. Forecast assumptions were adjusted for feed mill adoption, species intensity, and premix penetration. |
| Data Validation | Forecasts were checked against poultry output signals, feed industry patterns, company product activity, and supplier qualification behavior. Company portfolios were reviewed to avoid counting adjacent animal nutrition products without direct feed additive use. |
Poultry Emulsification Additives Market by Segments
Poultry Emulsification Additives Market segmented by Form:
- Dry
- Liquid
- Pellet
- Premix
- Encapsulated
Poultry Emulsification Additives Market segmented by Source:
- Synthetic
- Microbial
- Plant/Botanical
- Mineral
- Yeast-based
Poultry Emulsification Additives Market segmented by Livestock:
- Poultry
- Broilers
- Layers
- Turkey
- Other poultry
Poultry Emulsification Additives Market segmented by Function:
- Gut health
- Growth performance
- Immunity
- Nutrient utilization
- Stress management
Poultry Emulsification Additives Market segmented by Sales Channel:
- Direct Feed Mill Supply
- Premix Distributors
- Integrator-Owned Feed Mills
- Veterinary Nutrition Channels
- Specialty Additive Distributors
Poultry Emulsification Additives Market segmented by Region:
- North America
- Latin America
- Western Europe
- Eastern Europe
- East Asia
- South Asia and Pacific
- Middle East and Africa
Research Sources and Bibliography
- Sinochem Holdings Corporation. (2026, May 15). Adisseo launches new sodium butyrate products. Sinochem Holdings Corporation.
- Alltech. (2026, April 21). 2026 Alltech Agri-Food Outlook shares global feed production survey data. Alltech.
- Cargill. (2025, November 4). Cargill Animal Nutrition & Health increases micronutrition production capacity to meet growing customer demand. Cargill.
- Department for Environment, Food & Rural Affairs. (2025, July 25). Agriculture in the United Kingdom 2024. Department for Environment, Food & Rural Affairs.
- Department for Environment, Food & Rural Affairs. (2026, June 11). Total income from farming in the UK in 2025. Department for Environment, Food & Rural Affairs.
- Department for Environment, Food & Rural Affairs. (2026, June 18). Monthly statistics on the activity of UK hatcheries and UK poultry slaughterhouses: Data for May 2026. Department for Environment, Food & Rural Affairs.
- DSM-Firmenich. (2026, February 20). Animal Nutrition & Health. DSM-Firmenich Integrated Annual Report 2025.
- Eurostat. (2026, June). Poultry statistics. Eurostat.
- Food and Drug Administration. (2025, December 5). FDA releases annual summary report on antimicrobials sold or distributed in 2024 for use in food-producing animals. Food and Drug Administration.
- German Animal Nutrition Association. (2026, March 16). Compound feed production grows, challenges remain. German Animal Nutrition Association.
- National Bureau of Statistics of China. (2026, February 28). Statistical communique of the People’s Republic of China on the 2025 national economic and social development. National Bureau of Statistics of China.
- Novonesis. (2025, June 2). Deal to acquire dsm-firmenich’s share of the Feed Enzyme Alliance is completed, supporting Novonesis’ growth strategy. Novonesis.
- OECD and Food and Agriculture Organization of the United Nations. (2025, July 15). OECD-FAO Agricultural Outlook 2025-2034: Meat. Organisation for Economic Co-operation and Development.
- Press Information Bureau. (2025, November 26). Release of Basic Animal Husbandry Statistics 2025 on the occasion of National Milk Day 2025. Press Information Bureau.
- Statistics Canada. (2026, May 27). Poultry and egg statistics, 2025. Statistics Canada.
- USA Department of Agriculture, Economic Research Service. (2026, June 17). Livestock, dairy, and poultry outlook: June 2026. USA Department of Agriculture.
- USA Department of Agriculture, Foreign Agricultural Service. (2025, September 22). Poultry and products annual: Korea. USA Department of Agriculture.
- USA Department of Agriculture, Foreign Agricultural Service. (2025, September 30). Poultry and products annual: Japan. USA Department of Agriculture.
- USA Department of Agriculture, National Agricultural Statistics Service. (2026, April 30). Poultry - Production and Value 2025 Summary. USA Department of Agriculture.
This bibliography is provided for reader reference and is not exhaustive. The full report contains the complete reference list and detailed citations.
This Report Answers
- What is the expected global value of the poultry emulsification additives market in 2026 and 2036?
- What CAGR is forecast for poultry emulsification additives during the 2026 to 2036 period?
- Which form segment is used to assess dry format demand in 2026?
- Why do feed mills buy emulsification additives with validated blending and diet-performance support?
- How do microbial sources and gut-health functions shape additive selection?
- Which countries are compared in the poultry emulsification additives market forecast?
- Which companies compete across poultry emulsification additives and animal nutrition pathways?
- What additive forms, sources, livestock applications, functions, and sales channels are included within the market definition?
- How does FMI size and forecast poultry emulsification additives demand across segments and countries?
- What implementation and supplier-selection factors should executives assess?
Frequently Asked Questions
What is driving expansion in the poultry emulsification additives market?
Expansion is driven by feed-cost pressure and buyer preference for additives that support fat dispersion and repeatable ration performance.
Why should executives track the poultry emulsification additives market?
Executives should track poultry emulsification additives demand since feed formulation quality affects animal performance and supplier accountability.
What business problem does the poultry emulsification additives market address?
Poultry emulsification additives help feed buyers reduce uncertainty around fat use and repeatable performance in commercial poultry diets.
What should sourcing leaders evaluate before selecting suppliers?
Sourcing leaders should compare formulation evidence and trial-service capability before supplier approval.
What can limit return on investment for buyers?
Return on investment can be delayed if additive claims fail farm trials or require mill-handling changes that buyers have not budgeted for.
How can suppliers build executive confidence?
Suppliers build confidence through verified application evidence and technical accountability during feed trial and scale-up stages.
Preview the report firsthand - request a free sample
Get SampleGet the brochure for pricing and purchase details.
Get PDFTable of Content
- Key Takeaways
- Market Size and CAGR
- Top Growth Driver
- Fastest Growing Segment
- Leading Region
- Key Companies
- Emerging Opportunities
- Executive Summary
- Global Market Outlook
- Demand-side Trends
- Supply-side Trends
- Technology Roadmap Analysis
- Analysis and Recommendations
- Analyst Perspective (What is happening? Why now? What should investors know?)
- Key Questions Answered
- How large is the market?
- What is the CAGR?
- What are key trends?
- Which region dominates?
- Who are the leaders?
- Market Overview
- Market Coverage / Taxonomy
- Market Definition / Scope / Limitations
- Research Methodology
- Chapter Orientation
- Analytical Lens and Working Hypotheses
- Market Structure, Signals, and Trend Drivers
- Benchmarking and Cross-market Comparability
- Market Sizing, Forecasting, and Opportunity Mapping
- Research Design and Evidence Framework
- Desk Research Programme (Secondary Evidence)
- Expert Input and Fieldwork (Primary Evidence)
- Tooling, Models, and Reference Databases
- Data Engineering and Model Build
- Quality Assurance and Audit Trail
- Market Background
- Market Dynamics (Drivers, Restraints, Opportunity, Trends)
- Scenario Forecast (Optimistic, Likely, Conservative)
- Impact Analysis
- AI Impact
- Sustainability Impact
- Regulatory Impact
- Technology Impact
- Consumer / Buyer Analysis
- Purchase Drivers
- Adoption Barriers
- Buyer Journey
- Opportunity Map Analysis
- Product Life Cycle Analysis
- Supply Chain Analysis
- Investment Feasibility Matrix
- Value Chain Analysis
- PESTLE and Porter's Analysis
- Regulatory Landscape
- Regional Parent Market Outlook
- Production and Consumption Statistics
- Import and Export Statistics
- Global Market Analysis and Forecast, 2021 to 2036
- Historical Market Size Value (USD Million) & Volume (Unit) Analysis, 2021 to 2025
- Current and Future Market Size Value (USD Million) & Volume (Unit) Projections, 2026 to 2036
- Y-o-Y Growth Trend Analysis
- Absolute $ Opportunity Analysis
- Global Market Pricing Analysis, 2021 to 2036
- Global Market Analysis and Forecast, By Form, 2021 to 2036
- Introduction / Key Findings
- Historical Market Size Value (USD Million) & Volume (Unit) Analysis By Form, 2021 to 2025
- Current and Future Market Size Value (USD Million) & Volume (Unit) Analysis and Forecast By Form, 2026 to 2036
- Dry
- Liquid
- Pellet
- Premix
- Encapsulated
- Dry
- Y-o-Y Growth Trend Analysis By Form, 2021 to 2025
- Absolute $ Opportunity Analysis By Form, 2026 to 2036
- Global Market Analysis and Forecast, By Source, 2021 to 2036
- Introduction / Key Findings
- Historical Market Size Value (USD Million) & Volume (Unit) Analysis By Source, 2021 to 2025
- Current and Future Market Size Value (USD Million) & Volume (Unit) Analysis and Forecast By Source, 2026 to 2036
- Microbial
- Synthetic
- Plant-Botanical
- Mineral
- Yeast-based
- Microbial
- Y-o-Y Growth Trend Analysis By Source, 2021 to 2025
- Absolute $ Opportunity Analysis By Source, 2026 to 2036
- Global Market Analysis and Forecast, By Livestock, 2021 to 2036
- Introduction / Key Findings
- Historical Market Size Value (USD Million) & Volume (Unit) Analysis By Livestock, 2021 to 2025
- Current and Future Market Size Value (USD Million) & Volume (Unit) Analysis and Forecast By Livestock, 2026 to 2036
- Poultry
- Broilers
- Layers
- Turkey
- Other poultry
- Poultry
- Y-o-Y Growth Trend Analysis By Livestock, 2021 to 2025
- Absolute $ Opportunity Analysis By Livestock, 2026 to 2036
- Global Market Analysis and Forecast, By Function, 2021 to 2036
- Introduction / Key Findings
- Historical Market Size Value (USD Million) & Volume (Unit) Analysis By Function, 2021 to 2025
- Current and Future Market Size Value (USD Million) & Volume (Unit) Analysis and Forecast By Function, 2026 to 2036
- Gut Health
- Growth Performance
- Immunity
- Nutrient Utilization
- Stress Management
- Gut Health
- Y-o-Y Growth Trend Analysis By Function, 2021 to 2025
- Absolute $ Opportunity Analysis By Function, 2026 to 2036
- Global Market Analysis and Forecast, By Sales Channel, 2021 to 2036
- Introduction / Key Findings
- Historical Market Size Value (USD Million) & Volume (Unit) Analysis By Sales Channel, 2021 to 2025
- Current and Future Market Size Value (USD Million) & Volume (Unit) Analysis and Forecast By Sales Channel, 2026 to 2036
- Direct feed mill supply
- Premix Distributors
- Integrator-Owned Feed Mills
- Veterinary Nutrition Channels
- Specialty Additive Distributors
- Direct feed mill supply
- Y-o-Y Growth Trend Analysis By Sales Channel, 2021 to 2025
- Absolute $ Opportunity Analysis By Sales Channel, 2026 to 2036
- Global Market Analysis and Forecast, By Region, 2021 to 2036
- Introduction
- Historical Market Size Value (USD Million) & Volume (Unit) Analysis By Region, 2021 to 2025
- Current Market Size Value (USD Million) & Volume (Unit) Analysis and Forecast By Region, 2026 to 2036
- North America
- Latin America
- Western Europe
- Eastern Europe
- East Asia
- South Asia and Pacific
- Middle East & Africa
- Market Attractiveness Analysis By Region
- North America Market Analysis and Forecast, By Country, 2021 to 2036
- Historical Market Size Value (USD Million) & Volume (Unit) Trend Analysis By Market Taxonomy, 2021 to 2025
- Market Size Value (USD Million) & Volume (Unit) Forecast By Market Taxonomy, 2026 to 2036
- By Country
- USA
- Canada
- Mexico
- By Form
- By Source
- By Livestock
- By Function
- By Sales Channel
- By Country
- Market Attractiveness Analysis
- By Country
- By Form
- By Source
- By Livestock
- By Function
- By Sales Channel
- Key Takeaways
- Latin America Market Analysis and Forecast, By Country
- Historical Market Size Value (USD Million) & Volume (Unit) Trend Analysis By Market Taxonomy, 2021 to 2025
- Market Size Value (USD Million) & Volume (Unit) Forecast By Market Taxonomy, 2026 to 2036
- By Country
- Brazil
- Chile
- Rest of Latin America
- By Form
- By Source
- By Livestock
- By Function
- By Sales Channel
- By Country
- Market Attractiveness Analysis
- By Country
- By Form
- By Source
- By Livestock
- By Function
- By Sales Channel
- Key Takeaways
- Western Europe Market Analysis and Forecast, By Country
- Historical Market Size Value (USD Million) & Volume (Unit) Trend Analysis By Market Taxonomy, 2021 to 2025
- Market Size Value (USD Million) & Volume (Unit) Forecast By Market Taxonomy, 2026 to 2036
- By Country
- Germany
- UK
- Italy
- Spain
- France
- Nordic
- BENELUX
- Rest of Western Europe
- By Form
- By Source
- By Livestock
- By Function
- By Sales Channel
- By Country
- Market Attractiveness Analysis
- By Country
- By Form
- By Source
- By Livestock
- By Function
- By Sales Channel
- Key Takeaways
- Eastern Europe Market Analysis and Forecast, By Country
- Historical Market Size Value (USD Million) & Volume (Unit) Trend Analysis By Market Taxonomy, 2021 to 2025
- Market Size Value (USD Million) & Volume (Unit) Forecast By Market Taxonomy, 2026 to 2036
- By Country
- Russia
- Poland
- Hungary
- Balkan & Baltic
- Rest of Eastern Europe
- By Form
- By Source
- By Livestock
- By Function
- By Sales Channel
- By Country
- Market Attractiveness Analysis
- By Country
- By Form
- By Source
- By Livestock
- By Function
- By Sales Channel
- Key Takeaways
- East Asia Market Analysis and Forecast, By Country
- Historical Market Size Value (USD Million) & Volume (Unit) Trend Analysis By Market Taxonomy, 2021 to 2025
- Market Size Value (USD Million) & Volume (Unit) Forecast By Market Taxonomy, 2026 to 2036
- By Country
- China
- Japan
- South Korea
- By Form
- By Source
- By Livestock
- By Function
- By Sales Channel
- By Country
- Market Attractiveness Analysis
- By Country
- By Form
- By Source
- By Livestock
- By Function
- By Sales Channel
- Key Takeaways
- South Asia and Pacific Market Analysis and Forecast, By Country
- Historical Market Size Value (USD Million) & Volume (Unit) Trend Analysis By Market Taxonomy, 2021 to 2025
- Market Size Value (USD Million) & Volume (Unit) Forecast By Market Taxonomy, 2026 to 2036
- By Country
- India
- ASEAN
- Australia & New Zealand
- Rest of South Asia and Pacific
- By Form
- By Source
- By Livestock
- By Function
- By Sales Channel
- By Country
- Market Attractiveness Analysis
- By Country
- By Form
- By Source
- By Livestock
- By Function
- By Sales Channel
- Key Takeaways
- Middle East & Africa Market Analysis and Forecast, By Country
- Historical Market Size Value (USD Million) & Volume (Unit) Trend Analysis By Market Taxonomy, 2021 to 2025
- Market Size Value (USD Million) & Volume (Unit) Forecast By Market Taxonomy, 2026 to 2036
- By Country
- Kingdom of Saudi Arabia
- Other GCC Countries
- Türkiye
- South Africa
- Other African Union
- Rest of Middle East & Africa
- By Form
- By Source
- By Livestock
- By Function
- By Sales Channel
- By Country
- Market Attractiveness Analysis
- By Country
- By Form
- By Source
- By Livestock
- By Function
- By Sales Channel
- Key Takeaways
- Key Countries Market Analysis
- USA
- Pricing Analysis
- Market Share Analysis, 2025
- By Form
- By Source
- By Livestock
- By Function
- By Sales Channel
- Canada
- Pricing Analysis
- Market Share Analysis, 2025
- By Form
- By Source
- By Livestock
- By Function
- By Sales Channel
- Mexico
- Pricing Analysis
- Market Share Analysis, 2025
- By Form
- By Source
- By Livestock
- By Function
- By Sales Channel
- Brazil
- Pricing Analysis
- Market Share Analysis, 2025
- By Form
- By Source
- By Livestock
- By Function
- By Sales Channel
- Chile
- Pricing Analysis
- Market Share Analysis, 2025
- By Form
- By Source
- By Livestock
- By Function
- By Sales Channel
- Germany
- Pricing Analysis
- Market Share Analysis, 2025
- By Form
- By Source
- By Livestock
- By Function
- By Sales Channel
- UK
- Pricing Analysis
- Market Share Analysis, 2025
- By Form
- By Source
- By Livestock
- By Function
- By Sales Channel
- Italy
- Pricing Analysis
- Market Share Analysis, 2025
- By Form
- By Source
- By Livestock
- By Function
- By Sales Channel
- Spain
- Pricing Analysis
- Market Share Analysis, 2025
- By Form
- By Source
- By Livestock
- By Function
- By Sales Channel
- France
- Pricing Analysis
- Market Share Analysis, 2025
- By Form
- By Source
- By Livestock
- By Function
- By Sales Channel
- India
- Pricing Analysis
- Market Share Analysis, 2025
- By Form
- By Source
- By Livestock
- By Function
- By Sales Channel
- ASEAN
- Pricing Analysis
- Market Share Analysis, 2025
- By Form
- By Source
- By Livestock
- By Function
- By Sales Channel
- Australia & New Zealand
- Pricing Analysis
- Market Share Analysis, 2025
- By Form
- By Source
- By Livestock
- By Function
- By Sales Channel
- China
- Pricing Analysis
- Market Share Analysis, 2025
- By Form
- By Source
- By Livestock
- By Function
- By Sales Channel
- Japan
- Pricing Analysis
- Market Share Analysis, 2025
- By Form
- By Source
- By Livestock
- By Function
- By Sales Channel
- South Korea
- Pricing Analysis
- Market Share Analysis, 2025
- By Form
- By Source
- By Livestock
- By Function
- By Sales Channel
- Russia
- Pricing Analysis
- Market Share Analysis, 2025
- By Form
- By Source
- By Livestock
- By Function
- By Sales Channel
- Poland
- Pricing Analysis
- Market Share Analysis, 2025
- By Form
- By Source
- By Livestock
- By Function
- By Sales Channel
- Hungary
- Pricing Analysis
- Market Share Analysis, 2025
- By Form
- By Source
- By Livestock
- By Function
- By Sales Channel
- Kingdom of Saudi Arabia
- Pricing Analysis
- Market Share Analysis, 2025
- By Form
- By Source
- By Livestock
- By Function
- By Sales Channel
- Türkiye
- Pricing Analysis
- Market Share Analysis, 2025
- By Form
- By Source
- By Livestock
- By Function
- By Sales Channel
- South Africa
- Pricing Analysis
- Market Share Analysis, 2025
- By Form
- By Source
- By Livestock
- By Function
- By Sales Channel
- USA
- Market Structure Analysis
- Competition Dashboard
- Competition Benchmarking
- Market Share Analysis of Top Players
- By Regional
- By Form
- By Source
- By Livestock
- By Function
- By Sales Channel
- Emerging Startups
- Innovation Benchmarking
- Competition Analysis
- Competition Deep Dive
- Cargill
- Overview
- Product Portfolio
- Profitability by Market Segments (Product/Region/Sales Channel)
- Sales Footprint
- Strategy Overview
- Marketing Strategy
- Product Strategy
- Channel Strategy
- ADM
- Trouw Nutrition
- Kemin Industries
- Alltech
- Adisseo
- DSM-Firmenich
- Novonesis
- Cargill
- Case Studies
- Success Stories
- Recent Developments
- Competition Deep Dive
- Assumptions & Acronyms Used


