Push-Pull Slip Sheets Market Size and Share Forecast Outlook 2025 to 2035

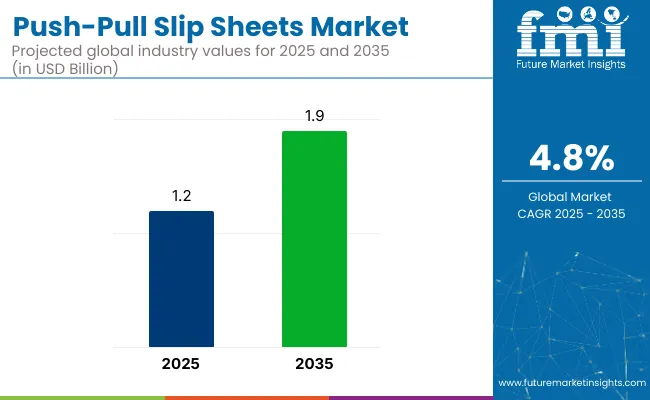
The global push-pull slip sheets market is projected to grow from USD 1.2 billion in 2025 to USD 1.9 billion by 2035, registering a CAGR of 4.8% during the forecast period.
Quick Stats of Push-Pull Slip Sheets Market

  • Market Value (2025): USD 1.2 billion
  • Forecast Value (2035): USD 1.9 billion
  • Forecast CAGR: 4.8%
  • Material Type Leader in 2025: Plastic (47.9% market share)
  • Top End Use: logistics (44.6% share)
  • Key Growth Country: Asia Pacific (China to record CAGR of 6.7% between 2025-2035)

Push Pull Slip Sheets Market

This growth is primarily attributed to the increasing demand for cost-effective and sustainable packaging solutions across various industries, including food and beverage, pharmaceuticals, and e-commerce. Push-pull slip sheets offer significant advantages over traditional pallets, such as reduced material costs, improved space utilization, and enhanced load stability, making them a preferred choice for modern logistics and supply chain operations.

In 2023, ORBIS Corporation, a leader in reusable packaging solutions, announced the completion of a significant expansion of its manufacturing facility in Urbana, Ohio. This expansion added 30% more space to the plant, allowing for increased production of reusable packaging products, including totes and pallets. The expansion also included the addition of new presses and tools, enhancing capacity and reducing lead times.

“This expansion gives us the flexibility and capacity to enhance production of our packaging products,” stated Norm Kukuk, President of ORBIS Corporation. The Urbana plant serves various industries, including automotive, food, beverage, and consumer packaged goods, and the expansion supports ORBIS's commitment to sustainable packaging solutions.

Recent innovations in the push-pull slip sheets market have centered around enhancing sustainability, functionality, and automation compatibility. Manufacturers are increasingly adopting recyclable and biodegradable materials, such as high-density polyethylene (HDPE) and corrugated fiberboard, to produce eco-friendly slip sheets that meet stringent environmental regulations.

Advancements in coating technologies have led to the development of slip sheets with improved moisture resistance and anti-slip properties, ensuring better load stability during transportation. Additionally, the integration of RFID tags and barcode systems into slip sheets is enabling better inventory management and traceability, aligning with the growing trend of smart logistics and supply chain automation.

The push-pull slip sheets market is expected to witness significant growth in emerging economies, particularly in the Asia-Pacific region, driven by rapid industrialization, increasing e-commerce activities, and the expansion of the manufacturing sector. Countries like China, India, and Indonesia are experiencing a surge in demand for efficient and sustainable material handling solutions, fueled by the need to optimize logistics operations and reduce environmental impact.

Manufacturers are anticipated to focus on developing cost-effective, customizable, and automation-compatible slip sheet solutions to cater to diverse industry needs and comply with evolving regulatory standards. Strategic collaborations, technological advancements, and investments in local production facilities are likely to play a crucial role in capturing market share and driving growth in these regions.

Analyzing Push-pull Slip Sheets Market by Top Investment Segment

The market has been segmented based on application, material type, end use, product type, and region. By application, food beverages, pharmaceuticals, consumer goods, and textiles represent key sectors adopting slip sheets for space-saving, cost-effective pallet alternatives in warehousing and transit. Material type segmentation includes plastic, paper, and composite variants-each selected based on moisture resistance, tensile strength, and recyclability considerations.

End use sectors such as retail, wholesale, logistics, and manufacturing reflect the growing utility of slip sheets in B2B fulfillment and industrial distribution chains. Product types include single use and reusable formats, allowing businesses to balance cost-efficiency with environmental footprint. Regional segmentation spans North America, Europe, South America, Asia Pacific, and the Middle East and Africa to reflect logistics infrastructure maturity, packaging automation, and sustainability initiatives influencing adoption.
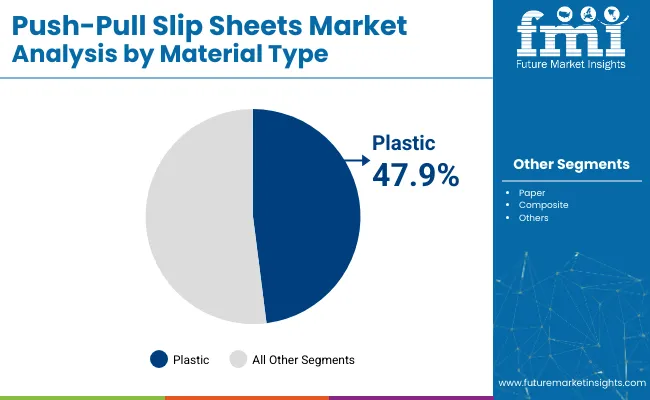
Plastic Segment to Hold 47.9% Share in 2025 Due to Durability, Moisture Resistance, and Reusability

Push Pull Slip Sheets Market Analysis By Material Type

The plastic segment is anticipated to dominate the material type category with a 47.9% share in 2025, supported by its superior durability, water resistance, and extended usability in high-volume, fast-paced supply chains. Compared to paper- or fiber-based alternatives, plastic slip sheets-typically made from HDPE or PP-offer excellent tear resistance and dimensional stability under heavy loads, making them ideal for repeated handling via push-pull attachments.

Plastic slip sheets are especially favored in export logistics and intra-warehouse transfers where ambient humidity, temperature fluctuations, and load security are critical factors. Their non-absorbent surface prevents mold formation and contamination during cross-border shipping of food, beverages, chemicals, and industrial materials.

Another key advantage lies in reusability is that plastic slip sheets can withstand 80-100 cycles under optimal conditions, significantly reducing cost-per-use and supporting sustainability initiatives within corporate logistics frameworks. Lightweight design further contributes to reduced freight weight and lower carbon emissions, aligning with ESG-driven procurement decisions.

With rapid adoption in organized retail supply chains, cold storage environments, and global freight operations, plastic slip sheets are expected to remain the preferred material category throughout the forecast period.
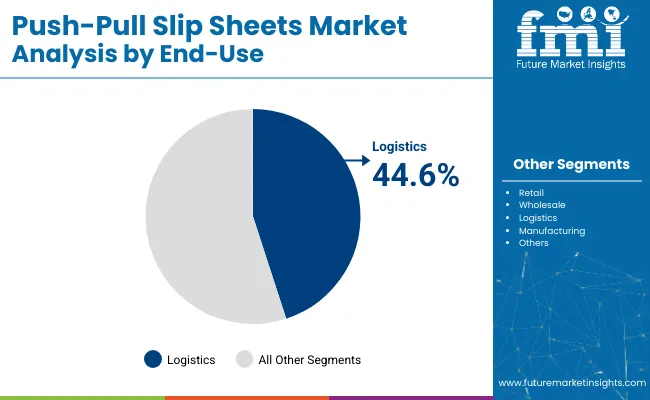
Logistics Segment to Lead End-Use Sector with Supply Chain Optimization and Pallet Elimination Trends

Push Pull Slip Sheets Market Analysis By End Use

The logistics segment is projected to lead the end-use sector with a 44.6% share in the push-pull slip sheets market by 2025, driven by rising demand for cost-effective, space-saving, and lightweight alternatives to traditional wooden or plastic pallets. Logistics providers-especially in FMCG, 3PL, and export-driven industries-are increasingly shifting toward slip sheet systems to optimize container utilization and reduce material handling costs.

Slip sheets enable seamless push-pull handling using forklift attachments, eliminating the need for bulky pallets while improving storage density in warehouses and shipping containers. This is particularly beneficial for high-frequency shipping operations, where space optimization translates directly into freight cost savings.

As global logistics networks become more digitized and efficiency-focused, the ability to integrate slip sheets into automated loading/unloading systems has become a key competitive advantage. Furthermore, leading logistics players are deploying recyclable and reusable slip sheets to meet clients’ sustainability targets and comply with international phytosanitary regulations that restrict wood packaging materials.

With e-commerce growth, SKU proliferation, and increasing demand for lean supply chain infrastructure, the logistics sector will continue to drive the largest volume and value uptake in the global push-pull slip sheets market.

Challenges and Opportunities

Challenges

Equipment Compatibility, Training Needs, and Limited Awareness in Developing Markets

These sheets need specialized forklifts with push-pull attachments, which not all warehouses or distribution centers have. That makes the question of adoption much more difficult, especially in cost-sensitive markets.

Proper operator training is critical to safe and effective handling of goods with slip sheets since improper use can lead to damage to cargo or equipment. Despite these advantages, broad implementation is hindered in developing economies due to lack of awareness and the preference for traditional wooden pallets.

Opportunities

Cost-Efficiency, Export Packaging Growth, and Sustainable Supply Chain Trends

Despite these challenges, the push-pull slip sheets market is projected to grow, driven by the increasing demand for lightweight, low-cost, and space-saving shipping solutions, especially in export-led industries such as food & beverages, chemicals, and consumer electronics. Slip sheets replace wooden pallets to reduce shipping weight, material cost, and storage space.

It is another example of how the global drive to achieve sustainable logistics is benefitting the market, with companies reducing their wood consumption, packaging waste and carbon footprint. Slip sheets are less environmentally damaging than traditional pallets, with items made of recyclable paperboard, corrugated fiberboard, or plastic.

They are also excellent when it comes to single-use, cross-border deliveries, especially in cases where returning pallets is not an option. Learn more about how the demand for interchangeable and recyclable unit load systems is expected to grow considerably as investments in automated warehouses and smart logistics infrastructure continue to grow.
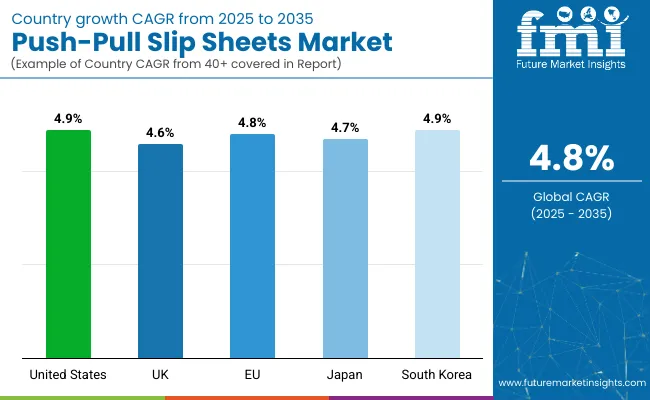
Country-Wise Outlook

Push Pull Slip Sheets Market Cagr Analysis By Country

United States

USA market expands companies aim to mitigate shipment weight and address space optimization in transport and export operations. Retailers, food manufacturers, and chemical producers use push-pull slip sheets in automated distribution centers instead of wooden pallets, they save money, and they go easy on the environment.

Country CAGR (2025 to 2035)
USA 4.9%

United Kingdom

Meanwhile, in the UK, the market is receiving a boost from growing investments in sustainable packing and smart warehousing solutions. As focus on eco-friendly exports grows and space in urban warehouses decreases, slip sheets can be utilized for the in-hand tight configuration of stackability and lightweight advantage it carries.

Country CAGR (2025 to 2035)
UK 4.6%

European Union

In the EU, the EU is expected to lead in regulations incorporating use of pallet alternatives to reduce emissions and wood dependency. Backed by strong circular economy policies, Germany, France, and the Netherlands are increasing adoption of recyclable slip sheets in retail, food export, and electronics shipping.

Region CAGR (2025 to 2035)
EU 4.8%

Japan

Push-pull slip sheets are being adopted in Japan's export-driven economy to support shipping efficiency and curb clutter in the warehouse. Interest in robot-compatible slip sheet systems, particularly for electronics or machinery shipping, is being propelled by the country’s emphasis on automation and robotics.

Country CAGR (2025 to 2035)
Japan 4.7%

South Korea

Semiconductors, Packaged Foods & Cosmetics Exports, South Korea is developing a high-growth market for slip sheets. Government initiatives to promote green logistics and smart manufacturing; and the positive economic impact (reduced costs and increased profits) of shift from wood pallets to recyclable slip sheets for industrial logistics help accelerate the transition.

Country CAGR (2025 to 2035)
South Korea 4.9%

Competitive Outlook

With increasing demand for pallet-free material handling, and rising emphasis on cost efficient shipping, as well as growing sustainability initiatives in logistics sector, the push-pull slip sheets market is expanding at a rapid pace.

High-strength fiberboard, anti-slip coatings, and moisture-resistant slip sheets compatible with push-pull forklift attachments are among the three new product areas companies are focusing on. It involves contributions from packaging manufacturers, supply chain solution providers, eco-material innovators, etc. Industry trends range from recyclable slip sheets and plastic-alternative fiber materials to AI-optimized load-stability engineering to enhance global logistics and automate warehouses.
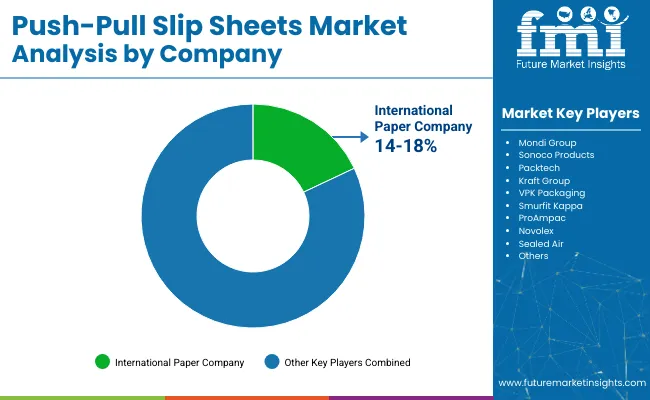
Key Companies

Push Pull Slip Sheets Market Analysis By Company

  • International Paper
  • Mondi Group
  • Sonoco Products
  • Packtech
  • Kraft Group
  • VPK Packaging
  • Smurfit Kappa
  • ProAmpac
  • Novolex
  • Sealed Air

Segmentation of push-pull slip sheet market

By Application:

  • Food Beverages
  • Pharmaceuticals
  • Consumer Goods
  • Textiles

By Material Type:

  • Plastic
  • Paper
  • Composite

By End Use:

  • Retail
  • Wholesale
  • Logistics
  • Manufacturing

By Product Type:

  • Single Use
  • Reusable

By Region:

  • North America
  • Europe
  • South America
  • Asia Pacific
  • Middle East and Africa

Table of Content

  1. Executive Summary
    • Global Market Outlook
    • Demand-side Trends
    • Supply-side Trends
    • Technology Roadmap Analysis
    • Analysis and Recommendations
  2. Market Overview
    • Market Coverage / Taxonomy
    • Market Definition / Scope / Limitations
  3. Market Background
    • Market Dynamics
      • Drivers
      • Restraints
      • Opportunity
      • Trends
    • Scenario Forecast
      • Demand in Optimistic Scenario
      • Demand in Likely Scenario
      • Demand in Conservative Scenario
    • Opportunity Map Analysis
    • Product Life Cycle Analysis
    • Supply Chain Analysis
      • Supply Side Participants and their Roles
        • Producers
        • Mid-Level Participants (Traders/ Agents/ Brokers)
        • Wholesalers and Distributors
      • Value Added and Value Created at Node in the Supply Chain
      • List of Raw Material Suppliers
      • List of Existing and Potential Buyer’s
    • Investment Feasibility Matrix
    • Value Chain Analysis
      • Profit Margin Analysis
      • Wholesalers and Distributors
      • Retailers
    • PESTLE and Porter’s Analysis
    • Regulatory Landscape
      • By Key Regions
      • By Key Countries
    • Regional Parent Market Outlook
    • Production and Consumption Statistics
    • Import and Export Statistics
  4. Global Market Analysis 2020 to 2024 and Forecast, 2025 to 2035
    • Historical Market Size Value (USD Million) & Volume (Units) Analysis, 2020 to 2024
    • Current and Future Market Size Value (USD Million) & Volume (Units) Projections, 2025 to 2035
      • Y-o-Y Growth Trend Analysis
      • Absolute $ Opportunity Analysis
  5. Global Market Pricing Analysis 2020 to 2024 and Forecast 2025 to 2035
  6. Global Market Analysis 2020 to 2024 and Forecast 2025 to 2035, By Material Type
    • Introduction / Key Findings
    • Historical Market Size Value (USD Million) & Volume (Units) Analysis By Material Type, 2020 to 2024
    • Current and Future Market Size Value (USD Million) & Volume (Units) Analysis and Forecast By Material Type, 2025 to 2035
      • Plastic
      • Paper
      • Composite
    • Y-o-Y Growth Trend Analysis By Material Type, 2020 to 2024
    • Absolute $ Opportunity Analysis By Material Type, 2025 to 2035
  7. Global Market Analysis 2020 to 2024 and Forecast 2025 to 2035, By Application
    • Introduction / Key Findings
    • Historical Market Size Value (USD Million) & Volume (Units) Analysis By Application, 2020 to 2024
    • Current and Future Market Size Value (USD Million) & Volume (Units) Analysis and Forecast By Application, 2025 to 2035
      • Food Beverages
      • Pharmaceuticals
      • Consumer Goods
      • Textiles
    • Y-o-Y Growth Trend Analysis By Application, 2020 to 2024
    • Absolute $ Opportunity Analysis By Application, 2025 to 2035
  8. Global Market Analysis 2020 to 2024 and Forecast 2025 to 2035, By End Use
    • Introduction / Key Findings
    • Historical Market Size Value (USD Million) & Volume (Units) Analysis By End Use, 2020 to 2024
    • Current and Future Market Size Value (USD Million) & Volume (Units) Analysis and Forecast By End Use, 2025 to 2035
      • Retail
      • Wholesale
      • Logistics
      • Manufacturing
    • Y-o-Y Growth Trend Analysis By End Use, 2020 to 2024
    • Absolute $ Opportunity Analysis By End Use, 2025 to 2035
  9. Global Market Analysis 2020 to 2024 and Forecast 2025 to 2035, By Product Type
    • Introduction / Key Findings
    • Historical Market Size Value (USD Million) & Volume (Units) Analysis By Product Type, 2020 to 2024
    • Current and Future Market Size Value (USD Million) & Volume (Units) Analysis and Forecast By Product Type, 2025 to 2035
      • Single Use
      • Reusable
    • Y-o-Y Growth Trend Analysis By Product Type, 2020 to 2024
    • Absolute $ Opportunity Analysis By Product Type, 2025 to 2035
  10. Global Market Analysis 2020 to 2024 and Forecast 2025 to 2035, By Region
    • Introduction
    • Historical Market Size Value (USD Million) & Volume (Units) Analysis By Region, 2020 to 2024
    • Current Market Size Value (USD Million) & Volume (Units) Analysis and Forecast By Region, 2025 to 2035
      • North America
      • Latin America
      • Europe
      • East Asia
      • South Asia
      • Oceania
      • MEA
    • Market Attractiveness Analysis By Region
  11. North America Market Analysis 2020 to 2024 and Forecast 2025 to 2035, By Country
    • Historical Market Size Value (USD Million) & Volume (Units) Trend Analysis By Market Taxonomy, 2020 to 2024
    • Market Size Value (USD Million) & Volume (Units) Forecast By Market Taxonomy, 2025 to 2035
      • By Country
        • USA
        • Canada
      • By Material Type
      • By Application
      • By End Use
      • By Product Type
    • Market Attractiveness Analysis
      • By Country
      • By Material Type
      • By Application
      • By End Use
      • By Product Type
    • Key Takeaways
  12. Latin America Market Analysis 2020 to 2024 and Forecast 2025 to 2035, By Country
    • Historical Market Size Value (USD Million) & Volume (Units) Trend Analysis By Market Taxonomy, 2020 to 2024
    • Market Size Value (USD Million) & Volume (Units) Forecast By Market Taxonomy, 2025 to 2035
      • By Country
        • Brazil
        • Mexico
        • Argentina
        • Chile
        • Peru
        • Rest of Latin America
      • By Material Type
      • By Application
      • By End Use
      • By Product Type
    • Market Attractiveness Analysis
      • By Country
      • By Material Type
      • By Application
      • By End Use
      • By Product Type
    • Key Takeaways
  13. Europe Market Analysis 2020 to 2024 and Forecast 2025 to 2035, By Country
    • Historical Market Size Value (USD Million) & Volume (Units) Trend Analysis By Market Taxonomy, 2020 to 2024
    • Market Size Value (USD Million) & Volume (Units) Forecast By Market Taxonomy, 2025 to 2035
      • By Country
        • Germany
        • Italy
        • France
        • UK
        • Spain
        • Russia
        • BENELUX
        • Rest of Europe
      • By Material Type
      • By Application
      • By End Use
      • By Product Type
    • Market Attractiveness Analysis
      • By Country
      • By Material Type
      • By Application
      • By End Use
      • By Product Type
    • Key Takeaways
  14. East Asia Market Analysis 2020 to 2024 and Forecast 2025 to 2035, By Country
    • Historical Market Size Value (USD Million) & Volume (Units) Trend Analysis By Market Taxonomy, 2020 to 2024
    • Market Size Value (USD Million) & Volume (Units) Forecast By Market Taxonomy, 2025 to 2035
      • By Country
        • China
        • Japan
        • South Korea
      • By Material Type
      • By Application
      • By End Use
      • By Product Type
    • Market Attractiveness Analysis
      • By Country
      • By Material Type
      • By Application
      • By End Use
      • By Product Type
    • Key Takeaways
  15. South Asia Market Analysis 2020 to 2024 and Forecast 2025 to 2035, By Country
    • Historical Market Size Value (USD Million) & Volume (Units) Trend Analysis By Market Taxonomy, 2020 to 2024
    • Market Size Value (USD Million) & Volume (Units) Forecast By Market Taxonomy, 2025 to 2035
      • By Country
        • India
        • Thailand
        • Malaysia
        • Indonesia
        • Rest of South Asia
      • By Material Type
      • By Application
      • By End Use
      • By Product Type
    • Market Attractiveness Analysis
      • By Country
      • By Material Type
      • By Application
      • By End Use
      • By Product Type
    • Key Takeaways
  16. Oceania Market Analysis 2020 to 2024 and Forecast 2025 to 2035, By Country
    • Historical Market Size Value (USD Million) & Volume (Units) Trend Analysis By Market Taxonomy, 2020 to 2024
    • Market Size Value (USD Million) & Volume (Units) Forecast By Market Taxonomy, 2025 to 2035
      • By Country
        • Australia
        • New Zealand
      • By Material Type
      • By Application
      • By End Use
      • By Product Type
    • Market Attractiveness Analysis
      • By Country
      • By Material Type
      • By Application
      • By End Use
      • By Product Type
    • Key Takeaways
  17. MEA Market Analysis 2020 to 2024 and Forecast 2025 to 2035, By Country
    • Historical Market Size Value (USD Million) & Volume (Units) Trend Analysis By Market Taxonomy, 2020 to 2024
    • Market Size Value (USD Million) & Volume (Units) Forecast By Market Taxonomy, 2025 to 2035
      • By Country
        • GCC
        • Rest of MEA
      • By Material Type
      • By Application
      • By End Use
      • By Product Type
    • Market Attractiveness Analysis
      • By Country
      • By Material Type
      • By Application
      • By End Use
      • By Product Type
    • Key Takeaways
  18. Key Countries Market Analysis
    • U.S.
      • Pricing Analysis
      • Market Share Analysis, 2024
        • By Material Type
        • By Application
        • By End Use
        • By Product Type
    • Canada
      • Pricing Analysis
      • Market Share Analysis, 2024
        • By Material Type
        • By Application
        • By End Use
        • By Product Type
    • Brazil
      • Pricing Analysis
      • Market Share Analysis, 2024
        • By Material Type
        • By Application
        • By End Use
        • By Product Type
    • Mexico
      • Pricing Analysis
      • Market Share Analysis, 2024
        • By Material Type
        • By Application
        • By End Use
        • By Product Type
    • Argentina
      • Pricing Analysis
      • Market Share Analysis, 2024
        • By Material Type
        • By Application
        • By End Use
        • By Product Type
  19. Market Structure Analysis
    • Competition Dashboard
    • Competition Benchmarking
    • Market Share Analysis of Top Players
      • By Regional
      • By Material Type
      • By Application
      • By End Use
      • By Product Type
  20. Competition Analysis
    • Competition Deep Dive
      • Mondi Group
        • Overview
        • Product Portfolio
        • Profitability by Market Segments (Product/Age /Sales Channel/Region)
        • Sales Footprint
        • Strategy Overview
          • Marketing Strategy
          • Product Strategy
          • Channel Strategy
      • Sonoco Products
        • Overview
        • Product Portfolio
        • Profitability by Market Segments (Product/Age /Sales Channel/Region)
        • Sales Footprint
        • Strategy Overview
          • Marketing Strategy
          • Product Strategy
          • Channel Strategy
      • Packtech
        • Overview
        • Product Portfolio
        • Profitability by Market Segments (Product/Age /Sales Channel/Region)
        • Sales Footprint
        • Strategy Overview
          • Marketing Strategy
          • Product Strategy
          • Channel Strategy
      • International Paper
        • Overview
        • Product Portfolio
        • Profitability by Market Segments (Product/Age /Sales Channel/Region)
        • Sales Footprint
        • Strategy Overview
          • Marketing Strategy
          • Product Strategy
          • Channel Strategy
      • Kraft Group
        • Overview
        • Product Portfolio
        • Profitability by Market Segments (Product/Age /Sales Channel/Region)
        • Sales Footprint
        • Strategy Overview
          • Marketing Strategy
          • Product Strategy
          • Channel Strategy
      • VPK Packaging
        • Overview
        • Product Portfolio
        • Profitability by Market Segments (Product/Age /Sales Channel/Region)
        • Sales Footprint
        • Strategy Overview
          • Marketing Strategy
          • Product Strategy
          • Channel Strategy
      • Smurfit Kappa
        • Overview
        • Product Portfolio
        • Profitability by Market Segments (Product/Age /Sales Channel/Region)
        • Sales Footprint
        • Strategy Overview
          • Marketing Strategy
          • Product Strategy
          • Channel Strategy
      • ProAmpac
        • Overview
        • Product Portfolio
        • Profitability by Market Segments (Product/Age /Sales Channel/Region)
        • Sales Footprint
        • Strategy Overview
          • Marketing Strategy
          • Product Strategy
          • Channel Strategy
      • Novolex
        • Overview
        • Product Portfolio
        • Profitability by Market Segments (Product/Age /Sales Channel/Region)
        • Sales Footprint
        • Strategy Overview
          • Marketing Strategy
          • Product Strategy
          • Channel Strategy
      • Sealed Air
        • Overview
        • Product Portfolio
        • Profitability by Market Segments (Product/Age /Sales Channel/Region)
        • Sales Footprint
        • Strategy Overview
          • Marketing Strategy
          • Product Strategy
          • Channel Strategy
  21. Assumptions & Acronyms Used
  22. Research Methodology

List of Tables

  • Table 1: Global Market Value (USD Million) Forecast by Region, 2020 to 2035
  • Table 2: Global Market Volume (Units) Forecast by Region, 2020 to 2035
  • Table 3: Global Market Value (USD Million) Forecast by Material Type, 2020 to 2035
  • Table 4: Global Market Volume (Units) Forecast by Material Type, 2020 to 2035
  • Table 5: Global Market Value (USD Million) Forecast by Application, 2020 to 2035
  • Table 6: Global Market Volume (Units) Forecast by Application, 2020 to 2035
  • Table 7: Global Market Value (USD Million) Forecast by End Use, 2020 to 2035
  • Table 8: Global Market Volume (Units) Forecast by End Use, 2020 to 2035
  • Table 9: Global Market Value (USD Million) Forecast by Product Type, 2020 to 2035
  • Table 10: Global Market Volume (Units) Forecast by Product Type, 2020 to 2035
  • Table 11: North America Market Value (USD Million) Forecast by Country, 2020 to 2035
  • Table 12: North America Market Volume (Units) Forecast by Country, 2020 to 2035
  • Table 13: North America Market Value (USD Million) Forecast by Material Type, 2020 to 2035
  • Table 14: North America Market Volume (Units) Forecast by Material Type, 2020 to 2035
  • Table 15: North America Market Value (USD Million) Forecast by Application, 2020 to 2035
  • Table 16: North America Market Volume (Units) Forecast by Application, 2020 to 2035
  • Table 17: North America Market Value (USD Million) Forecast by End Use, 2020 to 2035
  • Table 18: North America Market Volume (Units) Forecast by End Use, 2020 to 2035
  • Table 19: North America Market Value (USD Million) Forecast by Product Type, 2020 to 2035
  • Table 20: North America Market Volume (Units) Forecast by Product Type, 2020 to 2035
  • Table 21: Latin America Market Value (USD Million) Forecast by Country, 2020 to 2035
  • Table 22: Latin America Market Volume (Units) Forecast by Country, 2020 to 2035
  • Table 23: Latin America Market Value (USD Million) Forecast by Material Type, 2020 to 2035
  • Table 24: Latin America Market Volume (Units) Forecast by Material Type, 2020 to 2035
  • Table 25: Latin America Market Value (USD Million) Forecast by Application, 2020 to 2035
  • Table 26: Latin America Market Volume (Units) Forecast by Application, 2020 to 2035
  • Table 27: Latin America Market Value (USD Million) Forecast by End Use, 2020 to 2035
  • Table 28: Latin America Market Volume (Units) Forecast by End Use, 2020 to 2035
  • Table 29: Latin America Market Value (USD Million) Forecast by Product Type, 2020 to 2035
  • Table 30: Latin America Market Volume (Units) Forecast by Product Type, 2020 to 2035
  • Table 31: Europe Market Value (USD Million) Forecast by Country, 2020 to 2035
  • Table 32: Europe Market Volume (Units) Forecast by Country, 2020 to 2035
  • Table 33: Europe Market Value (USD Million) Forecast by Material Type, 2020 to 2035
  • Table 34: Europe Market Volume (Units) Forecast by Material Type, 2020 to 2035
  • Table 35: Europe Market Value (USD Million) Forecast by Application, 2020 to 2035
  • Table 36: Europe Market Volume (Units) Forecast by Application, 2020 to 2035
  • Table 37: Europe Market Value (USD Million) Forecast by End Use, 2020 to 2035
  • Table 38: Europe Market Volume (Units) Forecast by End Use, 2020 to 2035
  • Table 39: Europe Market Value (USD Million) Forecast by Product Type, 2020 to 2035
  • Table 40: Europe Market Volume (Units) Forecast by Product Type, 2020 to 2035
  • Table 41: East Asia Market Value (USD Million) Forecast by Country, 2020 to 2035
  • Table 42: East Asia Market Volume (Units) Forecast by Country, 2020 to 2035
  • Table 43: East Asia Market Value (USD Million) Forecast by Material Type, 2020 to 2035
  • Table 44: East Asia Market Volume (Units) Forecast by Material Type, 2020 to 2035
  • Table 45: East Asia Market Value (USD Million) Forecast by Application, 2020 to 2035
  • Table 46: East Asia Market Volume (Units) Forecast by Application, 2020 to 2035
  • Table 47: East Asia Market Value (USD Million) Forecast by End Use, 2020 to 2035
  • Table 48: East Asia Market Volume (Units) Forecast by End Use, 2020 to 2035
  • Table 49: East Asia Market Value (USD Million) Forecast by Product Type, 2020 to 2035
  • Table 50: East Asia Market Volume (Units) Forecast by Product Type, 2020 to 2035
  • Table 51: South Asia Market Value (USD Million) Forecast by Country, 2020 to 2035
  • Table 52: South Asia Market Volume (Units) Forecast by Country, 2020 to 2035
  • Table 53: South Asia Market Value (USD Million) Forecast by Material Type, 2020 to 2035
  • Table 54: South Asia Market Volume (Units) Forecast by Material Type, 2020 to 2035
  • Table 55: South Asia Market Value (USD Million) Forecast by Application, 2020 to 2035
  • Table 56: South Asia Market Volume (Units) Forecast by Application, 2020 to 2035
  • Table 57: South Asia Market Value (USD Million) Forecast by End Use, 2020 to 2035
  • Table 58: South Asia Market Volume (Units) Forecast by End Use, 2020 to 2035
  • Table 59: South Asia Market Value (USD Million) Forecast by Product Type, 2020 to 2035
  • Table 60: South Asia Market Volume (Units) Forecast by Product Type, 2020 to 2035
  • Table 61: Oceania Market Value (USD Million) Forecast by Country, 2020 to 2035
  • Table 62: Oceania Market Volume (Units) Forecast by Country, 2020 to 2035
  • Table 63: Oceania Market Value (USD Million) Forecast by Material Type, 2020 to 2035
  • Table 64: Oceania Market Volume (Units) Forecast by Material Type, 2020 to 2035
  • Table 65: Oceania Market Value (USD Million) Forecast by Application, 2020 to 2035
  • Table 66: Oceania Market Volume (Units) Forecast by Application, 2020 to 2035
  • Table 67: Oceania Market Value (USD Million) Forecast by End Use, 2020 to 2035
  • Table 68: Oceania Market Volume (Units) Forecast by End Use, 2020 to 2035
  • Table 69: Oceania Market Value (USD Million) Forecast by Product Type, 2020 to 2035
  • Table 70: Oceania Market Volume (Units) Forecast by Product Type, 2020 to 2035
  • Table 71: MEA Market Value (USD Million) Forecast by Country, 2020 to 2035
  • Table 72: MEA Market Volume (Units) Forecast by Country, 2020 to 2035
  • Table 73: MEA Market Value (USD Million) Forecast by Material Type, 2020 to 2035
  • Table 74: MEA Market Volume (Units) Forecast by Material Type, 2020 to 2035
  • Table 75: MEA Market Value (USD Million) Forecast by Application, 2020 to 2035
  • Table 76: MEA Market Volume (Units) Forecast by Application, 2020 to 2035
  • Table 77: MEA Market Value (USD Million) Forecast by End Use, 2020 to 2035
  • Table 78: MEA Market Volume (Units) Forecast by End Use, 2020 to 2035
  • Table 79: MEA Market Value (USD Million) Forecast by Product Type, 2020 to 2035
  • Table 80: MEA Market Volume (Units) Forecast by Product Type, 2020 to 2035

List of Figures

  • Figure 1: Global Market Volume (Units) Forecast 2020–2035
  • Figure 2: Global Market Pricing Analysis
  • Figure 3: Global Market Value (USD Million) Forecast 2020–2035
  • Figure 4: Global Market Value Share and BPS Analysis by Material Type, 2025 and 2035
  • Figure 5: Global Market Y-o-Y Growth Comparison by Material Type, 2025–2035
  • Figure 6: Global Market Attractiveness Analysis by Material Type
  • Figure 7: Global Market Value Share and BPS Analysis by Application, 2025 and 2035
  • Figure 8: Global Market Y-o-Y Growth Comparison by Application, 2025–2035
  • Figure 9: Global Market Attractiveness Analysis by Application
  • Figure 10: Global Market Value Share and BPS Analysis by End Use, 2025 and 2035
  • Figure 11: Global Market Y-o-Y Growth Comparison by End Use, 2025–2035
  • Figure 12: Global Market Attractiveness Analysis by End Use
  • Figure 13: Global Market Value Share and BPS Analysis by Product Type, 2025 and 2035
  • Figure 14: Global Market Y-o-Y Growth Comparison by Product Type, 2025–2035
  • Figure 15: Global Market Attractiveness Analysis by Product Type
  • Figure 16: Global Market Value (USD Million) Share and BPS Analysis by Region, 2025 and 2035
  • Figure 17: Global Market Y-o-Y Growth Comparison by Region, 2025–2035
  • Figure 18: Global Market Attractiveness Analysis by Region
  • Figure 19: North America Market Incremental $ Opportunity, 2025–2035
  • Figure 20: Latin America Market Incremental $ Opportunity, 2025–2035
  • Figure 21: Europe Market Incremental $ Opportunity, 2025–2035
  • Figure 22: East Asia Market Incremental $ Opportunity, 2025–2035
  • Figure 23: South Asia Market Incremental $ Opportunity, 2025–2035
  • Figure 24: Oceania Market Incremental $ Opportunity, 2025–2035
  • Figure 25: MEA Market Incremental $ Opportunity, 2025–2035
  • Figure 26: North America Market Value Share and BPS Analysis by Country, 2025 and 2035
  • Figure 27: North America Market Value Share and BPS Analysis by Material Type, 2025 and 2035
  • Figure 28: North America Market Y-o-Y Growth Comparison by Material Type, 2025–2035
  • Figure 29: North America Market Attractiveness Analysis by Material Type
  • Figure 30: North America Market Value Share and BPS Analysis by Application, 2025 and 2035
  • Figure 31: North America Market Y-o-Y Growth Comparison by Application, 2025–2035
  • Figure 32: North America Market Attractiveness Analysis by Application
  • Figure 33: North America Market Value Share and BPS Analysis by End Use, 2025 and 2035
  • Figure 34: North America Market Y-o-Y Growth Comparison by End Use, 2025–2035
  • Figure 35: North America Market Attractiveness Analysis by End Use
  • Figure 36: North America Market Value Share and BPS Analysis by Product Type, 2025 and 2035
  • Figure 37: North America Market Y-o-Y Growth Comparison by Product Type, 2025–2035
  • Figure 38: North America Market Attractiveness Analysis by Product Type
  • Figure 39: Latin America Market Value Share and BPS Analysis by Country, 2025 and 2035
  • Figure 40: Latin America Market Value Share and BPS Analysis by Material Type, 2025 and 2035
  • Figure 41: Latin America Market Y-o-Y Growth Comparison by Material Type, 2025–2035
  • Figure 42: Latin America Market Attractiveness Analysis by Material Type
  • Figure 43: Latin America Market Value Share and BPS Analysis by Application, 2025 and 2035
  • Figure 44: Latin America Market Y-o-Y Growth Comparison by Application, 2025–2035
  • Figure 45: Latin America Market Attractiveness Analysis by Application
  • Figure 46: Latin America Market Value Share and BPS Analysis by End Use, 2025 and 2035
  • Figure 47: Latin America Market Y-o-Y Growth Comparison by End Use, 2025–2035
  • Figure 48: Latin America Market Attractiveness Analysis by End Use
  • Figure 49: Latin America Market Value Share and BPS Analysis by Product Type, 2025 and 2035
  • Figure 50: Latin America Market Y-o-Y Growth Comparison by Product Type, 2025–2035
  • Figure 51: Latin America Market Attractiveness Analysis by Product Type
  • Figure 52: Europe Market Value Share and BPS Analysis by Country, 2025 and 2035
  • Figure 53: Europe Market Value Share and BPS Analysis by Material Type, 2025 and 2035
  • Figure 54: Europe Market Y-o-Y Growth Comparison by Material Type, 2025–2035
  • Figure 55: Europe Market Attractiveness Analysis by Material Type
  • Figure 56: Europe Market Value Share and BPS Analysis by Application, 2025 and 2035
  • Figure 57: Europe Market Y-o-Y Growth Comparison by Application, 2025–2035
  • Figure 58: Europe Market Attractiveness Analysis by Application
  • Figure 59: Europe Market Value Share and BPS Analysis by End Use, 2025 and 2035
  • Figure 60: Europe Market Y-o-Y Growth Comparison by End Use, 2025–2035
  • Figure 61: Europe Market Attractiveness Analysis by End Use
  • Figure 62: Europe Market Value Share and BPS Analysis by Product Type, 2025 and 2035
  • Figure 63: Europe Market Y-o-Y Growth Comparison by Product Type, 2025–2035
  • Figure 64: Europe Market Attractiveness Analysis by Product Type
  • Figure 65: East Asia Market Value Share and BPS Analysis by Country, 2025 and 2035
  • Figure 66: East Asia Market Value Share and BPS Analysis by Material Type, 2025 and 2035
  • Figure 67: East Asia Market Y-o-Y Growth Comparison by Material Type, 2025–2035
  • Figure 68: East Asia Market Attractiveness Analysis by Material Type
  • Figure 69: East Asia Market Value Share and BPS Analysis by Application, 2025 and 2035
  • Figure 70: East Asia Market Y-o-Y Growth Comparison by Application, 2025–2035
  • Figure 71: East Asia Market Attractiveness Analysis by Application
  • Figure 72: East Asia Market Value Share and BPS Analysis by End Use, 2025 and 2035
  • Figure 73: East Asia Market Y-o-Y Growth Comparison by End Use, 2025–2035
  • Figure 74: East Asia Market Attractiveness Analysis by End Use
  • Figure 75: East Asia Market Value Share and BPS Analysis by Product Type, 2025 and 2035
  • Figure 76: East Asia Market Y-o-Y Growth Comparison by Product Type, 2025–2035
  • Figure 77: East Asia Market Attractiveness Analysis by Product Type
  • Figure 78: South Asia Market Value Share and BPS Analysis by Country, 2025 and 2035
  • Figure 79: South Asia Market Value Share and BPS Analysis by Material Type, 2025 and 2035
  • Figure 80: South Asia Market Y-o-Y Growth Comparison by Material Type, 2025–2035
  • Figure 81: South Asia Market Attractiveness Analysis by Material Type
  • Figure 82: South Asia Market Value Share and BPS Analysis by Application, 2025 and 2035
  • Figure 83: South Asia Market Y-o-Y Growth Comparison by Application, 2025–2035
  • Figure 84: South Asia Market Attractiveness Analysis by Application
  • Figure 85: South Asia Market Value Share and BPS Analysis by End Use, 2025 and 2035
  • Figure 86: South Asia Market Y-o-Y Growth Comparison by End Use, 2025–2035
  • Figure 87: South Asia Market Attractiveness Analysis by End Use
  • Figure 88: South Asia Market Value Share and BPS Analysis by Product Type, 2025 and 2035
  • Figure 89: South Asia Market Y-o-Y Growth Comparison by Product Type, 2025–2035
  • Figure 90: South Asia Market Attractiveness Analysis by Product Type
  • Figure 91: Oceania Market Value Share and BPS Analysis by Country, 2025 and 2035
  • Figure 92: Oceania Market Value Share and BPS Analysis by Material Type, 2025 and 2035
  • Figure 93: Oceania Market Y-o-Y Growth Comparison by Material Type, 2025–2035
  • Figure 94: Oceania Market Attractiveness Analysis by Material Type
  • Figure 95: Oceania Market Value Share and BPS Analysis by Application, 2025 and 2035
  • Figure 96: Oceania Market Y-o-Y Growth Comparison by Application, 2025–2035
  • Figure 97: Oceania Market Attractiveness Analysis by Application
  • Figure 98: Oceania Market Value Share and BPS Analysis by End Use, 2025 and 2035
  • Figure 99: Oceania Market Y-o-Y Growth Comparison by End Use, 2025–2035
  • Figure 100: Oceania Market Attractiveness Analysis by End Use
  • Figure 101: Oceania Market Value Share and BPS Analysis by Product Type, 2025 and 2035
  • Figure 102: Oceania Market Y-o-Y Growth Comparison by Product Type, 2025–2035
  • Figure 103: Oceania Market Attractiveness Analysis by Product Type
  • Figure 104: MEA Market Value Share and BPS Analysis by Country, 2025 and 2035
  • Figure 105: MEA Market Value Share and BPS Analysis by Material Type, 2025 and 2035
  • Figure 106: MEA Market Y-o-Y Growth Comparison by Material Type, 2025–2035
  • Figure 107: MEA Market Attractiveness Analysis by Material Type
  • Figure 108: MEA Market Value Share and BPS Analysis by Application, 2025 and 2035
  • Figure 109: MEA Market Y-o-Y Growth Comparison by Application, 2025–2035
  • Figure 110: MEA Market Attractiveness Analysis by Application
  • Figure 111: MEA Market Value Share and BPS Analysis by End Use, 2025 and 2035
  • Figure 112: MEA Market Y-o-Y Growth Comparison by End Use, 2025–2035
  • Figure 113: MEA Market Attractiveness Analysis by End Use
  • Figure 114: MEA Market Value Share and BPS Analysis by Product Type, 2025 and 2035
  • Figure 115: MEA Market Y-o-Y Growth Comparison by Product Type, 2025–2035
  • Figure 116: MEA Market Attractiveness Analysis by Product Type
  • Figure 117: Global Market – Tier Structure Analysis
  • Figure 118: Global Market – Company Share Analysis

Frequently Asked Questions

What was the overall size of the push-pull slip sheets market in 2025?

The overall market size for the push-pull slip sheets market was USD 1.2 billion in 2025.

How big is the push-pull slip sheets market expected to be in 2035?

The push-pull slip sheets market is expected to reach USD 1.9 billion in 2035.

What will drive the demand for the push-pull slip sheets market during the forecast period?

The demand for push-pull slip sheets is rising due to increasing preference for lightweight, cost-effective, and eco-friendly alternatives to wooden pallets in material handling. Growth in global exports and the expanding logistics needs of the personal care, home care, and food & beverage sectors are further driving market growth.

List the top 5 countries contributing to the push-pull slip sheets market.

The top 5 countries driving the development of the push-pull slip sheets market are the USA, China, Germany, India, and Japan.

Which segment in the end-use industry is expected to lead in the push-pull slip sheets market?

Personal Care & Home Care and Food & Beverages are expected to command a significant share over the assessment period.

Explore Similar Insights

Future Market Insights

Push-pull Slip Sheets Market