Tarpaulin Sheets Market
Tarpaulin Sheets Market By Product Type, Material, Product Weight, Lamination Type, End Use & Region | Forecast 2023 to 2033
Tarpaulin Sheets- Lightweight, Water-resistant, and Easy to Handle Solutions Helping Industries across the USA, France, Italy, Japan, Korea, the United Kingdom, and 30+ Countries to Protect and Safeguard their Products! Get Deeper Insights with FMI's New Report
Tarpaulin Sheets Market Outlook (2023 to 2033)
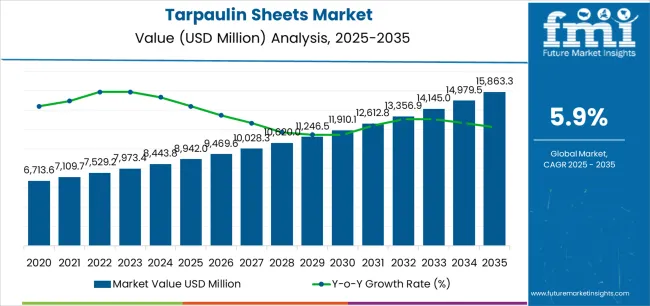
The global tarpaulin sheets market size is forecast to increase from US$ 8.1 billion in 2023 to US$ 13.0 billion by the end of 2033. Overall tarpaulin sheet sales are forecast to accelerate at a CAGR of 4.7% between 2023 and 2033.
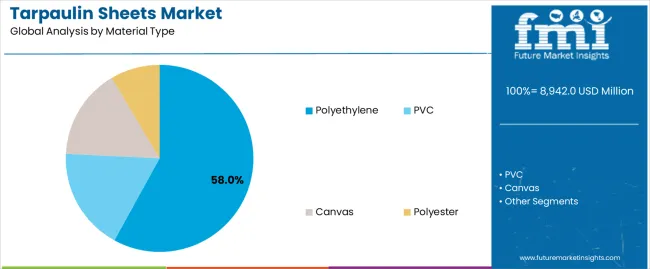
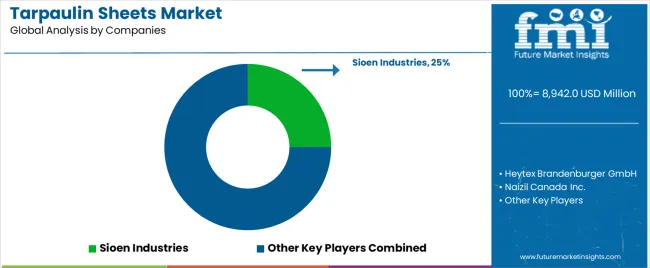
Growing demand for tarpaulin sheets from agriculture, building & construction, logistics, consumer goods, and automotive industries is a prominent factor driving the global market. The top 5 tarpaulin sheet companies are slated to hold around 20 to 25% of the market in 2023. By material, polyethylene is forecast to create an incremental opportunity of US$ 2.3 Billion during the projection period of 2023 to 2033.
With growing usage across the agriculture and building industries, the global market for tarpaulin sheets is set to expand 1.7X times the current market value during the assessment period. Tarpaulin sheets are large sheets of strong, flexible, and water-resistant material used to protect from extreme weather conditions such as wind, sunlight, and rain.
These sheets make it simple to transport products or goods while providing excellent levels of safety and protection. The increasing adoption of tarpaulin sheets for protecting a wide range of products from the weather is anticipated to play a crucial role in facilitating market expansion.
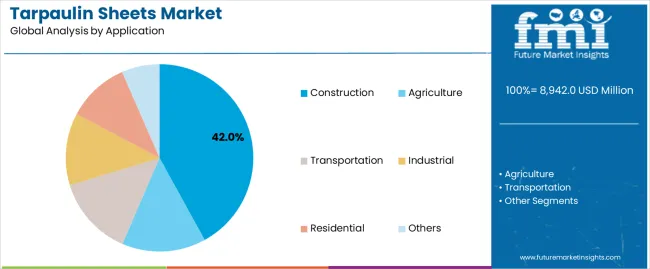
Rising applications of tarpaulin sheets across the thriving building & construction sector are expected to boost the global market during the assessment period. Tarpaulin sheets are being increasingly used during construction activities to protect partially built structures, prevent mess during painting, and contain debris.
Similarly, the robust growth of the agriculture industry coupled with the growing need for protecting crops and agricultural equipment from harsh weather conditions will boost tarpaulin sheet sales.
Leading tarpaulin sheet manufacturers are aiming at developing sustainable and recyclable tarpaulin sheets to reduce environmental pollution and comply with stringent regulations. This will bode well for the market
Attributes | Key Insights |
---|---|
Tarpaulin Sheets Market Estimated Size (2023) | US$ 8.1 billion |
Projected Market Size (2033) | US$ 13.0 billion |
Value-based CAGR (2023 to 2033) | 4.7% |
Collective Value Share: Top 3 Countries (2023E) | 35 to 40% |
Don't pay for what you don't need
Customize your report by selecting specific countries or regions and save 30%!
2015 to 2022 Tarpaulin Sheets Market Outlook Compared to Sales Forecast for 2023 to 2033
The global market for tarpaulin sheets witnessed a CAGR of 4.1% during the historic period and attained a valuation of around US$ 7.9 billion at the end of 2022. Between 2023 and 2033, the market is set to expand at 4.7% CAGR as per Future Market Insights’ latest analysis.
Growing usage of tarpaulin sheets across diverse industries due to their high strength, lightweight, and cost-effective features is proving impetus for the development of the global market.
Tarpaulin sheets are used for the protection of cargo across various industries including construction, agriculture, etc. Hence, the expansion of these industries will eventually boost tarpaulin sheet sales over the projection period
Tarpaulin sheets possess water-resistant properties and extraordinary strength. As a result, they help industries to protect a wide range of products from external weather conditions during storage and transportation.
The growing need for protecting products or equipment for a long time from the changing weather conditions is expected to elevate tarpaulin sheets demand over the next ten years.
Besides this, the growing usage of tarpaulin sheets by farmers to protect their crops/produce from extreme weather conditions and pests will create lucrative growth opportunities for tarpaulin sheet manufacturers.
H1-H2 Update
Market Statistics | Details |
---|---|
Jan to Jun (H1), 2021 (A) | 3.3% |
Jul to Dec (H2), 2022 (A) | 3.9% |
Jan to Jun (H1), 2022 Projected (P) | 3.1% |
Jan to Jun (H1), 2022 Outlook (O) | 3.7% |
Jul to Dec (H2), 2022 Outlook (O) | 4.4% |
Jul to Dec (H2), 2022 Projected (P) | 4.0% |
Jan to Jun (H1), 2023 Projected (P) | 4.3% |
BPS Change : H1,2022 (O) to H1,2022 (P) | 60 ↑ |
BPS Change : H1,2022 (O) to H1,2021 (A) | 40 ↑ |
BPS Change: H2, 2022 (O) to H2, 2022 (P) | 40 ↑ |
BPS Change: H2, 2022 (O) to H2, 2022 (A) | 50 ↑ |
Which Factors are Influencing Tarpaulin Sheets Demand?
Attractive Characteristics of Tarpaulin Sheets Escalating Demand in the Market
Tarpaulin sheets are an outstanding source of protection and safeguarding for companies to protect their product/goods. These sheets are made from materials such as polyethylene, canvas, polyvinyl chloride, polyethylene terephthalate, and polyamide.
Polyethylene tarpaulin sheets are generally produced from high-density polyethylene (HDPE) which has excellent hardness, high-temperature and chemical resistance, and excellent mechanical strength.
However, in recent years tarpaulin sheets made from polyvinyl chloride (PVC) have gained wider popularity due to their various attractive benefits. Poly Vinyl Chloride (PVC) tarpaulin sheets are made from polyester filament base fabric and coated with PVC resin on both sides of the sheet.
PVC-coated tarpaulin has excellent rain resistance when compared to polypropylene (PP) and PE tarpaulin sheets. Along with the coating of PVC resin, the tarpaulin sheets are also treated with anti-fungal and antistatic agents to enhance their properties.
Hence, growing awareness about the attractive features of tarpaulin sheets will elevate demand in the global market during the assessment period.
Comparative View of Adjacent Tarpaulin Sheets Market
Tarpaulin Sheets Market:
Attributes | Tarpaulin Sheets Industry |
---|---|
CAGR (2023 to 2033) | 4.7% |
Market Value (2023) | US$ 8.1 billion |
Growth Factor | The growing adoption of tarpaulin sheets across various industries for protection and safeguarding products will continue to boost the global market. |
Key Trend | The development of sustainable and recyclable tarpaulin sheets will boost sales over the next ten years. |
Plastic Corrugated Sheets Market:
Attributes | Plastic Corrugated Sheets Market |
---|---|
CAGR (2023 to 2033) | 6.4% |
Market Value (2023) | US$ 1.5 billion |
Growth Factor | The rapid expansion of industries such as packaging and building & construction is a key factor driving the global plastic corrugated sheets market forward. |
Key Trend | Rising preference for recyclable packaging along with the rapid expansion of the e-commerce sector will boost plastic corrugated sheet sales. |
Slip Sheets Market:
Attributes | Slip Sheets Market |
---|---|
CAGR (2023 to 2033) | 4.9% |
Market Value (2023) | US$ 980.2 million |
Growth Factor | The growing usage of slip sheets as an ideal alternative for pallets during packaging for protecting goods during the transportation is a key factor driving the global market forward. |
Key Trend | The rising e-commerce sector and high demand for kraft paperboard will drive up slip sheet sales during the next ten years. |
Get the data you need at a Fraction of the cost
Personalize your report by choosing insights you need
and save 40%!
Country-wise Insights
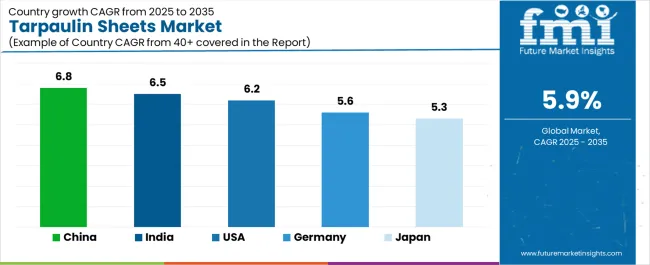
Country | USA |
---|---|
Market Share(in 2023) | 14.6% |
Market Share(in 2033) | 12.2% |
Basis Points (BPS) Analysis | -250 |
Country | China |
---|---|
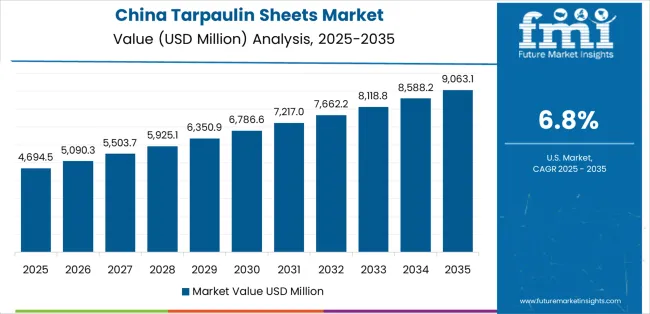
Market Share(in 2023) | 27.5% |
Market Share(in 2033) | 27.2% |
Basis Points (BPS) Analysis | -30 |
Country | India |
---|---|
Market Share(in 2023) | 7.3% |
Market Share(in 2033) | 8.3% |
Basis Points (BPS) Analysis | 100 |
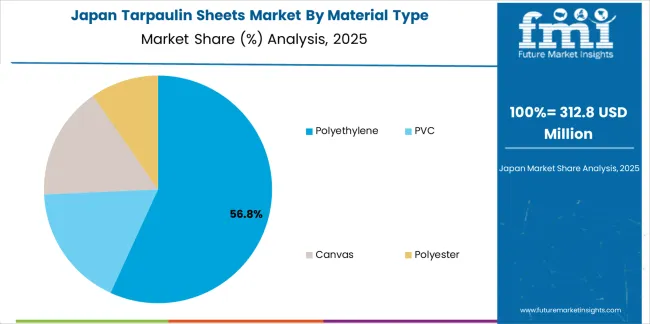
Country | Japan |
---|---|
Market Share(in 2023) | 2.4% |
Market Share(in 2033) | 2.2% |
Basis Points (BPS) Analysis | -20 |
Country | Germany |
---|---|
Market Share(in 2023) | 4.2% |
Market Share(in 2033) | 3.2% |
Basis Points (BPS) Analysis | -100 |
What is the Demand Outlook for Tarpaulin Sheets Market in India?
According to Future Market Insight, India’s tarpaulin sheets market is anticipated to progress at a CAGR of 7.5% during the forecast period from 2023 to 2033. Demand for tarpaulin sheets across India is driven by the rapid expansion of the agriculture industry.
India is an agrarian country with agriculture and related sectors such as fisheries and forestry accounting for around 20.2% of the country’s GDP as per the International Trade Administration. A large portion of the Indian population relies on agriculture to earn a living. This in turn generates high demand for tarpaulin sheets as they are increasingly used for protecting and safeguarding crops and agricultural machinery.
Besides agriculture, the building and construction sector is also increasing with the rapid increase in the population rate in the country which will act as a growth factor for the tarpaulin sheets.
Why is the United Kingdom Emerging as the Most Lucrative Market for Tarpaulin Sheets?
Easy Availability of Raw Materials and Strong Presence of Leading Players Making the United Kingdom a Lucrative Market
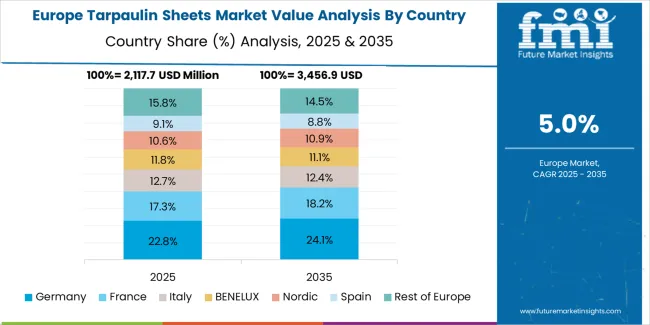
The United Kingdom is expected to remain a leading market for tarpaulin sheets during the next decade. It is anticipated to hold a 22% market share of the global market over the forecast period. Growth in the market is driven by rising plastic production, the strong presence of leading companies, and booming agriculture, logistics, and building industries.
As per PlasticsEurope, a European Trade Association, total plastic production in European countries reached 61.8 million tons in 2018. The United Kingdom holds a prominent share in plastic production due to the presence of strong and well-established key players.
Increasing production of plastic is expected to create exponential growth opportunities for tarpaulin sheet manufacturers during the forthcoming decade. Therefore, the United Kingdom market is estimated to create significant revenue-generating opportunities during the forecast period.
Similarly, the growing popularity of UV-protected tarpaulin sheets and the development of sustainable packaging solutions will bode well for the market.
Category-wise Insights
Which Lamination Type will be the Most Preferred for Tarpaulin Sheets?
3 Layers of Laminate Tarpaulin Sheets Remain Highly Sought-After
Based on lamination type, the global market is segmented into up to 2 layers, 3 layers of laminate, 4 layers of laminate, and above 4 layers. Among these, the 3 layers laminate tarpaulin sheets segment is expected to hold around 46% value share in the global tarpaulin sheets industry during the forecast period.
This growth is due to the rising demand for 3 layers of tarpaulin sheets owing to their increasing application in the transportation of goods or products, especially in the transport of cargo goods and products.
Why is Demand for 300 to 600 GSM Weighed Tarpaulin Sheets Rising in the Market?
Rising Applications of 300 to 600 GSM Tarpaulin Sheets Due to Their Strong Nature Fueling Demand
Based on product weight, the 300 to 600 GSM tarpaulin sheets segment is expected to expand at a significant pace during the projection period. This is attributed to the rising adoption of 300 to 600 GSM tarpaulin sheets across diverse industries.
300 to 600 GSM tarpaulin sheets are very strong and durable in nature and protect the goods or products safely from heavy rain and wind. They are used in various applications such as the protection of crops or agricultural produce, covering an entire football field, etc. Also, they are easy to carry and more convenient than several other types.
The robust protection characteristics along with the ease of handling are expected to increase the popularity of 300 to 600 GSM tarpaulin sheets during the projection period.
Competitive Landscape
Key manufacturers of the tarpaulin sheets market are focusing on introducing novel products made from eco-friendly materials to expand their customer base. Besides this, they are employing strategies such as mergers, partnerships, acquisitions, facility expansions, and strengthening distribution channels to stay relevant in the market. For instance,
- In 2019, to expand its PVC converting business, NHK Group acquired the Finnish Tarpaulin Team.
Scope of the Report
Attribute | Details |
---|---|
Estimated Market Value (2023) | US$ 8.1 billion |
Projected Market Value (2033) | US$ 13.0 billion |
Anticipated Growth Rate (2023 to 2033) | 4.7% CAGR |
Historical Data | 2015 to 2022 |
Forecast Period | 2023 to 2033 |
Quantitative Units | Revenue in US$ billion, Volume in Tonnes, and CAGR from 2023 to 2033 |
Segments Covered |
|
Regions Covered |
|
Key Countries Covered |
|
Key Companies Profiled |
|
Report Coverage | Revenue Forecast, Volume Forecast, Company Ranking, Competitive Landscape, Growth Factors, Trends, and Pricing Analysis |
Tarpaulin Sheets Market by Category
By Product Type:
- Insulated Tarps
- Hoarding Tarps
- Truck Tarps
- UV Protected Tarps
- Sports Tarps
- Mesh Tarps
- Others
By Material:
- Polyethylene (PE)
- Poly Vinyl Chloride (PVC)
- Poly Ethylene Terephthalate (PET)
- Polyamide (PA)
- Canvas
By Product Weight:
- Less than 100 GSM
- Between 100 to 300 GSM
- Between 300 to 600 GSM
- Above 600 GSM
By Lamination Type:
- Up to 2 Layers
- 3 Layers Laminate
- 4 Layers Laminate
- Above 4 Layers
By End Use:
- Agriculture
- Building & Construction
- Automobiles
- Storage, Warehousing & Logistics
- Consumer Goods
- Others
By Region:
- North America
- Latin America
- East Asia
- South Asia & Pacific
- Western Europe
- Eastern Europe
- Central Asia
- Russia & Belarus
- Balkan Countries
- Baltic Countries
- Middle East and Africa (MEA)
Frequently Asked Questions
What is the CAGR for Tarapaulin Sheets Market expansion?
Through 2033, the market is projected to develop at a CAGR of 4.7%.
What is the estimated size of the Tarapaulin Sheets Market in 2033?
By 2033, the industry is to have expanded to US$ 13 billion.
What does the Tarapaulin Sheets Market currently bear?
In 2023, the market to reach a worth of US$ 8.1 billion.
What was the market's overall CAGR?
The global market rose at an CAGR of 4.1% from 2018 to 2022.
What is the market share in the United States?
The United States market is set to acquire 12.2% market share.
Table of Content
1. Executive Summary | Tarpaulin Sheets Market 1.1. Global Market Outlook 1.2. Demand-side Trends 1.3. Supply-side Trends 1.4. Lamination Type Roadmap Analysis 1.5. Analysis and Recommendations 2. Market Overview 2.1. Market Coverage / Taxonomy 2.2. Market Definition / Scope / Limitations 3. Market Background 3.1. Market Dynamics 3.1.1. Drivers 3.1.2. Restraints 3.1.3. Opportunity 3.1.4. Trends 3.2. Cased-based Scenario 3.2.1. Demand in Optimistic Scenario 3.2.2. Demand in Likely Scenario 3.2.3. Demand in Conservative Scenario 3.3. Macro Factors and Forecast Factors 3.4. Value Chain Analysis 3.4.1. Profit Margin Analysis 3.4.2. Raw Material Suppliers 3.4.3. Manufacturers, Wholesalers and Distributors 3.4.4. End-user/ Customers 3.5. Regional Parent Market Outlook 3.6. Production and Consumption Statistics 3.7. Global Average Pricing Analysis Benchmark 4. Global Market Analysis 2015 to 2022 and Forecast 2023 to 2033 4.1. Historical Market Size Value (US$ Million) & Volume (Tonnes) Analysis, 2015 to 2022 4.2. Current and Future Market Size Value (US$ Million) & Volume (Tonnes) Projections, 2023 to 2033 4.2.1. Y-o-Y Growth Trend Analysis 4.2.2. Absolute $ Opportunity Analysis 5. Global Market Analysis 2015 to 2022 and Forecast 2023 to 2033, By Product Type 5.1. Introduction / Key Findings 5.2. Historical Market Size Value (US$ Million) & Volume (Tonnes) Analysis by Product Type, 2015 to 2022 5.3. Current and Future Market Size Value (US$ Million) & Volume (Tonnes) Analysis and Forecast by Product Type, 2023 to 2033 5.3.1. Insulated Tarps 5.3.2. Hoarding Tarps 5.3.3. Truck Tarps 5.3.4. UV Protected Tarps 5.3.5. Sports Tarps 5.3.6. Mesh Tarps 5.3.7. Others 5.4. Y-o-Y Growth Trend Analysis by Product Type, 2015 to 2022 5.5. Absolute $ Opportunity Analysis by Product Type, 2023 to 2033 6. Global Market Analysis 2015 to 2022 and Forecast 2023 to 2033, By Material 6.1. Introduction / Key Findings 6.2. Historical Market Size Value (US$ Million) & Volume (Tonnes) Analysis By Material, 2015 to 2022 6.3. Current and Future Market Size Value (US$ Million) & Volume (Tonnes) Analysis and Forecast By Material, 2023 to 2033 6.3.1. Polyethylene (PE) 6.3.2. Poly Vinyl Chloride (PVC) 6.3.3. Poly Ethylene Terephthalate (PET) 6.3.4. Polyamide (PA) 6.3.5. Canvas 6.4. Y-o-Y Growth Trend Analysis By Material, 2015 to 2022 6.5. Absolute $ Opportunity Analysis By Material, 2023 to 2033 7. Global Market Analysis 2015 to 2022 and Forecast 2023 to 2033, By Lamination Type 7.1. Introduction / Key Findings 7.2. Historical Market Size Value (US$ Million) & Volume (Tonnes) Analysis By Lamination Type, 2015 to 2022 7.3. Current and Future Market Size Value (US$ Million) & Volume (Tonnes) Analysis and Forecast By Lamination Type, 2023 to 2033 7.3.1. Up to 2 Layers 7.3.2. 3 Layers Laminate 7.3.3. 4 Layers Laminate 7.3.4. Above 4 Layers 7.4. Y-o-Y Growth Trend Analysis By Lamination Type, 2015 to 2022 7.5. Absolute $ Opportunity Analysis By Lamination Type, 2023 to 2033 8. Global Market Analysis 2015 to 2022 and Forecast 2023 to 2033, By Product Weight 8.1. Introduction / Key Findings 8.2. Historical Market Size Value (US$ Million) & Volume (Tonnes) Analysis By Lamination Type, 2015 to 2022 8.3. Current and Future Market Size Value (US$ Million) & Volume (Tonnes) Analysis and Forecast By Lamination Type, 2023 to 2033 8.3.1. Less than 100 GSM 8.3.2. Between 100 to 300 GSM 8.3.3. Between 300 to 600 GSM 8.3.4. Above 600 GSM 8.4. Y-o-Y Growth Trend Analysis By Lamination Type, 2015 to 2022 8.5. Absolute $ Opportunity Analysis By Lamination Type, 2023 to 2033 9. Global Market Analysis 2015 to 2022 and Forecast 2023 to 2033, by End Use 9.1. Introduction / Key Findings 9.2. Historical Market Size Value (US$ Million) & Volume (Tonnes) Analysis By Lamination Type, 2015 to 2022 9.3. Current and Future Market Size Value (US$ Million) & Volume (Tonnes) Analysis and Forecast By Lamination Type, 2023 to 2033 9.3.1. Agriculture 9.3.2. Building & Construction 9.3.3. Automobiles 9.3.4. Storage, Warehousing & Logistics 9.3.5. Consumer Goods 9.3.6. Others 9.4. Y-o-Y Growth Trend Analysis By Lamination Type, 2015 to 2022 9.5. Absolute $ Opportunity Analysis By Lamination Type, 2023 to 2033 10. Global Market Analysis 2015 to 2022 and Forecast 2023 to 2033, by Region 10.1. Introduction / Key Findings 10.2. Historical Market Size Value (US$ Million) & Volume (Tonnes) Analysis by Region, 2015 to 2022 10.3. Current and Future Market Size Value (US$ Million) & Volume (Tonnes) Analysis and Forecast by Region, 2023 to 2033 10.3.1. North America 10.3.2. Latin America 10.3.3. East Asia 10.3.4. South Asia & Pacific 10.3.5. Western Europe 10.3.6. Eastern Europe 10.3.7. Central Asia 10.3.8. Russia & Belarus 10.3.9. Balkan Countries 10.3.10. Baltic Countries 10.3.11. Middle East and Africa (Middle East & Africa) 10.4. Market Attractiveness Analysis, by Region 11. North America Market Analysis 2015 to 2022 and Forecast 2023 to 2033, By Country 11.1. Historical Market Size Value (US$ Million) & Volume (Tonnes) Trend Analysis by Market Taxonomy, 2015 to 2022 11.2. Market Size Value (US$ Million) & Volume (Tonnes) Forecast by Market Taxonomy, 2023 to 2033 11.2.1. By Country 11.2.1.1. USA 11.2.1.2. Canada 11.2.2. By Product Type 11.2.3. By Material 11.2.4. By Lamination Type 11.2.5. By Product Weight 11.2.6. by End Use 11.3. Market Attractiveness Analysis 11.3.1. By Country 11.3.2. By Product Type 11.3.3. By Material 11.3.4. By Lamination Type 11.3.5. By Product Weight 11.3.6. by End Use 11.4. Key Takeaways 12. Latin America Market Analysis 2015 to 2022 and Forecast 2023 to 2033, By Country 12.1. Historical Market Size Value (US$ Million) & Volume (Tonnes) Trend Analysis by Market Taxonomy, 2015 to 2022 12.2. Market Size Value (US$ Million) & Volume (Tonnes) Forecast by Market Taxonomy, 2023 to 2033 12.2.1. By Country 12.2.1.1. Brazil 12.2.1.2. Mexico 12.2.1.3. Argentina 12.2.1.4. Rest of Latin America 12.2.2. By Product Type 12.2.3. By Material 12.2.4. By Lamination Type 12.2.5. By Product Weight 12.2.6. by End Use 12.3. Market Attractiveness Analysis 12.3.1. By Country 12.3.2. By Product Type 12.3.3. By Material 12.3.4. By Lamination Type 12.3.5. By Product Weight 12.3.6. by End Use 12.4. Key Takeaways 13. East Asia Market Analysis 2015 to 2022 and Forecast 2023 to 2033, By Country 13.1. Historical Market Size Value (US$ Million) & Volume (Tonnes) Trend Analysis by Market Taxonomy, 2015 to 2022 13.2. Market Size Value (US$ Million) & Volume (Tonnes) Forecast by Market Taxonomy, 2023 to 2033 13.2.1. By Country 13.2.1.1. China 13.2.1.2. Japan 13.2.1.3. South Korea 13.2.2. By Product Type 13.2.3. By Material 13.2.4. By Lamination Type 13.2.5. By Product Weight 13.2.6. by End Use 13.3. Market Attractiveness Analysis 13.3.1. By Country 13.3.2. By Product Type 13.3.3. By Material 13.3.4. By Lamination Type 13.3.5. By Product Weight 13.3.6. by End Use 13.4. Key Takeaways 14. South Asia & Pacific Market Analysis 2015 to 2022 and Forecast 2023 to 2033, By Country 14.1. Historical Market Size Value (US$ Million) & Volume (Tonnes) Trend Analysis by Market Taxonomy, 2015 to 2022 14.2. Market Size Value (US$ Million) & Volume (Tonnes) Forecast by Market Taxonomy, 2023 to 2033 14.2.1. By Country 14.2.1.1. India 14.2.1.2. ASEAN 14.2.1.3. Australia & New Zealand 14.2.2. By Product Type 14.2.3. By Material 14.2.4. By Lamination Type 14.2.5. By Product Weight 14.2.6. by End Use 14.3. Market Attractiveness Analysis 14.3.1. By Country 14.3.2. By Product Type 14.3.3. By Material 14.3.4. By Lamination Type 14.3.5. By Product Weight 14.3.6. by End Use 14.4. Key Takeaways 15. Western Europe Market Analysis 2015 to 2022 and Forecast 2023 to 2033, By Country 15.1. Historical Market Size Value (US$ Million) & Volume (Tonnes) Trend Analysis by Market Taxonomy, 2015 to 2022 15.2. Market Size Value (US$ Million) & Volume (Tonnes) Forecast by Market Taxonomy, 2023 to 2033 15.2.1. By Country 15.2.1.1. Germany 15.2.1.2. Italy 15.2.1.3. France 15.2.1.4. United Kingdom 15.2.1.5. Spain 15.2.1.6. BENELUX 15.2.1.7. Nordic 15.2.1.8. Rest of Europe 15.2.2. By Product Type 15.2.3. By Material 15.2.4. By Lamination Type 15.2.5. By Product Weight 15.2.6. by End Use 15.3. Market Attractiveness Analysis 15.3.1. By Country 15.3.2. By Product Type 15.3.3. By Material 15.3.4. By Lamination Type 15.3.5. By Product Weight 15.3.6. by End Use 15.4. Key Takeaways 16. Eastern Europe Market Analysis 2015 to 2022 and Forecast 2023 to 2033, By Country 16.1. Historical Market Size Value (US$ Million) & Volume (Tonnes) Trend Analysis by Market Taxonomy, 2015 to 2022 16.2. Market Size Value (US$ Million) & Volume (Tonnes) Forecast by Market Taxonomy, 2023 to 2033 16.2.1. By Country 16.2.1.1. Poland 16.2.1.2. Hungary 16.2.1.3. Romania 16.2.1.4. Czech Republic 16.2.1.5. Rest of Eastern Europe 16.2.2. By Product Type 16.2.3. By Material 16.2.4. By Lamination Type 16.2.5. By Product Weight 16.2.6. by End Use 16.3. Market Attractiveness Analysis 16.3.1. By Country 16.3.2. By Product Type 16.3.3. By Material 16.3.4. By Lamination Type 16.3.5. By Product Weight 16.3.6. by End Use 16.4. Key Takeaways 17. Central Asia Market Analysis 2015 to 2022 and Forecast 2023 to 2033, By Country 17.1. Historical Market Size Value (US$ Million) & Volume (Tonnes) Trend Analysis by Market Taxonomy, 2015 to 2022 17.2. Market Size Value (US$ Million) & Volume (Tonnes) Forecast by Market Taxonomy, 2023 to 2033 17.2.1. By Country 17.2.2. By Product Type 17.2.3. By Material 17.2.4. By Lamination Type 17.2.5. By Product Weight 17.2.6. by End Use 17.3. Market Attractiveness Analysis 17.3.1. By Country 17.3.2. By Product Type 17.3.3. By Material 17.3.4. By Lamination Type 17.3.5. By Product Weight 17.3.6. by End Use 17.4. Key Takeaways 18. Russia & Belarus Market Analysis 2015 to 2022 and Forecast 2023 to 2033, By Country 18.1. Historical Market Size Value (US$ Million) & Volume (Tonnes) Trend Analysis by Market Taxonomy, 2015 to 2022 18.2. Market Size Value (US$ Million) & Volume (Tonnes) Forecast by Market Taxonomy, 2023 to 2033 18.2.1. By Country 18.2.2. By Product Type 18.2.3. By Material 18.2.4. By Lamination Type 18.2.5. By Product Weight 18.2.6. by End Use 18.3. Market Attractiveness Analysis 18.3.1. By Country 18.3.2. By Product Type 18.3.3. By Material 18.3.4. By Lamination Type 18.3.5. By Product Weight 18.3.6. by End Use 18.4. Key Takeaways 19. Balkan Countries Market Analysis 2015 to 2022 and Forecast 2023 to 2033, By Country 19.1. Historical Market Size Value (US$ Million) & Volume (Tonnes) Trend Analysis by Market Taxonomy, 2015 to 2022 19.2. Market Size Value (US$ Million) & Volume (Tonnes) Forecast by Market Taxonomy, 2023 to 2033 19.2.1. By Country 19.2.2. By Product Type 19.2.3. By Material 19.2.4. By Lamination Type 19.2.5. By Product Weight 19.2.6. by End Use 19.3. Market Attractiveness Analysis 19.3.1. By Country 19.3.2. By Product Type 19.3.3. By Material 19.3.4. By Lamination Type 19.3.5. By Product Weight 19.3.6. by End Use 19.4. Key Takeaways 20. Baltic Countries Market Analysis 2015 to 2022 and Forecast 2023 to 2033, By Country 20.1. Historical Market Size Value (US$ Million) & Volume (Tonnes) Trend Analysis by Market Taxonomy, 2015 to 2022 20.2. Market Size Value (US$ Million) & Volume (Tonnes) Forecast by Market Taxonomy, 2023 to 2033 20.2.1. By Country 20.2.2. By Product Type 20.2.3. By Material 20.2.4. By Lamination Type 20.2.5. By Product Weight 20.2.6. by End Use 20.3. Market Attractiveness Analysis 20.3.1. By Country 20.3.2. By Product Type 20.3.3. By Material 20.3.4. By Lamination Type 20.3.5. By Product Weight 20.3.6. by End Use 20.4. Key Takeaways 21. Middle East & Africa Market Analysis 2015 to 2022 and Forecast 2023 to 2033, By Country 21.1. Historical Market Size Value (US$ Million) & Volume (Tonnes) Trend Analysis by Market Taxonomy, 2015 to 2022 21.2. Market Size Value (US$ Million) & Volume (Tonnes) Forecast by Market Taxonomy, 2023 to 2033 21.2.1. By Country 21.2.1.1. GCC Countries 21.2.1.2. Türkiye 21.2.1.3. Northern Africa 21.2.1.4. South Africa 21.2.1.5. Rest of Middle East & Africa 21.2.2. By Product Type 21.2.3. By Material 21.2.4. By Lamination Type 21.2.5. By Product Weight 21.2.6. by End Use 21.3. Market Attractiveness Analysis 21.3.1. By Country 21.3.2. By Product Type 21.3.3. By Material 21.3.4. By Lamination Type 21.3.5. By Product Weight 21.3.6. by End Use 21.4. Key Takeaways 22. Country wise Market Analysis 22.1. USA 22.1.1. Market Share Analysis, 2023 22.1.2. By Product Type 22.1.3. By Material 22.1.4. By Lamination Type 22.1.5. By Product Weight 22.1.6. by End Use 22.2. Canada 22.2.1. Market Share Analysis, 2023 22.2.2. By Product Type 22.2.3. By Material 22.2.4. By Lamination Type 22.2.5. By Product Weight 22.2.6. by End Use 22.3. Brazil 22.3.1. Market Share Analysis, 2023 22.3.2. By Product Type 22.3.3. By Material 22.3.4. By Lamination Type 22.3.5. By Product Weight 22.3.6. by End Use 22.4. Mexico 22.4.1. Market Share Analysis, 2023 22.4.2. By Product Type 22.4.3. By Material 22.4.4. By Lamination Type 22.4.5. By Product Weight 22.4.6. by End Use 22.5. Germany 22.5.1. Market Share Analysis, 2023 22.5.2. By Product Type 22.5.3. By Material 22.5.4. By Lamination Type 22.5.5. By Product Weight 22.5.6. by End Use 22.6. Italy 22.6.1. Market Share Analysis, 2023 22.6.2. By Product Type 22.6.3. By Material 22.6.4. By Lamination Type 22.6.5. By Product Weight 22.6.6. by End Use 22.7. France 22.7.1. Market Share Analysis, 2023 22.7.2. By Product Type 22.7.3. By Material 22.7.4. By Lamination Type 22.7.5. By Product Weight 22.7.6. by End Use 22.8. Spain 22.8.1. Market Share Analysis, 2023 22.8.2. By Product Type 22.8.3. By Material 22.8.4. By Lamination Type 22.8.5. By Product Weight 22.8.6. by End Use 22.9. United Kingdom 22.9.1. Market Share Analysis, 2023 22.9.2. By Product Type 22.9.3. By Material 22.9.4. By Lamination Type 22.9.5. By Product Weight 22.9.6. by End Use 22.10. China 22.10.1. Market Share Analysis, 2023 22.10.2. By Product Type 22.10.3. By Material 22.10.4. By Lamination Type 22.10.5. By Product Weight 22.10.6. by End Use 22.11. Japan 22.11.1. Market Share Analysis, 2023 22.11.2. By Product Type 22.11.3. By Material 22.11.4. By Lamination Type 22.11.5. By Product Weight 22.11.6. by End Use 22.12. India 22.12.1. Market Share Analysis, 2023 22.12.2. By Product Type 22.12.3. By Material 22.12.4. By Lamination Type 22.12.5. By Product Weight 22.12.6. by End Use 22.13. Australia & New Zealand 22.13.1. Market Share Analysis, 2023 22.13.2. By Product Type 22.13.3. By Material 22.13.4. By Lamination Type 22.13.5. By Product Weight 22.13.6. by End Use 22.14. GCC Countries 22.14.1. Market Share Analysis, 2023 22.14.2. By Product Type 22.14.3. By Material 22.14.4. By Lamination Type 22.14.5. By Product Weight 22.14.6. by End Use 22.15. South Africa 22.15.1. Market Share Analysis, 2023 22.15.2. By Product Type 22.15.3. By Material 22.15.4. By Lamination Type 22.15.5. By Product Weight 22.15.6. by End Use 23. Market Structure Analysis 23.1. Competition Dashboard 23.2. Competition Benchmarking 23.3. Market Share Analysis of Top Players 23.3.1. by Region 23.3.2. by Product Portfolio 24. Competition Analysis 24.1. Competition Deep Dive 24.1.1. Rhino United Kingdom 24.1.1.1. Overview 24.1.1.2. Product Portfolio 24.1.1.3. Profitability by Market Segments (Product Type/Material/Lamination Type/Product Weight/End Use/Region) 24.1.1.4. Sales Footprint 24.1.1.5. Strategy Overview 24.1.1.5.1. Marketing Strategy 24.1.1.5.2. Product Strategy 24.1.1.5.3. Channel Strategy 24.1.2. KSA Polymer 24.1.3. K-Tarp Vina Co., Ltd. 24.1.4. Fulin Plastic Industry Co., Ltd. 24.1.5. C&H Vina Co., Ltd. 24.1.6. Puyoung Industrial Corporation, Ltd 24.1.7. Bag Poly International Pvt. Ltd 24.1.8. Qingdao SG Global Packaging Co., Ltd 24.1.9. Telford Tarpaulins 24.1.10. Darling Downs Tarpaulins 24.1.11. Marson Industries Pty Ltd 24.1.12. J Clemishaw Ltd. 24.1.13. Del Tarpaulins Ltd. 24.1.14. Canadian Tarpaulin Manufacturers Ltd. 24.1.15. Cunningham Covers. 25. Assumptions and Acronyms Used 26. Research Methodology
Don't pay for what you don't need
Customize your report by selecting specific countries or regions and save 30%!
List of Tables
Table 01: Global Market Value (US$ Million) Forecast by Region, 2015 to 2033 Table 02: Global Market Volume (Tonnes) Forecast by Region, 2015 to 2033 Table 03: Global Market Value (US$ Million) Forecast by Product Type, 2015 to 2033 Table 04: Global Market Volume (Tonnes) Forecast by Product Type, 2015 to 2033 Table 05: Global Market Value (US$ Million) Forecast By Material, 2015 to 2033 Table 06: Global Market Volume (Tonnes) Forecast By Material, 2015 to 2033 Table 07: Global Market Value (US$ Million) Forecast By Lamination Type, 2015 to 2033 Table 08: Global Market Volume (Tonnes) Forecast By Lamination Type, 2015 to 2033 Table 07: Global Market Value (US$ Million) Forecast by End Use, 2015 to 2033 Table 08: Global Market Volume (Tonnes) Forecast by End Use, 2015 to 2033 Table 09: North America Market Value (US$ Million) Forecast By Country, 2015 to 2033 Table 10: North America Market Volume (Tonnes) Forecast By Country, 2015 to 2033 Table 11: North America Market Value (US$ Million) Forecast by Product Type, 2015 to 2033 Table 12: North America Market Volume (Tonnes) Forecast by Product Type, 2015 to 2033 Table 13: North America Market Value (US$ Million) Forecast By Material, 2015 to 2033 Table 14: North America Market Volume (Tonnes) Forecast By Material, 2015 to 2033 Table 15: North America Market Value (US$ Million) Forecast By Lamination Type, 2015 to 2033 Table 16: North America Market Volume (Tonnes) Forecast By Lamination Type, 2015 to 2033 Table 15: North America Market Value (US$ Million) Forecast by End Use, 2015 to 2033 Table 16: North America Market Volume (Tonnes) Forecast by End Use, 2015 to 2033 Table 17: Latin America Market Value (US$ Million) Forecast By Country, 2015 to 2033 Table 18: Latin America Market Volume (Tonnes) Forecast By Country, 2015 to 2033 Table 19: Latin America Market Value (US$ Million) Forecast by Product Type, 2015 to 2033 Table 20: Latin America Market Volume (Tonnes) Forecast by Product Type, 2015 to 2033 Table 21: Latin America Market Value (US$ Million) Forecast By Material, 2015 to 2033 Table 22: Latin America Market Volume (Tonnes) Forecast By Material, 2015 to 2033 Table 23: Latin America Market Value (US$ Million) Forecast By Lamination Type, 2015 to 2033 Table 24: Latin America Market Volume (Tonnes) Forecast By Lamination Type, 2015 to 2033 Table 21: Latin America Market Value (US$ Million) Forecast by End Use, 2015 to 2033 Table 22: Latin America Market Volume (Tonnes) Forecast by End Use, 2015 to 2033 Table 25: East Asia Market Value (US$ Million) Forecast By Country, 2015 to 2033 Table 26: East Asia Market Volume (Tonnes) Forecast By Country, 2015 to 2033 Table 27: East Asia Market Value (US$ Million) Forecast by Product Type, 2015 to 2033 Table 28: East Asia Market Volume (Tonnes) Forecast by Product Type, 2015 to 2033 Table 29: East Asia Market Value (US$ Million) Forecast By Material, 2015 to 2033 Table 30: East Asia Market Volume (Tonnes) Forecast By Material, 2015 to 2033 Table 31: East Asia Market Value (US$ Million) Forecast By Lamination Type, 2015 to 2033 Table 32: East Asia Market Volume (Tonnes) Forecast By Lamination Type, 2015 to 2033 Table 29: East Asia Market Value (US$ Million) Forecast by End Use, 2015 to 2033 Table 30: East Asia Market Volume (Tonnes) Forecast by End Use, 2015 to 2033 Table 33: South Asia & Pacific Market Value (US$ Million) Forecast By Country, 2015 to 2033 Table 34: South Asia & Pacific Market Volume (Tonnes) Forecast By Country, 2015 to 2033 Table 35: South Asia & Pacific Market Value (US$ Million) Forecast by Product Type, 2015 to 2033 Table 36: South Asia & Pacific Market Volume (Tonnes) Forecast by Product Type, 2015 to 2033 Table 37: South Asia & Pacific Market Value (US$ Million) Forecast By Material, 2015 to 2033 Table 38: South Asia & Pacific Market Volume (Tonnes) Forecast By Material, 2015 to 2033 Table 39: South Asia & Pacific Market Value (US$ Million) Forecast By Lamination Type, 2015 to 2033 Table 40: South Asia & Pacific Market Volume (Tonnes) Forecast By Lamination Type, 2015 to 2033 Table 39: South Asia & Pacific Market Value (US$ Million) Forecast by End Use, 2015 to 2033 Table 40: South Asia & Pacific Market Volume (Tonnes) Forecast by End Use, 2015 to 2033 Table 41: Western Europe Market Value (US$ Million) Forecast By Country, 2015 to 2033 Table 42: Western Europe Market Volume (Tonnes) Forecast By Country, 2015 to 2033 Table 43: Western Europe Market Value (US$ Million) Forecast by Product Type, 2015 to 2033 Table 44: Western Europe Market Volume (Tonnes) Forecast by Product Type, 2015 to 2033 Table 45: Western Europe Market Value (US$ Million) Forecast By Material, 2015 to 2033 Table 46: Western Europe Market Volume (Tonnes) Forecast By Material, 2015 to 2033 Table 47: Western Europe Market Value (US$ Million) Forecast By Lamination Type, 2015 to 2033 Table 48: Western Europe Market Volume (Tonnes) Forecast By Lamination Type, 2015 to 2033 Table 47: Western Europe Market Value (US$ Million) Forecast by End Use, 2015 to 2033 Table 48: Western Europe Market Volume (Tonnes) Forecast by End Use, 2015 to 2033 Table 49: Eastern Europe Market Value (US$ Million) Forecast By Country, 2015 to 2033 Table 50: Eastern Europe Market Volume (Tonnes) Forecast By Country, 2015 to 2033 Table 51: Eastern Europe Market Value (US$ Million) Forecast by Product Type, 2015 to 2033 Table 52: Eastern Europe Market Volume (Tonnes) Forecast by Product Type, 2015 to 2033 Table 53: Eastern Europe Market Value (US$ Million) Forecast By Material, 2015 to 2033 Table 54: Eastern Europe Market Volume (Tonnes) Forecast By Material, 2015 to 2033 Table 55: Eastern Europe Market Value (US$ Million) Forecast By Lamination Type, 2015 to 2033 Table 56: Eastern Europe Market Volume (Tonnes) Forecast By Lamination Type, 2015 to 2033 Table 55: Eastern Europe Market Value (US$ Million) Forecast by End Use, 2015 to 2033 Table 56: Eastern Europe Market Volume (Tonnes) Forecast by End Use, 2015 to 2033 Table 57: Central Asia Market Value (US$ Million) Forecast By Country, 2015 to 2033 Table 58: Central Asia Market Volume (Tonnes) Forecast By Country, 2015 to 2033 Table 59: Central Asia Market Value (US$ Million) Forecast by Product Type, 2015 to 2033 Table 60: Central Asia Market Volume (Tonnes) Forecast by Product Type, 2015 to 2033 Table 61: Central Asia Market Value (US$ Million) Forecast By Material, 2015 to 2033 Table 62: Central Asia Market Volume (Tonnes) Forecast By Material, 2015 to 2033 Table 63: Central Asia Market Value (US$ Million) Forecast By Lamination Type, 2015 to 2033 Table 64: Central Asia Market Volume (Tonnes) Forecast By Lamination Type, 2015 to 2033 Table 63: Central Asia Market Value (US$ Million) Forecast by End Use, 2015 to 2033 Table 64: Central Asia Market Volume (Tonnes) Forecast by End Use, 2015 to 2033 Table 65: Russia & Belarus Market Value (US$ Million) Forecast By Country, 2015 to 2033 Table 66: Russia & Belarus Market Volume (Tonnes) Forecast By Country, 2015 to 2033 Table 67: Russia & Belarus Market Value (US$ Million) Forecast by Product Type, 2015 to 2033 Table 68: Russia & Belarus Market Volume (Tonnes) Forecast by Product Type, 2015 to 2033 Table 69: Russia & Belarus Market Value (US$ Million) Forecast By Material, 2015 to 2033 Table 70: Russia & Belarus Market Volume (Tonnes) Forecast By Material, 2015 to 2033 Table 71: Russia & Belarus Market Value (US$ Million) Forecast By Lamination Type, 2015 to 2033 Table 72: Russia & Belarus Market Volume (Tonnes) Forecast By Lamination Type, 2015 to 2033 Table 71: Russia & Belarus Market Value (US$ Million) Forecast by End Use, 2015 to 2033 Table 72: Russia & Belarus Market Volume (Tonnes) Forecast by End Use, 2015 to 2033 Table 73: Balkan Countries Market Value (US$ Million) Forecast By Country, 2015 to 2033 Table 74: Balkan Countries Market Volume (Tonnes) Forecast By Country, 2015 to 2033 Table 75: Balkan Countries Market Value (US$ Million) Forecast by Product Type, 2015 to 2033 Table 76: Balkan Countries Market Volume (Tonnes) Forecast by Product Type, 2015 to 2033 Table 77: Balkan Countries Market Value (US$ Million) Forecast By Material, 2015 to 2033 Table 78: Balkan Countries Market Volume (Tonnes) Forecast By Material, 2015 to 2033 Table 79: Balkan Countries Market Value (US$ Million) Forecast By Lamination Type, 2015 to 2033 Table 80: Balkan Countries Market Volume (Tonnes) Forecast By Lamination Type, 2015 to 2033 Table 79: Balkan Countries Market Value (US$ Million) Forecast by End Use, 2015 to 2033 Table 80: Balkan Countries Market Volume (Tonnes) Forecast by End Use, 2015 to 2033 Table 81: Baltic Countries Market Value (US$ Million) Forecast By Country, 2015 to 2033 Table 82: Baltic Countries Market Volume (Tonnes) Forecast By Country, 2015 to 2033 Table 83: Baltic Countries Market Value (US$ Million) Forecast by Product Type, 2015 to 2033 Table 84: Baltic Countries Market Volume (Tonnes) Forecast by Product Type, 2015 to 2033 Table 85: Baltic Countries Market Value (US$ Million) Forecast By Material, 2015 to 2033 Table 86: Baltic Countries Market Volume (Tonnes) Forecast By Material, 2015 to 2033 Table 87: Baltic Countries Market Value (US$ Million) Forecast By Lamination Type, 2015 to 2033 Table 88: Baltic Countries Market Volume (Tonnes) Forecast By Lamination Type, 2015 to 2033 Table 87: Baltic Countries Market Value (US$ Million) Forecast by End Use, 2015 to 2033 Table 88: Baltic Countries Market Volume (Tonnes) Forecast by End Use, 2015 to 2033 Table 89: Middle East & Africa Market Value (US$ Million) Forecast By Country, 2015 to 2033 Table 90: Middle East & Africa Market Volume (Tonnes) Forecast By Country, 2015 to 2033 Table 91: Middle East & Africa Market Value (US$ Million) Forecast by Product Type, 2015 to 2033 Table 92: Middle East & Africa Market Volume (Tonnes) Forecast by Product Type, 2015 to 2033 Table 93: Middle East & Africa Market Value (US$ Million) Forecast By Material, 2015 to 2033 Table 94: Middle East & Africa Market Volume (Tonnes) Forecast By Material, 2015 to 2033 Table 95: Middle East & Africa Market Value (US$ Million) Forecast By Lamination Type, 2015 to 2033 Table 96: Middle East & Africa Market Volume (Tonnes) Forecast By Lamination Type, 2015 to 2033 Table 95: Middle East & Africa Market Value (US$ Million) Forecast by End Use, 2015 to 2033 Table 96: Middle East & Africa Market Volume (Tonnes) Forecast by End Use, 2015 to 2033 Table 97: USA Market Value (US$ Million) Forecast by Product Type, Packaging, and End Use (2023(E) & 2033(F)) Table 98: Canada Market Value (US$ Million) Forecast by Product Type, Packaging, and End Use (2023(E) & 2033(F)) Table 99: Brazil Market Value (US$ Million) Forecast by Product Type, Packaging, and End Use (2023(E) & 2033(F)) Table 100: Mexico Market Value (US$ Million) Forecast by Product Type, Packaging, and End Use (2023(E) & 2033(F)) Table 101: Germany Market Value (US$ Million) Forecast by Product Type, Packaging, and End Use (2023(E) & 2033(F)) Table 102: Italy Market Value (US$ Million) Forecast by Product Type, Packaging, and End Use (2023(E) & 2033(F)) Table 103: France Market Value (US$ Million) Forecast by Product Type, Packaging, and End Use (2023(E) & 2033(F)) Table 104: Spain Market Value (US$ Million) Forecast by Product Type, Packaging, and End Use (2023(E) & 2033(F)) Table 105: United Kingdom Market Value (US$ Million) Forecast by Product Type, Packaging, and End Use (2023(E) & 2033(F)) Table 106: China Market Value (US$ Million) Forecast by Product Type, Packaging, and End Use (2023(E) & 2033(F)) Table 107: Japan Market Value (US$ Million) Forecast by Product Type, Packaging, and End Use (2023(E) & 2033(F)) Table 108: India Market Value (US$ Million) Forecast by Product Type, Packaging, and End Use (2023(E) & 2033(F)) Table 109: Australia & New Zealand Market Value (US$ Million) Forecast by Product Type, Packaging, and End Use (2023(E) & 2033(F)) Table 110: GCC Countries Market Value (US$ Million) Forecast by Product Type, Packaging, and End Use (2023(E) & 2033(F)) Table 111: South Africa Market Value (US$ Million) Forecast by Product Type, Packaging, and End Use (2023(E) & 2033(F))
List of Charts
Figure 01: Global Market Value (US$ Million) by Product Type, 2023 to 2033 Figure 02: Global Market Value (US$ Million) By Material, 2023 to 2033 Figure 03: Global Market Value (US$ Million) By Lamination Type, 2023 to 2033 Figure 02: Global Market Value (US$ Million) by End Use, 2023 to 2033 Figure 04: Global Market Value (US$ Million) by Region, 2023 to 2033 Figure 05: Global Market Value (US$ Million) Analysis by Region, 2015 to 2022 Figure 06: Global Market Volume (Tonnes) Analysis by Region, 2015 to 2033 Figure 07: Global Market Value Share (%) and BPS Analysis by Region, 2023 & 2033 Figure 08: Global Market Y-o-Y Growth (%) Projections by Region, 2023 to 2033 Figure 09: Global Market Value (US$ Million) Analysis by Product Type, 2015 to 2022 Figure 10: Global Market Volume (Tonnes) Analysis by Product Type, 2015 to 2033 Figure 11: Global Market Value Share (%) and BPS Analysis by Product Type, 2023 & 2033 Figure 12: Global Market Y-o-Y Growth (%) Projections by Product Type, 2023 to 2033 Figure 13: Global Market Value (US$ Million) Analysis By Material, 2015 to 2022 Figure 14: Global Market Volume (Tonnes) Analysis By Material, 2015 to 2033 Figure 15: Global Market Value Share (%) and BPS Analysis By Material, 2023 & 2033 Figure 16: Global Market Y-o-Y Growth (%) Projections By Material, 2023 to 2033 Figure 17: Global Market Value (US$ Million) Analysis By Lamination Type, 2015 to 2022 Figure 18: Global Market Volume (Tonnes) Analysis By Lamination Type, 2015 to 2033 Figure 19: Global Market Value Share (%) and BPS Analysis By Lamination Type, 2023 & 2033 Figure 20: Global Market Y-o-Y Growth (%) Projections By Lamination Type, 2023 to 2033 Figure 13: Global Market Value (US$ Million) Analysis by End Use, 2015 to 2022 Figure 14: Global Market Volume (Tonnes) Analysis by End Use, 2015 to 2033 Figure 15: Global Market Value Share (%) and BPS Analysis by End Use, 2023 & 2033 Figure 16: Global Market Y-o-Y Growth (%) Projections by End Use, 2023 to 2033 Figure 21: Global Market Attractiveness by Product Type, 2023 to 2033 Figure 22: Global Market Attractiveness By Material, 2023 to 2033 Figure 23: Global Market Attractiveness By Lamination Type, 2023 to 2033 Figure 24: Global Market Attractiveness by End Use, 2023 to 2033 Figure 25: Global Market Attractiveness by Region, 2023 to 2033 Figure 26: North America Market Value (US$ Million) by Product Type, 2023 to 2033 Figure 27: North America Market Value (US$ Million) By Material, 2023 to 2033 Figure 28: North America Market Value (US$ Million) By Lamination Type, 2023 to 2033 Figure 27: North America Market Value (US$ Million) by End Use, 2023 to 2033 Figure 29: North America Market Value (US$ Million) By Country, 2023 to 2033 Figure 30: North America Market Value (US$ Million) Analysis By Country, 2015 to 2022 Figure 31: North America Market Volume (Tonnes) Analysis By Country, 2015 to 2033 Figure 32: North America Market Value Share (%) and BPS Analysis By Country, 2023 & 2033 Figure 33: North America Market Y-o-Y Growth (%) Projections By Country, 2023 to 2033 Figure 34: North America Market Value (US$ Million) Analysis by Product Type, 2015 to 2022 Figure 35: North America Market Volume (Tonnes) Analysis by Product Type, 2015 to 2033 Figure 36: North America Market Value Share (%) and BPS Analysis by Product Type, 2023 & 2033 Figure 37: North America Market Y-o-Y Growth (%) Projections by Product Type, 2023 to 2033 Figure 38: North America Market Value (US$ Million) Analysis By Material, 2015 to 2022 Figure 39: North America Market Volume (Tonnes) Analysis By Material, 2015 to 2033 Figure 40: North America Market Value Share (%) and BPS Analysis By Material, 2023 & 2033 Figure 41: North America Market Y-o-Y Growth (%) Projections By Material, 2023 to 2033 Figure 42: North America Market Value (US$ Million) Analysis By Lamination Type, 2015 to 2022 Figure 43: North America Market Volume (Tonnes) Analysis By Lamination Type, 2015 to 2033 Figure 44: North America Market Value Share (%) and BPS Analysis By Lamination Type, 2023 & 2033 Figure 45: North America Market Y-o-Y Growth (%) Projections By Lamination Type, 2023 to 2033 Figure 38: North America Market Value (US$ Million) Analysis by End Use, 2015 to 2022 Figure 39: North America Market Volume (Tonnes) Analysis by End Use, 2015 to 2033 Figure 40: North America Market Value Share (%) and BPS Analysis by End Use, 2023 & 2033 Figure 41: North America Market Y-o-Y Growth (%) Projections by End Use, 2023 to 2033 Figure 46: North America Market Attractiveness by Product Type, 2023 to 2033 Figure 47: North America Market Attractiveness By Material, 2023 to 2033 Figure 48: North America Market Attractiveness By Lamination Type, 2023 to 2033 Figure 47: North America Market Attractiveness by End Use, 2023 to 2033 Figure 49: North America Market Attractiveness By Country, 2023 to 2033 Figure 50: Latin America Market Value (US$ Million) by Product Type, 2023 & 2033 Figure 51: Latin America Market Value (US$ Million) by Product Type, 2023 to 2033 Figure 52: Latin America Market Value (US$ Million) By Lamination Type, 2023 to 2033 Figure 52: Latin America Market Value (US$ Million) by End Use, 2023 to 2033 Figure 53: Latin America Market Value (US$ Million) By Country, 2023 to 2033 Figure 54: Latin America Market Value (US$ Million) Analysis By Country, 2015 to 2022 Figure 55: Latin America Market Volume (Tonnes) Analysis By Country, 2015 to 2033 Figure 56: Latin America Market Value Share (%) and BPS Analysis By Country, 2023 & 2033 Figure 57: Latin America Market Y-o-Y Growth (%) Projections By Country, 2023 to 2033 Figure 58: Latin America Market Value (US$ Million) Analysis by Product Type, 2015 to 2022 Figure 59: Latin America Market Volume (Tonnes) Analysis by Product Type, 2015 to 2033 Figure 60: Latin America Market Value Share (%) and BPS Analysis by Product Type, 2023 & 2033 Figure 61: Latin America Market Y-o-Y Growth (%) Projections by Product Type, 2023 to 2033 Figure 62: Latin America Market Value (US$ Million) Analysis by Product Type, 2015 to 2022 Figure 63: Latin America Market Volume (Tonnes) Analysis by Product Type, 2015 to 2033 Figure 64: Latin America Market Value Share (%) and BPS Analysis by Product Type, 2023 & 2033 Figure 65: Latin America Market Y-o-Y Growth (%) Projections by Product Type, 2023 to 2033 Figure 66: Latin America Market Value (US$ Million) Analysis By Lamination Type, 2015 to 2022 Figure 67: Latin America Market Volume (Tonnes) Analysis By Lamination Type, 2015 to 2033 Figure 68: Latin America Market Value Share (%) and BPS Analysis By Lamination Type, 2023 & 2033 Figure 69: Latin America Market Y-o-Y Growth (%) Projections By Lamination Type, 2023 to 2033 Figure 66: Latin America Market Value (US$ Million) Analysis by End Use, 2015 to 2022 Figure 67: Latin America Market Volume (Tonnes) Analysis by End Use, 2015 to 2033 Figure 68: Latin America Market Value Share (%) and BPS Analysis by End Use, 2023 & 2033 Figure 69: Latin America Market Y-o-Y Growth (%) Projections by End Use, 2023 to 2033 Figure 70: Latin America Market Attractiveness by Product Type, 2023 to 2033 Figure 71: Latin America Market Attractiveness by Product Type, 2023 to 2033 Figure 72: Latin America Market Attractiveness By Lamination Type, 2023 to 2033 Figure 72: Latin America Market Attractiveness by End Use, 2023 to 2033 Figure 73: Latin America Market Attractiveness By Country, 2023 to 2033 Figure 74: East Asia Market Value (US$ Million) by Product Type, 2023 to 2033 Figure 75: East Asia Market Value (US$ Million) by Product Type, 2023 to 2033 Figure 76: East Asia Market Value (US$ Million) By Lamination Type, 2023 to 2033 Figure 76: East Asia Market Value (US$ Million) by End Use, 2023 to 2033 Figure 77: East Asia Market Value (US$ Million) By Country, 2023 to 2033 Figure 78: East Asia Market Value (US$ Million) Analysis By Country, 2015 to 2022 Figure 79: East Asia Market Volume (Tonnes) Analysis By Country, 2015 to 2033 Figure 80: East Asia Market Value Share (%) and BPS Analysis By Country, 2023 & 2033 Figure 81: East Asia Market Y-o-Y Growth (%) Projections By Country, 2023 to 2033 Figure 82: East Asia Market Value (US$ Million) Analysis by Product Type, 2015 to 2022 Figure 83: East Asia Market Volume (Tonnes) Analysis by Product Type, 2015 to 2033 Figure 84: East Asia Market Value Share (%) and BPS Analysis by Product Type, 2023 & 2033 Figure 85: East Asia Market Y-o-Y Growth (%) Projections by Product Type, 2023 to 2033 Figure 86: East Asia Market Value (US$ Million) Analysis by Product Type, 2015 to 2022 Figure 87: East Asia Market Volume (Tonnes) Analysis by Product Type, 2015 to 2033 Figure 88: East Asia Market Value Share (%) and BPS Analysis by Product Type, 2023 & 2033 Figure 89: East Asia Market Y-o-Y Growth (%) Projections by Product Type, 2023 to 2033 Figure 90: East Asia Market Value (US$ Million) Analysis By Lamination Type, 2015 to 2022 Figure 91: East Asia Market Volume (Tonnes) Analysis By Lamination Type, 2015 to 2033 Figure 92: East Asia Market Value Share (%) and BPS Analysis By Lamination Type, 2023 & 2033 Figure 93: East Asia Market Y-o-Y Growth (%) Projections By Lamination Type, 2023 to 2033 Figure 90: East Asia Market Value (US$ Million) Analysis by End Use, 2015 to 2022 Figure 91: East Asia Market Volume (Tonnes) Analysis by End Use, 2015 to 2033 Figure 92: East Asia Market Value Share (%) and BPS Analysis by End Use, 2023 & 2033 Figure 93: East Asia Market Y-o-Y Growth (%) Projections by End Use, 2023 to 2033 Figure 94: East Asia Market Attractiveness by Product Type, 2023 to 2033 Figure 96: East Asia Market Attractiveness By Lamination Type, 2023 to 2033 Figure 95: East Asia Market Attractiveness by End Use, 2023 to 2033 Figure 97: East Asia Market Attractiveness By Country, 2023 to 2033 Figure 98: South Asia & Pacific Market Value (US$ Million) by Product Type, 2023 to 2033 Figure 99: South Asia & Pacific Market Value (US$ Million) By Material, 2023 to 2033 Figure 100: South Asia & Pacific Market Value (US$ Million) By Lamination Type, 2023 to 2033 Figure 99: South Asia & Pacific Market Value (US$ Million) by End Use, 2023 to 2033 Figure 101: South Asia & Pacific Market Value (US$ Million) By Country, 2023 to 2033 Figure 102: South Asia & Pacific Market Value (US$ Million) Analysis By Country, 2015 to 2022 Figure 103: South Asia & Pacific Market Volume (Tonnes) Analysis By Country, 2015 to 2033 Figure 104: South Asia & Pacific Market Value Share (%) and BPS Analysis By Country, 2023 & 2033 Figure 105: South Asia & Pacific Market Y-o-Y Growth (%) Projections By Country, 2023 to 2033 Figure 106: South Asia & Pacific Market Value (US$ Million) Analysis by Product Type, 2015 to 2022 Figure 107: South Asia & Pacific Market Volume (Tonnes) Analysis by Product Type, 2015 to 2033 Figure 108: South Asia & Pacific Market Value Share (%) and BPS Analysis by Product Type, 2023 & 2033 Figure 109: South Asia & Pacific Market Y-o-Y Growth (%) Projections by Product Type, 2023 to 2033 Figure 110: South Asia & Pacific Market Value (US$ Million) Analysis By Material, 2015 to 2022 Figure 111: South Asia & Pacific Market Volume (Tonnes) Analysis By Material, 2015 to 2033 Figure 112: South Asia & Pacific Market Value Share (%) and BPS Analysis By Material, 2023 & 2033 Figure 113: South Asia & Pacific Market Y-o-Y Growth (%) Projections By Material, 2023 to 2033 Figure 114: South Asia & Pacific Market Value (US$ Million) Analysis By Lamination Type, 2015 to 2022 Figure 115: South Asia & Pacific Market Volume (Tonnes) Analysis By Lamination Type, 2015 to 2033 Figure 116: South Asia & Pacific Market Value Share (%) and BPS Analysis By Lamination Type, 2023 & 2033 Figure 117: South Asia & Pacific Market Y-o-Y Growth (%) Projections By Lamination Type, 2023 to 2033 Figure 106: South Asia & Pacific Market Value (US$ Million) Analysis by End Use, 2015 to 2022 Figure 107: South Asia & Pacific Market Volume (Tonnes) Analysis by End Use, 2015 to 2033 Figure 108: South Asia & Pacific Market Value Share (%) and BPS Analysis by End Use, 2023 & 2033 Figure 109: South Asia & Pacific Market Y-o-Y Growth (%) Projections by End Use, 2023 to 2033 Figure 118: South Asia & Pacific Market Attractiveness by Product Type, 2023 to 2033 Figure 119: South Asia & Pacific Market Attractiveness By Material, 2023 to 2033 Figure 120: South Asia & Pacific Market Attractiveness By Lamination Type, 2023 to 2033 Figure 119: South Asia & Pacific Market Attractiveness by End Use, 2023 to 2033 Figure 121: South Asia & Pacific Market Attractiveness By Country, 2023 to 2033 Figure 123: Western Europe Market Value (US$ Million) by Product Type, 2023 to 2033 Figure 124: Western Europe Market Value (US$ Million) by Product Type, 2023 to 2033 Figure 125: Western Europe Market Value (US$ Million) By Lamination Type, 2023 to 2033 Figure 125: Western Europe Market Value (US$ Million) by End Use, 2023 to 2033 Figure 126: Western Europe Market Value (US$ Million) By Country, 2023 to 2033 Figure 127: Western Europe Market Value (US$ Million) Analysis By Country, 2015 to 2022 Figure 128: Western Europe Market Volume (Tonnes) Analysis By Country, 2015 to 2033 Figure 129: Western Europe Market Value Share (%) and BPS Analysis By Country, 2023 & 2033 Figure 130: Western Europe Market Y-o-Y Growth (%) Projections By Country, 2023 to 2033 Figure 131: Western Europe Market Value (US$ Million) Analysis by Product Type, 2015 to 2022 Figure 132: Western Europe Market Volume (Tonnes) Analysis by Product Type, 2015 to 2033 Figure 133: Western Europe Market Value Share (%) and BPS Analysis by Product Type, 2023 & 2033 Figure 134: Western Europe Market Y-o-Y Growth (%) Projections by Product Type, 2023 to 2033 Figure 135: Western Europe Market Value (US$ Million) Analysis by Product Type, 2015 to 2022 Figure 136: Western Europe Market Volume (Tonnes) Analysis by Product Type, 2015 to 2033 Figure 137: Western Europe Market Value Share (%) and BPS Analysis by Product Type, 2023 & 2033 Figure 138: Western Europe Market Y-o-Y Growth (%) Projections by Product Type, 2023 to 2033 Figure 139: Western Europe Market Value (US$ Million) Analysis By Lamination Type, 2015 to 2022 Figure 140: Western Europe Market Volume (Tonnes) Analysis By Lamination Type, 2015 to 2033 Figure 141: Western Europe Market Value Share (%) and BPS Analysis By Lamination Type, 2023 & 2033 Figure 142: Western Europe Market Y-o-Y Growth (%) Projections By Lamination Type, 2023 to 2033 Figure 139: Western Europe Market Value (US$ Million) Analysis by End Use, 2015 to 2022 Figure 140: Western Europe Market Volume (Tonnes) Analysis by End Use, 2015 to 2033 Figure 141: Western Europe Market Value Share (%) and BPS Analysis by End Use, 2023 & 2033 Figure 142: Western Europe Market Y-o-Y Growth (%) Projections by End Use, 2023 to 2033 Figure 143: Western Europe Market Attractiveness by Product Type, 2023 to 2033 Figure 144: Western Europe Market Attractiveness by Product Type, 2023 to 2033 Figure 145: Western Europe Market Attractiveness By Lamination Type, 2023 to 2033 Figure 145: Western Europe Market Attractiveness by End Use, 2023 to 2033 Figure 146: Western Europe Market Attractiveness By Country, 2023 to 2033 Figure 147: Eastern Europe Market Value (US$ Million) by Product Type, 2023 to 2033 Figure 148: Eastern Europe Market Value (US$ Million) by Product Type, 2023 to 2033 Figure 149: Eastern Europe Market Value (US$ Million) By Lamination Type, 2023 to 2033 Figure 149: Eastern Europe Market Value (US$ Million) by End Use, 2023 to 2033 Figure 150: Eastern Europe Market Value (US$ Million) By Country, 2023 to 2033 Figure 151: Eastern Europe Market Value (US$ Million) Analysis By Country, 2015 to 2022 Figure 152: Eastern Europe Market Volume (Tonnes) Analysis By Country, 2015 to 2033 Figure 153: Eastern Europe Market Value Share (%) and BPS Analysis By Country, 2023 & 2033 Figure 154: Eastern Europe Market Y-o-Y Growth (%) Projections By Country, 2023 to 2033 Figure 155: Eastern Europe Market Value (US$ Million) Analysis by Product Type, 2015 to 2022 Figure 156: Eastern Europe Market Volume (Tonnes) Analysis by Product Type, 2015 to 2033 Figure 157: Eastern Europe Market Value Share (%) and BPS Analysis by Product Type, 2023 & 2033 Figure 158: Eastern Europe Market Y-o-Y Growth (%) Projections by Product Type, 2023 to 2033 Figure 159: Eastern Europe Market Value (US$ Million) Analysis by Product Type, 2015 to 2022 Figure 160: Eastern Europe Market Volume (Tonnes) Analysis by Product Type, 2015 to 2033 Figure 161: Eastern Europe Market Value Share (%) and BPS Analysis by Product Type, 2023 & 2033 Figure 162: Eastern Europe Market Y-o-Y Growth (%) Projections by Product Type, 2023 to 2033 Figure 163: Eastern Europe Market Value (US$ Million) Analysis By Lamination Type, 2015 to 2022 Figure 164: Eastern Europe Market Volume (Tonnes) Analysis By Lamination Type, 2015 to 2033 Figure 165: Eastern Europe Market Value Share (%) and BPS Analysis By Lamination Type, 2023 & 2033 Figure 166: Eastern Europe Market Y-o-Y Growth (%) Projections By Lamination Type, 2023 to 2033 Figure 163: Eastern Europe Market Value (US$ Million) Analysis by End Use, 2015 to 2022 Figure 164: Eastern Europe Market Volume (Tonnes) Analysis by End Use, 2015 to 2033 Figure 165: Eastern Europe Market Value Share (%) and BPS Analysis by End Use, 2023 & 2033 Figure 166: Eastern Europe Market Y-o-Y Growth (%) Projections by End Use, 2023 to 2033 Figure 167: Eastern Europe Market Attractiveness by Product Type, 2023 to 2033 Figure 168: Eastern Europe Market Attractiveness by Product Type, 2023 to 2033 Figure 169: Eastern Europe Market Attractiveness By Lamination Type, 2023 to 2033 Figure 169: Eastern Europe Market Attractiveness by End Use, 2023 to 2033 Figure 170: Eastern Europe Market Attractiveness By Country, 2023 to 2033 Figure 171: Central Asia Market Value (US$ Million) by Product Type, 2023 to 2033 Figure 172: Central Asia Market Value (US$ Million) by Product Type, 2023 to 2033 Figure 173: Central Asia Market Value (US$ Million) By Lamination Type, 2023 to 2033 Figure 174: Central Asia Market Value (US$ Million) By Country, 2023 to 2033 Figure 175: Central Asia Market Value (US$ Million) Analysis By Country, 2015 to 2022 Figure 176: Central Asia Market Volume (Tonnes) Analysis By Country, 2015 to 2033 Figure 177: Central Asia Market Value Share (%) and BPS Analysis By Country, 2023 & 2033 Figure 178: Central Asia Market Y-o-Y Growth (%) Projections By Country, 2023 to 2033 Figure 179: Central Asia Market Value (US$ Million) Analysis by Product Type, 2015 to 2022 Figure 180: Central Asia Market Volume (Tonnes) Analysis by Product Type, 2015 to 2033 Figure 181: Central Asia Market Value Share (%) and BPS Analysis by Product Type, 2023 & 2033 Figure 182: Central Asia Market Y-o-Y Growth (%) Projections by Product Type, 2023 to 2033 Figure 183: Central Asia Market Value (US$ Million) Analysis by Product Type, 2015 to 2022 Figure 184: Central Asia Market Volume (Tonnes) Analysis by Product Type, 2015 to 2033 Figure 185: Central Asia Market Value Share (%) and BPS Analysis by Product Type, 2023 & 2033 Figure 186: Central Asia Market Y-o-Y Growth (%) Projections by Product Type, 2023 to 2033 Figure 187: Central Asia Market Value (US$ Million) Analysis By Lamination Type, 2015 to 2022 Figure 188: Central Asia Market Volume (Tonnes) Analysis By Lamination Type, 2015 to 2033 Figure 189: Central Asia Market Value Share (%) and BPS Analysis By Lamination Type, 2023 & 2033 Figure 190: Central Asia Market Y-o-Y Growth (%) Projections By Lamination Type, 2023 to 2033 Figure 187: Central Asia Market Value (US$ Million) Analysis by End Use, 2015 to 2022 Figure 188: Central Asia Market Volume (Tonnes) Analysis by End Use, 2015 to 2033 Figure 189: Central Asia Market Value Share (%) and BPS Analysis by End Use, 2023 & 2033 Figure 190: Central Asia Market Y-o-Y Growth (%) Projections by End Use, 2023 to 2033 Figure 191: Central Asia Market Attractiveness by Product Type, 2023 to 2033 Figure 192: Central Asia Market Attractiveness by Product Type, 2023 to 2033 Figure 193: Central Asia Market Attractiveness By Lamination Type, 2023 to 2033 Figure 193: Central Asia Market Attractiveness by End Use, 2023 to 2033 Figure 194: Central Asia Market Attractiveness By Country, 2023 to 2033 Figure 195: Russia & Belarus Market Value (US$ Million) by Product Type, 2023 to 2033 Figure 196: Russia & Belarus Market Value (US$ Million) by Product Type, 2023 to 2033 Figure 197: Russia & Belarus Market Value (US$ Million) By Lamination Type, 2023 to 2033 Figure 198: Russia & Belarus Market Value (US$ Million) By Country, 2023 to 2033 Figure 199: Russia & Belarus Market Value (US$ Million) Analysis By Country, 2015 to 2022 Figure 200: Russia & Belarus Market Volume (Tonnes) Analysis By Country, 2015 to 2033 Figure 201: Russia & Belarus Market Value Share (%) and BPS Analysis By Country, 2023 & 2033 Figure 202: Russia & Belarus Market Y-o-Y Growth (%) Projections By Country, 2023 to 2033 Figure 203: Russia & Belarus Market Value (US$ Million) Analysis by Product Type, 2015 to 2022 Figure 204: Russia & Belarus Market Volume (Tonnes) Analysis by Product Type, 2015 to 2033 Figure 205: Russia & Belarus Market Value Share (%) and BPS Analysis by Product Type, 2023 & 2033 Figure 206: Russia & Belarus Market Y-o-Y Growth (%) Projections by Product Type, 2023 to 2033 Figure 207: Russia & Belarus Market Value (US$ Million) Analysis by Product Type, 2015 to 2022 Figure 208: Russia & Belarus Market Volume (Tonnes) Analysis by Product Type, 2015 to 2033 Figure 209: Russia & Belarus Market Value Share (%) and BPS Analysis by Product Type, 2023 & 2033 Figure 210: Russia & Belarus Market Y-o-Y Growth (%) Projections by Product Type, 2023 to 2033 Figure 211: Russia & Belarus Market Value (US$ Million) Analysis By Lamination Type, 2015 to 2022 Figure 212: Russia & Belarus Market Volume (Tonnes) Analysis By Lamination Type, 2015 to 2033 Figure 213: Russia & Belarus Market Value Share (%) and BPS Analysis By Lamination Type, 2023 & 2033 Figure 214: Russia & Belarus Market Y-o-Y Growth (%) Projections By Lamination Type, 2023 to 2033 Figure 211: Russia & Belarus Market Value (US$ Million) Analysis by End Use, 2015 to 2022 Figure 212: Russia & Belarus Market Volume (Tonnes) Analysis by End Use, 2015 to 2033 Figure 213: Russia & Belarus Market Value Share (%) and BPS Analysis by End Use, 2023 & 2033 Figure 214: Russia & Belarus Market Y-o-Y Growth (%) Projections by End Use, 2023 to 2033 Figure 215: Russia & Belarus Market Attractiveness by Product Type, 2023 to 2033 Figure 216: Russia & Belarus Market Attractiveness by Product Type, 2023 to 2033 Figure 217: Russia & Belarus Market Attractiveness By Lamination Type, 2023 to 2033 Figure 217: Russia & Belarus Market Attractiveness by End Use, 2023 to 2033 Figure 218: Russia & Belarus Market Attractiveness By Country, 2023 to 2033 Figure 219: Balkan Countries Market Value (US$ Million) by Product Type, 2023 to 2033 Figure 220: Balkan Countries Market Value (US$ Million) by Product Type, 2023 to 2033 Figure 221: Balkan Countries Market Value (US$ Million) By Lamination Type, 2023 to 2033 Figure 222: Balkan Countries Market Value (US$ Million) By Country, 2023 to 2033 Figure 223: Balkan Countries Market Value (US$ Million) Analysis By Country, 2015 to 2022 Figure 224: Balkan Countries Market Volume (Tonnes) Analysis By Country, 2015 to 2033 Figure 225: Balkan Countries Market Value Share (%) and BPS Analysis By Country, 2023 & 2033 Figure 226: Balkan Countries Market Y-o-Y Growth (%) Projections By Country, 2023 to 2033 Figure 227: Balkan Countries Market Value (US$ Million) Analysis by Product Type, 2015 to 2022 Figure 228: Balkan Countries Market Volume (Tonnes) Analysis by Product Type, 2015 to 2033 Figure 229: Balkan Countries Market Value Share (%) and BPS Analysis by Product Type, 2023 & 2033 Figure 230: Balkan Countries Market Y-o-Y Growth (%) Projections by Product Type, 2023 to 2033 Figure 231: Balkan Countries Market Value (US$ Million) Analysis by Product Type, 2015 to 2022 Figure 232: Balkan Countries Market Volume (Tonnes) Analysis by Product Type, 2015 to 2033 Figure 233: Balkan Countries Market Value Share (%) and BPS Analysis by Product Type, 2023 & 2033 Figure 234: Balkan Countries Market Y-o-Y Growth (%) Projections by Product Type, 2023 to 2033 Figure 235: Balkan Countries Market Value (US$ Million) Analysis By Lamination Type, 2015 to 2022 Figure 236: Balkan Countries Market Volume (Tonnes) Analysis By Lamination Type, 2015 to 2033 Figure 237: Balkan Countries Market Value Share (%) and BPS Analysis By Lamination Type, 2023 & 2033 Figure 238: Balkan Countries Market Y-o-Y Growth (%) Projections By Lamination Type, 2023 to 2033 Figure 235: Balkan Countries Market Value (US$ Million) Analysis by End Use, 2015 to 2022 Figure 236: Balkan Countries Market Volume (Tonnes) Analysis by End Use, 2015 to 2033 Figure 237: Balkan Countries Market Value Share (%) and BPS Analysis by End Use, 2023 & 2033 Figure 238: Balkan Countries Market Y-o-Y Growth (%) Projections by End Use, 2023 to 2033 Figure 239: Balkan Countries Market Attractiveness by Product Type, 2023 to 2033 Figure 240: Balkan Countries Market Attractiveness by Product Type, 2023 to 2033 Figure 241: Balkan Countries Market Attractiveness By Lamination Type, 2023 to 2033 Figure 241: Balkan Countries Market Attractiveness by End Use, 2023 to 2033 Figure 242: Balkan Countries Market Attractiveness By Country, 2023 to 2033 Figure 243: Baltic Countries Market Value (US$ Million) by Product Type, 2023 to 2033 Figure 244: Baltic Countries Market Value (US$ Million) by Product Type, 2023 to 2033 Figure 245: Baltic Countries Market Value (US$ Million) By Lamination Type, 2023 to 2033 Figure 245: Baltic Countries Market Value (US$ Million) by End Use, 2023 to 2033 Figure 246: Baltic Countries Market Value (US$ Million) By Country, 2023 to 2033 Figure 247: Baltic Countries Market Value (US$ Million) Analysis By Country, 2015 to 2022 Figure 248: Baltic Countries Market Volume (Tonnes) Analysis By Country, 2015 to 2033 Figure 249: Baltic Countries Market Value Share (%) and BPS Analysis By Country, 2023 & 2033 Figure 250: Baltic Countries Market Y-o-Y Growth (%) Projections By Country, 2023 to 2033 Figure 251: Baltic Countries Market Value (US$ Million) Analysis by Product Type, 2015 to 2022 Figure 252: Baltic Countries Market Volume (Tonnes) Analysis by Product Type, 2015 to 2033 Figure 253: Baltic Countries Market Value Share (%) and BPS Analysis by Product Type, 2023 & 2033 Figure 254: Baltic Countries Market Y-o-Y Growth (%) Projections by Product Type, 2023 to 2033 Figure 255: Baltic Countries Market Value (US$ Million) Analysis by Product Type, 2015 to 2022 Figure 256: Baltic Countries Market Volume (Tonnes) Analysis by Product Type, 2015 to 2033 Figure 257: Baltic Countries Market Value Share (%) and BPS Analysis by Product Type, 2023 & 2033 Figure 258: Baltic Countries Market Y-o-Y Growth (%) Projections by Product Type, 2023 to 2033 Figure 259: Baltic Countries Market Value (US$ Million) Analysis By Lamination Type, 2015 to 2022 Figure 260: Baltic Countries Market Volume (Tonnes) Analysis By Lamination Type, 2015 to 2033 Figure 261: Baltic Countries Market Value Share (%) and BPS Analysis By Lamination Type, 2023 & 2033 Figure 262: Baltic Countries Market Y-o-Y Growth (%) Projections By Lamination Type, 2023 to 2033 Figure 259: Baltic Countries Market Value (US$ Million) Analysis by End Use, 2015 to 2022 Figure 260: Baltic Countries Market Volume (Tonnes) Analysis by End Use, 2015 to 2033 Figure 261: Baltic Countries Market Value Share (%) and BPS Analysis End Use, 2023 & 2033 Figure 262: Baltic Countries Market Y-o-Y Growth (%) Projections by End Use, 2023 to 2033 Figure 263: Baltic Countries Market Attractiveness by Product Type, 2023 to 2033 Figure 264: Baltic Countries Market Attractiveness by Product Type, 2023 to 2033 Figure 265: Baltic Countries Market Attractiveness By Lamination Type, 2023 to 2033 Figure 266: Baltic Countries Market Attractiveness By Country, 2023 to 2033 Figure 267: Middle East & Africa Market Value (US$ Million) by Product Type, 2023 to 2033 Figure 268: Middle East & Africa Market Value (US$ Million) By Material, 2023 to 2033 Figure 269: Middle East & Africa Market Value (US$ Million) By Lamination Type, 2023 to 2033 Figure 269: Middle East & Africa Market Value (US$ Million) by End Use, 2023 to 2033 Figure 270: Middle East & Africa Market Value (US$ Million) By Country, 2023 to 2033 Figure 271: Middle East & Africa Market Value (US$ Million) Analysis By Country, 2015 to 2022 Figure 272: Middle East & Africa Market Volume (Tonnes) Analysis By Country, 2015 to 2033 Figure 273: Middle East & Africa Market Value Share (%) and BPS Analysis By Country, 2023 & 2033 Figure 274: Middle East & Africa Market Y-o-Y Growth (%) Projections By Country, 2023 to 2033 Figure 275: Middle East & Africa Market Value (US$ Million) Analysis by Product Type, 2015 to 2022 Figure 276: Middle East & Africa Market Volume (Tonnes) Analysis by Product Type, 2015 to 2033 Figure 277: Middle East & Africa Market Value Share (%) and BPS Analysis by Product Type, 2023 & 2033 Figure 278: Middle East & Africa Market Y-o-Y Growth (%) Projections by Product Type, 2023 to 2033 Figure 279: Middle East & Africa Market Value (US$ Million) Analysis By Material, 2015 to 2022 Figure 280: Middle East & Africa Market Volume (Tonnes) Analysis By Material, 2015 to 2033 Figure 281: Middle East & Africa Market Value Share (%) and BPS Analysis By Material, 2023 & 2033 Figure 282: Middle East & Africa Market Y-o-Y Growth (%) Projections By Material, 2023 to 2033 Figure 283: Middle East & Africa Market Value (US$ Million) Analysis By Lamination Type, 2015 to 2022 Figure 284: Middle East & Africa Market Volume (Tonnes) Analysis By Lamination Type, 2015 to 2033 Figure 285: Middle East & Africa Market Value Share (%) and BPS Analysis By Lamination Type, 2023 & 2033 Figure 286: Middle East & Africa Market Y-o-Y Growth (%) Projections By Lamination Type, 2023 to 2033 Figure 283: Middle East & Africa Market Value (US$ Million) Analysis by End Use, 2015 to 2022 Figure 284: Middle East & Africa Market Volume (Tonnes) Analysis by End Use, 2015 to 2033 Figure 285: Middle East & Africa Market Value Share (%) and BPS Analysis by End Use, 2023 & 2033 Figure 286: Middle East & Africa Market Y-o-Y Growth (%) Projections by End Use, 2023 to 2033 Figure 287: Middle East & Africa Market Attractiveness by Product Type, 2023 to 2033 Figure 288: Middle East & Africa Market Attractiveness By Material, 2023 to 2033 Figure 289: Middle East & Africa Market Attractiveness By Lamination Type, 2023 to 2033 Figure 290: Middle East & Africa Market Attractiveness By Country, 2023 to 2033
Recommendations
Explore Packaging Insights
View Reports