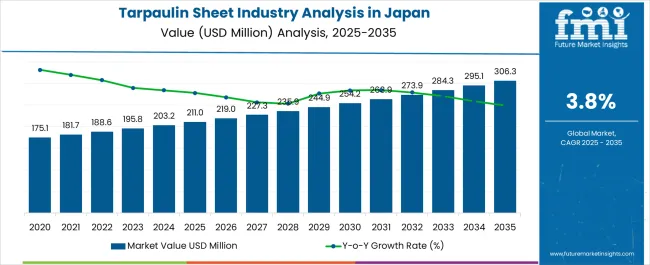
Demand for Tarpaulin Sheets in Japan is anticipated to exhibit a steady CAGR of 3.8% through 2033. The tarpaulin sheets industry is anticipated to grow considerably, surging from USD 195.8 million in 2023 to around USD 284.7 million by the end of 2033.
Attributes | Key Statistics |
---|---|
Base Year Value (2023) | USD 195.8 million |
Anticipated Forecast Value (2033) | USD 284.7 million |
Estimated Growth (2023 to 2033) | 3.8% CAGR |
Tarpaulin Sheets find their Application in Natural-disaster-prone Japan
Japan is highly susceptible to multiple natural disasters, such as typhoons, earthquakes, tsunamis, and regular landslides. In emergency situations like these, tarpaulin sheets play a significant role in covering damaged roofs, walls, and creating temporary partitions for displaced people and animals. Their demand in Japan is also driven by the fact that they provide a quick and cost-effective solution for temporary housing.
Tarpaulin sheets are also in high demand as they are used to cover essential goods and items, protecting them from heavy rains. Japan's government also strongly emphasizes disaster preparedness and often stockpiles large quantities of tarpaulin sheets in strategic areas.
Adoption Analysis of Tarpaulin Sheets in Japan:
Hoarding tarps find their prime application in commercial construction spaces. In 2023, the hoarding tarps segment accounts for a whopping 34.6% of the share.
Product Type | Hoarding Tarps |
---|---|
Value share | 34.6% |
Japan has a high population density, particularly in urban areas. With limited space and close proximity to buildings, construction sites often need to use hoarding tarps to maintain privacy and safety. Therefore, local regulations and city ordinances in Japan often require construction sites to install hoarding tarps as a safety measure to protect pedestrians from construction-related hazards and debris.
Hoarding tarps are also used to help maintain a visually pleasing appearance during construction. They do this by concealing the work site and providing the building a clean, vibrant, and aesthetic look.
When it comes to end-use, the agricultural sector accounts for 26.8% share of Japan’s tarpaulin sheets industry. Tarpaulin sheets are used to create temporary partitions to segregate different groups of animals on the farm. They can also be used to store water as they stop water from sipping in the ground.
End Use | Agriculture |
---|---|
Value share | 26.8% |
The demand for tarpaulin sheets in agriculture is also driven by their extensive use in curating micro-climatic conditions in horticulture. These sheets can protect plants from harmful radiation and external dust. As the agriculture sector continues to use advanced farming techniques, the demand for tarpaulin sheets in the upcoming years is set to experience a considerable surge in Japan.
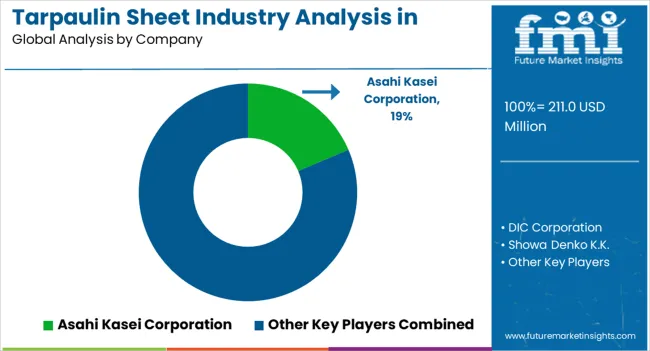
The competitive scenario of the tarpaulin sheet business in Japan has become highly saturated and predictable. There is already a presence of numerous well-established players who have built a trustworthy reputation in the minds of Japanese consumers.
The landscape has limited space for new entrants, but the situation is gradually evolving. Many smaller Japanese companies offer affordable and efficient options that cater to budget-conscious consumers. These new players are attracting consumers concerned about the ecological impacts of using conventional tarpaulin sheets made from plastic. To sum it up, the competition is a blend of old and new, local and global players, and traditional and eco-conscious consumers.
Recent Developments Tarpaulin Sheets Manufacturing in Japan
Attribute | Details |
---|---|
Estimated Valuation (2023) | USD 195.8 million |
Projected Valuation (2033) | USD 284.7 million |
Anticipated CAGR (2023 to 2033) | 3.8% CAGR |
Historical Analysis of Demand for Tarpaulin Sheets in Japan | 2018 to 2022 |
Demand Forecast for Tarpaulin Sheets in Japan | 2023 to 2033 |
Quantitative Units | Revenue in USD million and CAGR from 2023 to 2033 |
Report Coverage | Revenue Forecast, Company Ranking, Competitive Landscape, Growth Factors, Trends and Pricing Analysis |
Key Countries Analyzed while Studying Opportunities in Tarpaulin Sheets in Japan | Kanto, Chubu, Kinki, Kyushu & Okinawa, Tohoku, Rest of Japan |
Key Companies Profiled | DIC Corporation; Showa Denko K.K.; Asahi Kasei Corporation; NHK Group; Gyoha Co., Ltd.; Taimatsu Tarpaulin Co., Ltd.; Tohoku Tarpaulin Co., Ltd.; Nishiki Tarpaulin Co., Ltd.; Asahi Tarpaulin Co., Ltd.; Daiwa Tarpaulin Co., Ltd.; Nippon Tarpaulin Co., Ltd. |
Table 1: Japan Industry Analysis and Outlook Value (US$ Million) Forecast by Region, 2018 to 2033
Table 2: Japan Industry Analysis and Outlook Volume (Sq. Meter) Forecast by Region, 2018 to 2033
Table 3: Japan Industry Analysis and Outlook Value (US$ Million) Forecast by Lamination Type, 2018 to 2033
Table 4: Japan Industry Analysis and Outlook Volume (Sq. Meter) Forecast by Lamination Type, 2018 to 2033
Table 5: Japan Industry Analysis and Outlook Value (US$ Million) Forecast by Material Type, 2018 to 2033
Table 6: Japan Industry Analysis and Outlook Volume (Sq. Meter) Forecast by Material Type, 2018 to 2033
Table 7: Japan Industry Analysis and Outlook Value (US$ Million) Forecast by Product Type, 2018 to 2033
Table 8: Japan Industry Analysis and Outlook Volume (Sq. Meter) Forecast by Product Type, 2018 to 2033
Table 9: Japan Industry Analysis and Outlook Value (US$ Million) Forecast by Product Weight, 2018 to 2033
Table 10: Japan Industry Analysis and Outlook Volume (Sq. Meter) Forecast by Product Weight, 2018 to 2033
Table 11: Japan Industry Analysis and Outlook Value (US$ Million) Forecast by End Use, 2018 to 2033
Table 12: Japan Industry Analysis and Outlook Volume (Sq. Meter) Forecast by End Use, 2018 to 2033
Table 13: Kanto Industry Analysis and Outlook Value (US$ Million) Forecast by Lamination Type, 2018 to 2033
Table 14: Kanto Industry Analysis and Outlook Volume (Sq. Meter) Forecast by Lamination Type, 2018 to 2033
Table 15: Kanto Industry Analysis and Outlook Value (US$ Million) Forecast by Material Type, 2018 to 2033
Table 16: Kanto Industry Analysis and Outlook Volume (Sq. Meter) Forecast by Material Type, 2018 to 2033
Table 17: Kanto Industry Analysis and Outlook Value (US$ Million) Forecast by Product Type, 2018 to 2033
Table 18: Kanto Industry Analysis and Outlook Volume (Sq. Meter) Forecast by Product Type, 2018 to 2033
Table 19: Kanto Industry Analysis and Outlook Value (US$ Million) Forecast by Product Weight, 2018 to 2033
Table 20: Kanto Industry Analysis and Outlook Volume (Sq. Meter) Forecast by Product Weight, 2018 to 2033
Table 21: Kanto Industry Analysis and Outlook Value (US$ Million) Forecast by End Use, 2018 to 2033
Table 22: Kanto Industry Analysis and Outlook Volume (Sq. Meter) Forecast by End Use, 2018 to 2033
Table 23: Chubu Industry Analysis and Outlook Value (US$ Million) Forecast by Lamination Type, 2018 to 2033
Table 24: Chubu Industry Analysis and Outlook Volume (Sq. Meter) Forecast by Lamination Type, 2018 to 2033
Table 25: Chubu Industry Analysis and Outlook Value (US$ Million) Forecast by Material Type, 2018 to 2033
Table 26: Chubu Industry Analysis and Outlook Volume (Sq. Meter) Forecast by Material Type, 2018 to 2033
Table 27: Chubu Industry Analysis and Outlook Value (US$ Million) Forecast by Product Type, 2018 to 2033
Table 28: Chubu Industry Analysis and Outlook Volume (Sq. Meter) Forecast by Product Type, 2018 to 2033
Table 29: Chubu Industry Analysis and Outlook Value (US$ Million) Forecast by Product Weight, 2018 to 2033
Table 30: Chubu Industry Analysis and Outlook Volume (Sq. Meter) Forecast by Product Weight, 2018 to 2033
Table 31: Chubu Industry Analysis and Outlook Value (US$ Million) Forecast by End Use, 2018 to 2033
Table 32: Chubu Industry Analysis and Outlook Volume (Sq. Meter) Forecast by End Use, 2018 to 2033
Table 33: Kinki Industry Analysis and Outlook Value (US$ Million) Forecast by Lamination Type, 2018 to 2033
Table 34: Kinki Industry Analysis and Outlook Volume (Sq. Meter) Forecast by Lamination Type, 2018 to 2033
Table 35: Kinki Industry Analysis and Outlook Value (US$ Million) Forecast by Material Type, 2018 to 2033
Table 36: Kinki Industry Analysis and Outlook Volume (Sq. Meter) Forecast by Material Type, 2018 to 2033
Table 37: Kinki Industry Analysis and Outlook Value (US$ Million) Forecast by Product Type, 2018 to 2033
Table 38: Kinki Industry Analysis and Outlook Volume (Sq. Meter) Forecast by Product Type, 2018 to 2033
Table 39: Kinki Industry Analysis and Outlook Value (US$ Million) Forecast by Product Weight, 2018 to 2033
Table 40: Kinki Industry Analysis and Outlook Volume (Sq. Meter) Forecast by Product Weight, 2018 to 2033
Table 41: Kinki Industry Analysis and Outlook Value (US$ Million) Forecast by End Use, 2018 to 2033
Table 42: Kinki Industry Analysis and Outlook Volume (Sq. Meter) Forecast by End Use, 2018 to 2033
Table 43: Kyushu & Okinawa Industry Analysis and Outlook Value (US$ Million) Forecast by Lamination Type, 2018 to 2033
Table 44: Kyushu & Okinawa Industry Analysis and Outlook Volume (Sq. Meter) Forecast by Lamination Type, 2018 to 2033
Table 45: Kyushu & Okinawa Industry Analysis and Outlook Value (US$ Million) Forecast by Material Type, 2018 to 2033
Table 46: Kyushu & Okinawa Industry Analysis and Outlook Volume (Sq. Meter) Forecast by Material Type, 2018 to 2033
Table 47: Kyushu & Okinawa Industry Analysis and Outlook Value (US$ Million) Forecast by Product Type, 2018 to 2033
Table 48: Kyushu & Okinawa Industry Analysis and Outlook Volume (Sq. Meter) Forecast by Product Type, 2018 to 2033
Table 49: Kyushu & Okinawa Industry Analysis and Outlook Value (US$ Million) Forecast by Product Weight, 2018 to 2033
Table 50: Kyushu & Okinawa Industry Analysis and Outlook Volume (Sq. Meter) Forecast by Product Weight, 2018 to 2033
Table 51: Kyushu & Okinawa Industry Analysis and Outlook Value (US$ Million) Forecast by End Use, 2018 to 2033
Table 52: Kyushu & Okinawa Industry Analysis and Outlook Volume (Sq. Meter) Forecast by End Use, 2018 to 2033
Table 53: Tohoku Industry Analysis and Outlook Value (US$ Million) Forecast by Lamination Type, 2018 to 2033
Table 54: Tohoku Industry Analysis and Outlook Volume (Sq. Meter) Forecast by Lamination Type, 2018 to 2033
Table 55: Tohoku Industry Analysis and Outlook Value (US$ Million) Forecast by Material Type, 2018 to 2033
Table 56: Tohoku Industry Analysis and Outlook Volume (Sq. Meter) Forecast by Material Type, 2018 to 2033
Table 57: Tohoku Industry Analysis and Outlook Value (US$ Million) Forecast by Product Type, 2018 to 2033
Table 58: Tohoku Industry Analysis and Outlook Volume (Sq. Meter) Forecast by Product Type, 2018 to 2033
Table 59: Tohoku Industry Analysis and Outlook Value (US$ Million) Forecast by Product Weight, 2018 to 2033
Table 60: Tohoku Industry Analysis and Outlook Volume (Sq. Meter) Forecast by Product Weight, 2018 to 2033
Table 61: Tohoku Industry Analysis and Outlook Value (US$ Million) Forecast by End Use, 2018 to 2033
Table 62: Tohoku Industry Analysis and Outlook Volume (Sq. Meter) Forecast by End Use, 2018 to 2033
Table 63: Rest of Japan Industry Analysis and Outlook Value (US$ Million) Forecast by Lamination Type, 2018 to 2033
Table 64: Rest of Japan Industry Analysis and Outlook Volume (Sq. Meter) Forecast by Lamination Type, 2018 to 2033
Table 65: Rest of Japan Industry Analysis and Outlook Value (US$ Million) Forecast by Material Type, 2018 to 2033
Table 66: Rest of Japan Industry Analysis and Outlook Volume (Sq. Meter) Forecast by Material Type, 2018 to 2033
Table 67: Rest of Japan Industry Analysis and Outlook Value (US$ Million) Forecast by Product Type, 2018 to 2033
Table 68: Rest of Japan Industry Analysis and Outlook Volume (Sq. Meter) Forecast by Product Type, 2018 to 2033
Table 69: Rest of Japan Industry Analysis and Outlook Value (US$ Million) Forecast by Product Weight, 2018 to 2033
Table 70: Rest of Japan Industry Analysis and Outlook Volume (Sq. Meter) Forecast by Product Weight, 2018 to 2033
Table 71: Rest of Japan Industry Analysis and Outlook Value (US$ Million) Forecast by End Use, 2018 to 2033
Table 72: Rest of Japan Industry Analysis and Outlook Volume (Sq. Meter) Forecast by End Use, 2018 to 2033
Figure 1: Japan Industry Analysis and Outlook Value (US$ Million) by Lamination Type, 2023 to 2033
Figure 2: Japan Industry Analysis and Outlook Value (US$ Million) by Material Type, 2023 to 2033
Figure 3: Japan Industry Analysis and Outlook Value (US$ Million) by Product Type, 2023 to 2033
Figure 4: Japan Industry Analysis and Outlook Value (US$ Million) by Product Weight, 2023 to 2033
Figure 5: Japan Industry Analysis and Outlook Value (US$ Million) by End Use, 2023 to 2033
Figure 6: Japan Industry Analysis and Outlook Value (US$ Million) by Region, 2023 to 2033
Figure 7: Japan Industry Analysis and Outlook Value (US$ Million) Analysis by Region, 2018 to 2033
Figure 8: Japan Industry Analysis and Outlook Volume (Sq. Meter) Analysis by Region, 2018 to 2033
Figure 9: Japan Industry Analysis and Outlook Value Share (%) and BPS Analysis by Region, 2023 to 2033
Figure 10: Japan Industry Analysis and Outlook Y-o-Y Growth (%) Projections by Region, 2023 to 2033
Figure 11: Japan Industry Analysis and Outlook Value (US$ Million) Analysis by Lamination Type, 2018 to 2033
Figure 12: Japan Industry Analysis and Outlook Volume (Sq. Meter) Analysis by Lamination Type, 2018 to 2033
Figure 13: Japan Industry Analysis and Outlook Value Share (%) and BPS Analysis by Lamination Type, 2023 to 2033
Figure 14: Japan Industry Analysis and Outlook Y-o-Y Growth (%) Projections by Lamination Type, 2023 to 2033
Figure 15: Japan Industry Analysis and Outlook Value (US$ Million) Analysis by Material Type, 2018 to 2033
Figure 16: Japan Industry Analysis and Outlook Volume (Sq. Meter) Analysis by Material Type, 2018 to 2033
Figure 17: Japan Industry Analysis and Outlook Value Share (%) and BPS Analysis by Material Type, 2023 to 2033
Figure 18: Japan Industry Analysis and Outlook Y-o-Y Growth (%) Projections by Material Type, 2023 to 2033
Figure 19: Japan Industry Analysis and Outlook Value (US$ Million) Analysis by Product Type, 2018 to 2033
Figure 20: Japan Industry Analysis and Outlook Volume (Sq. Meter) Analysis by Product Type, 2018 to 2033
Figure 21: Japan Industry Analysis and Outlook Value Share (%) and BPS Analysis by Product Type, 2023 to 2033
Figure 22: Japan Industry Analysis and Outlook Y-o-Y Growth (%) Projections by Product Type, 2023 to 2033
Figure 23: Japan Industry Analysis and Outlook Value (US$ Million) Analysis by Product Weight, 2018 to 2033
Figure 24: Japan Industry Analysis and Outlook Volume (Sq. Meter) Analysis by Product Weight, 2018 to 2033
Figure 25: Japan Industry Analysis and Outlook Value Share (%) and BPS Analysis by Product Weight, 2023 to 2033
Figure 26: Japan Industry Analysis and Outlook Y-o-Y Growth (%) Projections by Product Weight, 2023 to 2033
Figure 27: Japan Industry Analysis and Outlook Value (US$ Million) Analysis by End Use, 2018 to 2033
Figure 28: Japan Industry Analysis and Outlook Volume (Sq. Meter) Analysis by End Use, 2018 to 2033
Figure 29: Japan Industry Analysis and Outlook Value Share (%) and BPS Analysis by End Use, 2023 to 2033
Figure 30: Japan Industry Analysis and Outlook Y-o-Y Growth (%) Projections by End Use, 2023 to 2033
Figure 31: Japan Industry Analysis and Outlook Attractiveness by Lamination Type, 2023 to 2033
Figure 32: Japan Industry Analysis and Outlook Attractiveness by Material Type, 2023 to 2033
Figure 33: Japan Industry Analysis and Outlook Attractiveness by Product Type, 2023 to 2033
Figure 34: Japan Industry Analysis and Outlook Attractiveness by Product Weight, 2023 to 2033
Figure 35: Japan Industry Analysis and Outlook Attractiveness by End Use, 2023 to 2033
Figure 36: Japan Industry Analysis and Outlook Attractiveness by Region, 2023 to 2033
Figure 37: Kanto Industry Analysis and Outlook Value (US$ Million) by Lamination Type, 2023 to 2033
Figure 38: Kanto Industry Analysis and Outlook Value (US$ Million) by Material Type, 2023 to 2033
Figure 39: Kanto Industry Analysis and Outlook Value (US$ Million) by Product Type, 2023 to 2033
Figure 40: Kanto Industry Analysis and Outlook Value (US$ Million) by Product Weight, 2023 to 2033
Figure 41: Kanto Industry Analysis and Outlook Value (US$ Million) by End Use, 2023 to 2033
Figure 42: Kanto Industry Analysis and Outlook Value (US$ Million) Analysis by Lamination Type, 2018 to 2033
Figure 43: Kanto Industry Analysis and Outlook Volume (Sq. Meter) Analysis by Lamination Type, 2018 to 2033
Figure 44: Kanto Industry Analysis and Outlook Value Share (%) and BPS Analysis by Lamination Type, 2023 to 2033
Figure 45: Kanto Industry Analysis and Outlook Y-o-Y Growth (%) Projections by Lamination Type, 2023 to 2033
Figure 46: Kanto Industry Analysis and Outlook Value (US$ Million) Analysis by Material Type, 2018 to 2033
Figure 47: Kanto Industry Analysis and Outlook Volume (Sq. Meter) Analysis by Material Type, 2018 to 2033
Figure 48: Kanto Industry Analysis and Outlook Value Share (%) and BPS Analysis by Material Type, 2023 to 2033
Figure 49: Kanto Industry Analysis and Outlook Y-o-Y Growth (%) Projections by Material Type, 2023 to 2033
Figure 50: Kanto Industry Analysis and Outlook Value (US$ Million) Analysis by Product Type, 2018 to 2033
Figure 51: Kanto Industry Analysis and Outlook Volume (Sq. Meter) Analysis by Product Type, 2018 to 2033
Figure 52: Kanto Industry Analysis and Outlook Value Share (%) and BPS Analysis by Product Type, 2023 to 2033
Figure 53: Kanto Industry Analysis and Outlook Y-o-Y Growth (%) Projections by Product Type, 2023 to 2033
Figure 54: Kanto Industry Analysis and Outlook Value (US$ Million) Analysis by Product Weight, 2018 to 2033
Figure 55: Kanto Industry Analysis and Outlook Volume (Sq. Meter) Analysis by Product Weight, 2018 to 2033
Figure 56: Kanto Industry Analysis and Outlook Value Share (%) and BPS Analysis by Product Weight, 2023 to 2033
Figure 57: Kanto Industry Analysis and Outlook Y-o-Y Growth (%) Projections by Product Weight, 2023 to 2033
Figure 58: Kanto Industry Analysis and Outlook Value (US$ Million) Analysis by End Use, 2018 to 2033
Figure 59: Kanto Industry Analysis and Outlook Volume (Sq. Meter) Analysis by End Use, 2018 to 2033
Figure 60: Kanto Industry Analysis and Outlook Value Share (%) and BPS Analysis by End Use, 2023 to 2033
Figure 61: Kanto Industry Analysis and Outlook Y-o-Y Growth (%) Projections by End Use, 2023 to 2033
Figure 62: Kanto Industry Analysis and Outlook Attractiveness by Lamination Type, 2023 to 2033
Figure 63: Kanto Industry Analysis and Outlook Attractiveness by Material Type, 2023 to 2033
Figure 64: Kanto Industry Analysis and Outlook Attractiveness by Product Type, 2023 to 2033
Figure 65: Kanto Industry Analysis and Outlook Attractiveness by Product Weight, 2023 to 2033
Figure 66: Kanto Industry Analysis and Outlook Attractiveness by End Use, 2023 to 2033
Figure 67: Chubu Industry Analysis and Outlook Value (US$ Million) by Lamination Type, 2023 to 2033
Figure 68: Chubu Industry Analysis and Outlook Value (US$ Million) by Material Type, 2023 to 2033
Figure 69: Chubu Industry Analysis and Outlook Value (US$ Million) by Product Type, 2023 to 2033
Figure 70: Chubu Industry Analysis and Outlook Value (US$ Million) by Product Weight, 2023 to 2033
Figure 71: Chubu Industry Analysis and Outlook Value (US$ Million) by End Use, 2023 to 2033
Figure 72: Chubu Industry Analysis and Outlook Value (US$ Million) Analysis by Lamination Type, 2018 to 2033
Figure 73: Chubu Industry Analysis and Outlook Volume (Sq. Meter) Analysis by Lamination Type, 2018 to 2033
Figure 74: Chubu Industry Analysis and Outlook Value Share (%) and BPS Analysis by Lamination Type, 2023 to 2033
Figure 75: Chubu Industry Analysis and Outlook Y-o-Y Growth (%) Projections by Lamination Type, 2023 to 2033
Figure 76: Chubu Industry Analysis and Outlook Value (US$ Million) Analysis by Material Type, 2018 to 2033
Figure 77: Chubu Industry Analysis and Outlook Volume (Sq. Meter) Analysis by Material Type, 2018 to 2033
Figure 78: Chubu Industry Analysis and Outlook Value Share (%) and BPS Analysis by Material Type, 2023 to 2033
Figure 79: Chubu Industry Analysis and Outlook Y-o-Y Growth (%) Projections by Material Type, 2023 to 2033
Figure 80: Chubu Industry Analysis and Outlook Value (US$ Million) Analysis by Product Type, 2018 to 2033
Figure 81: Chubu Industry Analysis and Outlook Volume (Sq. Meter) Analysis by Product Type, 2018 to 2033
Figure 82: Chubu Industry Analysis and Outlook Value Share (%) and BPS Analysis by Product Type, 2023 to 2033
Figure 83: Chubu Industry Analysis and Outlook Y-o-Y Growth (%) Projections by Product Type, 2023 to 2033
Figure 84: Chubu Industry Analysis and Outlook Value (US$ Million) Analysis by Product Weight, 2018 to 2033
Figure 85: Chubu Industry Analysis and Outlook Volume (Sq. Meter) Analysis by Product Weight, 2018 to 2033
Figure 86: Chubu Industry Analysis and Outlook Value Share (%) and BPS Analysis by Product Weight, 2023 to 2033
Figure 87: Chubu Industry Analysis and Outlook Y-o-Y Growth (%) Projections by Product Weight, 2023 to 2033
Figure 88: Chubu Industry Analysis and Outlook Value (US$ Million) Analysis by End Use, 2018 to 2033
Figure 89: Chubu Industry Analysis and Outlook Volume (Sq. Meter) Analysis by End Use, 2018 to 2033
Figure 90: Chubu Industry Analysis and Outlook Value Share (%) and BPS Analysis by End Use, 2023 to 2033
Figure 91: Chubu Industry Analysis and Outlook Y-o-Y Growth (%) Projections by End Use, 2023 to 2033
Figure 92: Chubu Industry Analysis and Outlook Attractiveness by Lamination Type, 2023 to 2033
Figure 93: Chubu Industry Analysis and Outlook Attractiveness by Material Type, 2023 to 2033
Figure 94: Chubu Industry Analysis and Outlook Attractiveness by Product Type, 2023 to 2033
Figure 95: Chubu Industry Analysis and Outlook Attractiveness by Product Weight, 2023 to 2033
Figure 96: Chubu Industry Analysis and Outlook Attractiveness by End Use, 2023 to 2033
Figure 97: Kinki Industry Analysis and Outlook Value (US$ Million) by Lamination Type, 2023 to 2033
Figure 98: Kinki Industry Analysis and Outlook Value (US$ Million) by Material Type, 2023 to 2033
Figure 99: Kinki Industry Analysis and Outlook Value (US$ Million) by Product Type, 2023 to 2033
Figure 100: Kinki Industry Analysis and Outlook Value (US$ Million) by Product Weight, 2023 to 2033
Figure 101: Kinki Industry Analysis and Outlook Value (US$ Million) by End Use, 2023 to 2033
Figure 102: Kinki Industry Analysis and Outlook Value (US$ Million) Analysis by Lamination Type, 2018 to 2033
Figure 103: Kinki Industry Analysis and Outlook Volume (Sq. Meter) Analysis by Lamination Type, 2018 to 2033
Figure 104: Kinki Industry Analysis and Outlook Value Share (%) and BPS Analysis by Lamination Type, 2023 to 2033
Figure 105: Kinki Industry Analysis and Outlook Y-o-Y Growth (%) Projections by Lamination Type, 2023 to 2033
Figure 106: Kinki Industry Analysis and Outlook Value (US$ Million) Analysis by Material Type, 2018 to 2033
Figure 107: Kinki Industry Analysis and Outlook Volume (Sq. Meter) Analysis by Material Type, 2018 to 2033
Figure 108: Kinki Industry Analysis and Outlook Value Share (%) and BPS Analysis by Material Type, 2023 to 2033
Figure 109: Kinki Industry Analysis and Outlook Y-o-Y Growth (%) Projections by Material Type, 2023 to 2033
Figure 110: Kinki Industry Analysis and Outlook Value (US$ Million) Analysis by Product Type, 2018 to 2033
Figure 111: Kinki Industry Analysis and Outlook Volume (Sq. Meter) Analysis by Product Type, 2018 to 2033
Figure 112: Kinki Industry Analysis and Outlook Value Share (%) and BPS Analysis by Product Type, 2023 to 2033
Figure 113: Kinki Industry Analysis and Outlook Y-o-Y Growth (%) Projections by Product Type, 2023 to 2033
Figure 114: Kinki Industry Analysis and Outlook Value (US$ Million) Analysis by Product Weight, 2018 to 2033
Figure 115: Kinki Industry Analysis and Outlook Volume (Sq. Meter) Analysis by Product Weight, 2018 to 2033
Figure 116: Kinki Industry Analysis and Outlook Value Share (%) and BPS Analysis by Product Weight, 2023 to 2033
Figure 117: Kinki Industry Analysis and Outlook Y-o-Y Growth (%) Projections by Product Weight, 2023 to 2033
Figure 118: Kinki Industry Analysis and Outlook Value (US$ Million) Analysis by End Use, 2018 to 2033
Figure 119: Kinki Industry Analysis and Outlook Volume (Sq. Meter) Analysis by End Use, 2018 to 2033
Figure 120: Kinki Industry Analysis and Outlook Value Share (%) and BPS Analysis by End Use, 2023 to 2033
Figure 121: Kinki Industry Analysis and Outlook Y-o-Y Growth (%) Projections by End Use, 2023 to 2033
Figure 122: Kinki Industry Analysis and Outlook Attractiveness by Lamination Type, 2023 to 2033
Figure 123: Kinki Industry Analysis and Outlook Attractiveness by Material Type, 2023 to 2033
Figure 124: Kinki Industry Analysis and Outlook Attractiveness by Product Type, 2023 to 2033
Figure 125: Kinki Industry Analysis and Outlook Attractiveness by Product Weight, 2023 to 2033
Figure 126: Kinki Industry Analysis and Outlook Attractiveness by End Use, 2023 to 2033
Figure 127: Kyushu & Okinawa Industry Analysis and Outlook Value (US$ Million) by Lamination Type, 2023 to 2033
Figure 128: Kyushu & Okinawa Industry Analysis and Outlook Value (US$ Million) by Material Type, 2023 to 2033
Figure 129: Kyushu & Okinawa Industry Analysis and Outlook Value (US$ Million) by Product Type, 2023 to 2033
Figure 130: Kyushu & Okinawa Industry Analysis and Outlook Value (US$ Million) by Product Weight, 2023 to 2033
Figure 131: Kyushu & Okinawa Industry Analysis and Outlook Value (US$ Million) by End Use, 2023 to 2033
Figure 132: Kyushu & Okinawa Industry Analysis and Outlook Value (US$ Million) Analysis by Lamination Type, 2018 to 2033
Figure 133: Kyushu & Okinawa Industry Analysis and Outlook Volume (Sq. Meter) Analysis by Lamination Type, 2018 to 2033
Figure 134: Kyushu & Okinawa Industry Analysis and Outlook Value Share (%) and BPS Analysis by Lamination Type, 2023 to 2033
Figure 135: Kyushu & Okinawa Industry Analysis and Outlook Y-o-Y Growth (%) Projections by Lamination Type, 2023 to 2033
Figure 136: Kyushu & Okinawa Industry Analysis and Outlook Value (US$ Million) Analysis by Material Type, 2018 to 2033
Figure 137: Kyushu & Okinawa Industry Analysis and Outlook Volume (Sq. Meter) Analysis by Material Type, 2018 to 2033
Figure 138: Kyushu & Okinawa Industry Analysis and Outlook Value Share (%) and BPS Analysis by Material Type, 2023 to 2033
Figure 139: Kyushu & Okinawa Industry Analysis and Outlook Y-o-Y Growth (%) Projections by Material Type, 2023 to 2033
Figure 140: Kyushu & Okinawa Industry Analysis and Outlook Value (US$ Million) Analysis by Product Type, 2018 to 2033
Figure 141: Kyushu & Okinawa Industry Analysis and Outlook Volume (Sq. Meter) Analysis by Product Type, 2018 to 2033
Figure 142: Kyushu & Okinawa Industry Analysis and Outlook Value Share (%) and BPS Analysis by Product Type, 2023 to 2033
Figure 143: Kyushu & Okinawa Industry Analysis and Outlook Y-o-Y Growth (%) Projections by Product Type, 2023 to 2033
Figure 144: Kyushu & Okinawa Industry Analysis and Outlook Value (US$ Million) Analysis by Product Weight, 2018 to 2033
Figure 145: Kyushu & Okinawa Industry Analysis and Outlook Volume (Sq. Meter) Analysis by Product Weight, 2018 to 2033
Figure 146: Kyushu & Okinawa Industry Analysis and Outlook Value Share (%) and BPS Analysis by Product Weight, 2023 to 2033
Figure 147: Kyushu & Okinawa Industry Analysis and Outlook Y-o-Y Growth (%) Projections by Product Weight, 2023 to 2033
Figure 148: Kyushu & Okinawa Industry Analysis and Outlook Value (US$ Million) Analysis by End Use, 2018 to 2033
Figure 149: Kyushu & Okinawa Industry Analysis and Outlook Volume (Sq. Meter) Analysis by End Use, 2018 to 2033
Figure 150: Kyushu & Okinawa Industry Analysis and Outlook Value Share (%) and BPS Analysis by End Use, 2023 to 2033
Figure 151: Kyushu & Okinawa Industry Analysis and Outlook Y-o-Y Growth (%) Projections by End Use, 2023 to 2033
Figure 152: Kyushu & Okinawa Industry Analysis and Outlook Attractiveness by Lamination Type, 2023 to 2033
Figure 153: Kyushu & Okinawa Industry Analysis and Outlook Attractiveness by Material Type, 2023 to 2033
Figure 154: Kyushu & Okinawa Industry Analysis and Outlook Attractiveness by Product Type, 2023 to 2033
Figure 155: Kyushu & Okinawa Industry Analysis and Outlook Attractiveness by Product Weight, 2023 to 2033
Figure 156: Kyushu & Okinawa Industry Analysis and Outlook Attractiveness by End Use, 2023 to 2033
Figure 157: Tohoku Industry Analysis and Outlook Value (US$ Million) by Lamination Type, 2023 to 2033
Figure 158: Tohoku Industry Analysis and Outlook Value (US$ Million) by Material Type, 2023 to 2033
Figure 159: Tohoku Industry Analysis and Outlook Value (US$ Million) by Product Type, 2023 to 2033
Figure 160: Tohoku Industry Analysis and Outlook Value (US$ Million) by Product Weight, 2023 to 2033
Figure 161: Tohoku Industry Analysis and Outlook Value (US$ Million) by End Use, 2023 to 2033
Figure 162: Tohoku Industry Analysis and Outlook Value (US$ Million) Analysis by Lamination Type, 2018 to 2033
Figure 163: Tohoku Industry Analysis and Outlook Volume (Sq. Meter) Analysis by Lamination Type, 2018 to 2033
Figure 164: Tohoku Industry Analysis and Outlook Value Share (%) and BPS Analysis by Lamination Type, 2023 to 2033
Figure 165: Tohoku Industry Analysis and Outlook Y-o-Y Growth (%) Projections by Lamination Type, 2023 to 2033
Figure 166: Tohoku Industry Analysis and Outlook Value (US$ Million) Analysis by Material Type, 2018 to 2033
Figure 167: Tohoku Industry Analysis and Outlook Volume (Sq. Meter) Analysis by Material Type, 2018 to 2033
Figure 168: Tohoku Industry Analysis and Outlook Value Share (%) and BPS Analysis by Material Type, 2023 to 2033
Figure 169: Tohoku Industry Analysis and Outlook Y-o-Y Growth (%) Projections by Material Type, 2023 to 2033
Figure 170: Tohoku Industry Analysis and Outlook Value (US$ Million) Analysis by Product Type, 2018 to 2033
Figure 171: Tohoku Industry Analysis and Outlook Volume (Sq. Meter) Analysis by Product Type, 2018 to 2033
Figure 172: Tohoku Industry Analysis and Outlook Value Share (%) and BPS Analysis by Product Type, 2023 to 2033
Figure 173: Tohoku Industry Analysis and Outlook Y-o-Y Growth (%) Projections by Product Type, 2023 to 2033
Figure 174: Tohoku Industry Analysis and Outlook Value (US$ Million) Analysis by Product Weight, 2018 to 2033
Figure 175: Tohoku Industry Analysis and Outlook Volume (Sq. Meter) Analysis by Product Weight, 2018 to 2033
Figure 176: Tohoku Industry Analysis and Outlook Value Share (%) and BPS Analysis by Product Weight, 2023 to 2033
Figure 177: Tohoku Industry Analysis and Outlook Y-o-Y Growth (%) Projections by Product Weight, 2023 to 2033
Figure 178: Tohoku Industry Analysis and Outlook Value (US$ Million) Analysis by End Use, 2018 to 2033
Figure 179: Tohoku Industry Analysis and Outlook Volume (Sq. Meter) Analysis by End Use, 2018 to 2033
Figure 180: Tohoku Industry Analysis and Outlook Value Share (%) and BPS Analysis by End Use, 2023 to 2033
Figure 181: Tohoku Industry Analysis and Outlook Y-o-Y Growth (%) Projections by End Use, 2023 to 2033
Figure 182: Tohoku Industry Analysis and Outlook Attractiveness by Lamination Type, 2023 to 2033
Figure 183: Tohoku Industry Analysis and Outlook Attractiveness by Material Type, 2023 to 2033
Figure 184: Tohoku Industry Analysis and Outlook Attractiveness by Product Type, 2023 to 2033
Figure 185: Tohoku Industry Analysis and Outlook Attractiveness by Product Weight, 2023 to 2033
Figure 186: Tohoku Industry Analysis and Outlook Attractiveness by End Use, 2023 to 2033
Figure 187: Rest of Japan Industry Analysis and Outlook Value (US$ Million) by Lamination Type, 2023 to 2033
Figure 188: Rest of Japan Industry Analysis and Outlook Value (US$ Million) by Material Type, 2023 to 2033
Figure 189: Rest of Japan Industry Analysis and Outlook Value (US$ Million) by Product Type, 2023 to 2033
Figure 190: Rest of Japan Industry Analysis and Outlook Value (US$ Million) by Product Weight, 2023 to 2033
Figure 191: Rest of Japan Industry Analysis and Outlook Value (US$ Million) by End Use, 2023 to 2033
Figure 192: Rest of Japan Industry Analysis and Outlook Value (US$ Million) Analysis by Lamination Type, 2018 to 2033
Figure 193: Rest of Japan Industry Analysis and Outlook Volume (Sq. Meter) Analysis by Lamination Type, 2018 to 2033
Figure 194: Rest of Japan Industry Analysis and Outlook Value Share (%) and BPS Analysis by Lamination Type, 2023 to 2033
Figure 195: Rest of Japan Industry Analysis and Outlook Y-o-Y Growth (%) Projections by Lamination Type, 2023 to 2033
Figure 196: Rest of Japan Industry Analysis and Outlook Value (US$ Million) Analysis by Material Type, 2018 to 2033
Figure 197: Rest of Japan Industry Analysis and Outlook Volume (Sq. Meter) Analysis by Material Type, 2018 to 2033
Figure 198: Rest of Japan Industry Analysis and Outlook Value Share (%) and BPS Analysis by Material Type, 2023 to 2033
Figure 199: Rest of Japan Industry Analysis and Outlook Y-o-Y Growth (%) Projections by Material Type, 2023 to 2033
Figure 200: Rest of Japan Industry Analysis and Outlook Value (US$ Million) Analysis by Product Type, 2018 to 2033
Figure 201: Rest of Japan Industry Analysis and Outlook Volume (Sq. Meter) Analysis by Product Type, 2018 to 2033
Figure 202: Rest of Japan Industry Analysis and Outlook Value Share (%) and BPS Analysis by Product Type, 2023 to 2033
Figure 203: Rest of Japan Industry Analysis and Outlook Y-o-Y Growth (%) Projections by Product Type, 2023 to 2033
Figure 204: Rest of Japan Industry Analysis and Outlook Value (US$ Million) Analysis by Product Weight, 2018 to 2033
Figure 205: Rest of Japan Industry Analysis and Outlook Volume (Sq. Meter) Analysis by Product Weight, 2018 to 2033
Figure 206: Rest of Japan Industry Analysis and Outlook Value Share (%) and BPS Analysis by Product Weight, 2023 to 2033
Figure 207: Rest of Japan Industry Analysis and Outlook Y-o-Y Growth (%) Projections by Product Weight, 2023 to 2033
Figure 208: Rest of Japan Industry Analysis and Outlook Value (US$ Million) Analysis by End Use, 2018 to 2033
Figure 209: Rest of Japan Industry Analysis and Outlook Volume (Sq. Meter) Analysis by End Use, 2018 to 2033
Figure 210: Rest of Japan Industry Analysis and Outlook Value Share (%) and BPS Analysis by End Use, 2023 to 2033
Figure 211: Rest of Japan Industry Analysis and Outlook Y-o-Y Growth (%) Projections by End Use, 2023 to 2033
Figure 212: Rest of Japan Industry Analysis and Outlook Attractiveness by Lamination Type, 2023 to 2033
Figure 213: Rest of Japan Industry Analysis and Outlook Attractiveness by Material Type, 2023 to 2033
Figure 214: Rest of Japan Industry Analysis and Outlook Attractiveness by Product Type, 2023 to 2033
Figure 215: Rest of Japan Industry Analysis and Outlook Attractiveness by Product Weight, 2023 to 2033
Figure 216: Rest of Japan Industry Analysis and Outlook Attractiveness by End Use, 2023 to 2033
The anticipated CAGR for tarpaulin sheet industry in Japan through 2033 is 3.8%.
Tarpaulin sheet industry size in Japan is likely to be USD 284.7 million by 2033.
Hoarding tarps are the highly preferred tarpaulin sheet type in Japan.
Tarpaulin sheets find their applications commonly in the agriculture sector.
Explore Plastic Packaging Insights
Thank you!
You will receive an email from our Business Development Manager. Please be sure to check your SPAM/JUNK folder too.