Reports

- Global Locations -

Headquarters

Future Market Insights, Inc.

Christiana Corporate, 200
Continental Drive, Suite 401,
Newark, Delaware - 19713,
United States

T: +1-347-918-3531

Americas

Future Market Insights, Inc.

616 Corporate Way, Suite 2-9018,
Valley Cottage, NY 10989, United States

MEA

Future Market Insights

1602-6 Jumeirah Bay X2 Tower, Plot No: JLT-PH2-X2A,
Jumeirah Lakes Towers, Dubai,
United Arab Emirates

Europe

Future Market Insights

3rd Floor, 207 Regent Street,
W1B 3HH London
United Kingdom

T: + 44 (0) 20 8123 9659

Asia Pacific

Future Market Insights

IndiaLand Global Tech Park, Unit UG-1, Behind Grand HighStreet, Phase 1, Hinjawadi, MH, Pune – 411057, India

Bonding Sheet Market Outlook for 2024 to 2034

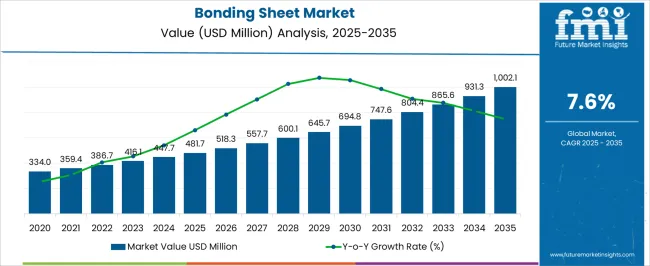
The bonding sheet market is estimated at US$ 447.7 million by 2024. The market valuation is expected to be US$ 930 million by 2034, registering a moderate CAGR of 7.6%.

The market is experiencing robust growth driven by the expanding electronics and automotive industries. These sheets, often made from polyurethane or epoxy, are crucial in adhering components within electronic devices, automotive assemblies, and other industrial applications.

With the rising demand for miniaturization and increased complexity in electronic devices, bonding sheets are pivotal in providing efficient and reliable adhesion. The market is also influenced by advancements in adhesive technologies, leading to improved performance and durability.

As sustainability becomes a key focus across industries, eco-friendly bonding sheets are gaining traction. The market is witnessing innovations in heat-resistant and conductive bonding sheets to meet evolving industry requirements.

The market is poised for continued expansion, driven by technological advancements and the growing need for reliable bonding solutions in various sectors.

Key Market Trends and Highlights

  • The market is witnessing significant growth, primarily fueled by increasing demand from the expanding electronics and automotive industries.
  • Bonding sheets, typically composed of materials like polyurethane or epoxy, play a crucial role in adhering components within electronic devices, automotive assemblies, and other industrial applications.
  • The market is responding to the rising trend of miniaturization in electronic devices and their growing complexity, where bonding sheets contribute to the efficient and reliable adhesion of intricate components.
  • Innovations are evident in developing heat-resistant and conductive bonding sheets, addressing specific industry requirements, and ensuring compatibility with diverse applications.
Attributes Key Insights
Market Estimated Size in 2024 US$ 447.7 million
Projected Market Size in 2034 US$ 930 million
Value-based CAGR from 2024 to 2034 7.6%

Don't pay for what you don't need

Customize your report by selecting specific countries or regions and save 30%!

2019 to 2023 Historical Analysis vs. 2024 to 2034 Market Forecast Projections

The scope for global bonding sheet market insights expanded at an 8.1% CAGR between 2019 and 2023. The market is anticipated to develop at a CAGR of 7.6% over the forecast period from 2024 to 2034.

Historical CAGR from 2019 to 2023 8.1%
Forecast CAGR from 2024 to 2034 7.6%

Between 2019 and 2023, the global market experienced notable growth, marked by an 8.1% CAGR. This period was characterized by increased demand driven by the expanding electronics and automotive industries. The surge in technological advancements and the growing emphasis on miniaturization in electronic devices contributed to the market upward trajectory.

Adhesive technologies also evolved during this timeframe, enhancing the performance and durability of bonding sheets. Industries increasingly recognized the critical role of these sheets in providing reliable adhesion in complex applications.

From 2024 to 2034, the market is projected to maintain a robust development pace, albeit at a slightly moderated 7.6% CAGR. The forecast reflects the industrial resilience and sustained demand. Anticipated innovations in materials and adhesive technologies, coupled with the continuous growth of the electronics and automotive sectors, are expected to be key drivers during this period.

The market expansion is likely to be further fueled by the ongoing trend towards sustainability, with eco-friendly bonding sheets gaining prominence in response to environmental considerations. The market is poised for sustained growth, underpinned by technological advancements and diverse industrial applications.

Bonding Sheet Market Opportunities

Attributes Details
Opportunities
  • Expanding opportunities lie in the increasing integration of bonding sheets within electronic devices, driven by the ongoing trend of miniaturization and complexity in electronic components.
  • The automotive sector presents significant prospects, with bonding sheets crucial in ensuring the structural integrity and reliability of various components in modern vehicles.
  • Opportunities arise from continuous advancements in adhesive technologies, offering the potential for improved performance, durability, and expanded applications of bonding sheets.
  • Beyond electronics and automotive, there are opportunities for diversification in industrial applications, as bonding sheets find utility in various sectors due to their versatile adhesion capabilities.
Nikhil Kaitwade
Nikhil Kaitwade

Principal Consultant

Talk to Analyst

Find your sweet spots for generating winning opportunities in this market.

Comparative View of the Bonding Sheet Market

Future Market Insights has analyzed three markets, namely the bonding sheet market, the sheet metal market, and the veneer sheets market. The analysis showcases that the bonding sheet industry is set to dominate among these three markets over the forecast period from 2024 to 2034.

The bonding sheet market distinguishes itself through its pivotal role in ensuring reliable adhesion in electronic devices, automotive assemblies, and diverse industrial applications.

Driven by technological advancements in adhesive materials, the market has experienced notable growth, with a focus on sustainability evident in developing eco-friendly bonding sheets.

The trend of miniaturization in electronics further propels the demand for these sheets, reflecting their critical contribution to compact and intricate components.

Opportunities lie in the expanding electronics and automotive sectors, customization for specific industrial applications, and global market expansion, positioning the bonding sheet market at the forefront of adhesive solutions catering to evolving industry needs.

Bonding Sheet Market:

Attributes Bonding Sheet Market
CAGR from 2024 to 2034 7.6%
Market Value in 2034 US$ 930 million
Key Trends The increasing demand for eco-friendly bonding sheets reflects a broader trend towards sustainable manufacturing practices.
Opportunity The automotive sector offers significant prospects, as bonding sheets are critical in ensuring structural integrity and reliability.

Sheet Metal Market:

Attributes Sheet Metal Market
CAGR from 2023 to 2033 4%
Key Trends The increasing emphasis in automotive design on lightweight materials for fuel efficiency is a prominent trend driving the use of sheet metal.
Opportunity The expansion of renewable energy projects offers opportunities for the sheet metal market, particularly in manufacturing components for wind turbines and solar panels.

Veneer Sheets Market:

Attributes Veneer Sheets Market
CAGR from 2023 to 2033 2.7%
Key Trends The trend towards natural aesthetics in interior design has driven the use of veneer sheets, which offer a sustainable and visually appealing alternative to solid wood.
Opportunity Offering customizable veneer solutions for interior designers and architects presents opportunities to meet the diverse aesthetic preferences in the market.

Country-wise Insights

The provided table highlights CAGRs across five countries, focusing on the United States, Japan, China, the United Kingdom, and South Korea.

Among these nations, South Korea stands out as a dynamic and rapidly advancing market, projecting substantial growth with an 8.8% CAGR by 2034. The vibrant economic landscape of the country is marked by a proactive approach to innovation, contributing significantly to diverse industries.

The commitment to embracing and driving technological advancements positions it as a key player in the global economic arena, reflecting a thriving trajectory in its economic evolution.

Attributes Forecast CAGRs from 2024 to 2034
The United States 7.8%
Japan 8.3%
China 8.5%
The United Kingdom 8%
South Korea 8.8%

Advanced Technological Landscape Surges the United States Market

In the United States, a CAGR of 7.8% suggests a robust demand propelled by the thriving electronics and automotive industries of the country.

The advanced technological landscape and emphasis on product design and manufacturing innovation have led to increased integration of bonding sheets for reliable adhesion in complex electronic devices and automotive assemblies.

Precision Manufacturing and Technological Prowess Boosts the Market Growth

Japan, with an 8.3% CAGR, is known for its precision manufacturing and technological prowess.

The electronics and automotive sectors are renowned for their high-quality products and heavily rely on bonding sheets to ensure the integrity of intricate components. The commitment to technological excellence fuels the adoption of advanced bonding solutions.

Rapid Industrialization Inhibits Growth in the Market

China, boasting an 8.5% CAGR, reflects the rapid industrialization and growth across various sectors of the country.

The manufacturing boom, especially in the electronics and automotive industries, has driven the demand for bonding sheets to meet the requirements of assembling and securing components in a cost-effective and reliable manner.

Focus on Innovation and Sustainable Manufacturing Practices Drives Market Growth

With an 8% CAGR in the United Kingdom, the adoption of bonding sheets aligns with the focus on innovation and sustainable manufacturing practices of the country.

In particular, the automotive and aerospace industries leverage bonding sheets to enhance structural integrity and reduce overall weight, contributing to more fuel-efficient and eco-friendly transportation solutions.

Dynamic Economic Landscape Fuels the Market Growth of South Korea

South Korea stands out with the highest CAGR at 8.8% due to its dynamic economic landscape and strong commitment to innovation.

The diverse industries, including electronics, automotive, and technology, extensively utilize bonding sheets to ensure the reliability and longevity of their products.

Get the data you need at a Fraction of the cost

Personalize your report by choosing insights you need
and save 40%!

Category-wise Insights

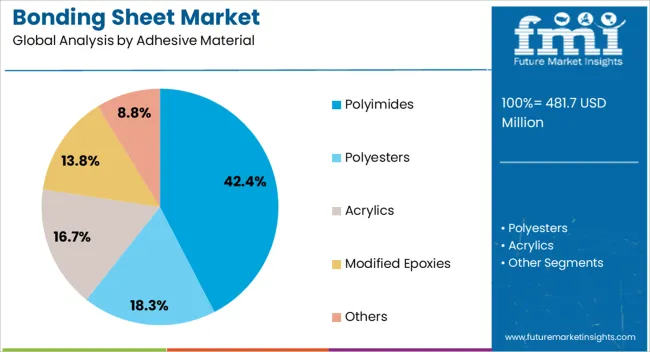
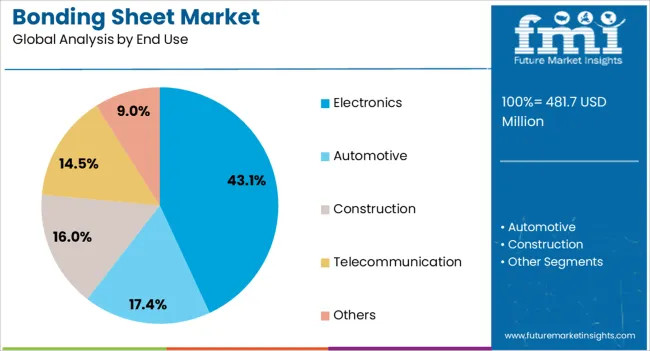
The table below provides an overview of the bonding sheet landscape on the basis of adhesive material and end-use. Polyimides are projected to lead the type of market at a 7.5% CAGR by 2034, while automotive in the end user category is likely to expand at a CAGR of 7.4% by 2034.

A key driver behind the projection of polyimides leading the bonding sheet market lies in their exceptional thermal stability and mechanical strength. The significant growth of the automotive industry can be attributed to the increasing adoption of bonding sheets to address specific challenges in modern vehicle manufacturing.

Category CAGR by 2034
Polyimides 7.5%
Automotive 7.4%

Polyimides Hold a Dominant Position in the Market

Polyimides emerge as a frontrunner in the adhesive material segment, projected to lead the market with a Compound Annual Growth Rate (CAGR) of 7.5% by 2034. This signifies a substantial demand for bonding sheets crafted from polyimide, underscoring its versatility and effectiveness across diverse industrial applications.

The prominence of polyimides reflects their exceptional adhesion properties, making them a preferred choice in addressing the intricate bonding requirements in electronics, automotive, and other sectors.

Automotive Emerges as a Significant Segment in the Market

By end-use categories, the automotive sector takes center stage with a projected CAGR of 7.4% by 2034. This growth underscores the pivotal role of bonding sheets in the automotive industry, which are instrumental in ensuring structural integrity, vibration resistance, and reliability of various components.

The robust expansion is propelled by increasing demand for technologically advanced vehicles and a growing emphasis on lightweight materials, where bonding sheets play a critical role in meeting stringent performance standards. This projection highlights the sustained and significant opportunities for bonding sheets within the automotive landscape.
Competitive landscape

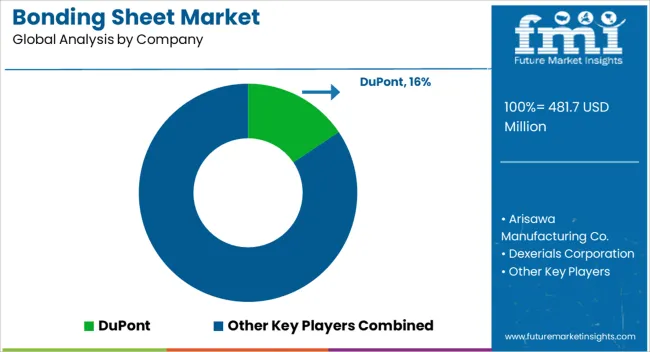
The competitive landscape of the bonding sheet market is characterized by the presence of several key players vying for market share and dominance. Major industry participants continually engage in research and development activities to introduce innovative bonding sheet solutions, often focusing on improved adhesion properties, durability, and environmental sustainability.

The companies also strategically invest in advanced manufacturing processes and technologies to stay ahead in a rapidly evolving market. Collaboration and partnerships within and outside the industry are common strategies to enhance product offerings and expand market reach.

Mergers and acquisitions significantly shape the competitive dynamics, enabling companies to consolidate their market position and capitalize on synergies. With the market poised for continued growth, competition is expected to intensify, driving further advancements and fostering a dynamic environment within the bonding sheet industry.

Some key market developments are

  • In February 2022, Tokyo-based Shin-Etsu Chemical unveiled a substantial investment of US$ 680 million in its silicone portfolio within the Functional Materials business segment.
  • In May 2022, DuPont Interconnect Solutions successfully concluded a US$ 250 million expansion project at its Circleville site, centered on Kapton polyimide film and Pyralux flexible circuit materials.

Report Scope

Attributes Details
Estimated Market Size in 2024 US$ 447.7 million
Projected Market Valuation in 2034 US$ 930 million
CAGR Share from 2024 to 2034 7.6%
Forecast Period 2024 to 2034
Historical Data Available for 2019 to 2023
Market Analysis Value in US$ million
Key Regions Covered
  • North America
  • Latin America
  • Western Europe
  • Eastern Europe
  • South Asia and Pacific
  • East Asia
  • Middle East and Africa
Key Market Segments Covered
  • By Adhesive Material
  • By End Use
  • By Region
Key Countries Profiled
  • The United States
  • Canada
  • Brazil
  • Mexico
  • Germany
  • The United Kingdom
  • France
  • Spain
  • Italy
  • Poland
  • Russia
  • Czech Republic
  • Romania
  • India
  • Bangladesh
  • Australia
  • New Zealand
  • China
  • Japan
  • South Korea
  • GCC Countries
  • South Africa
  • Israel
Key Companies Profiled
  • Arisawa Manufacturing Co.
  • Dexerials Corporation
  • DuPont
  • Fujikura Ltd.
  • Hanwha Solutions Advanced Materials Division
  • Microcosm Technology Co. Ltd
  • Namics Corporation
  • Nikkan Industries Co.,Ltd
  • Nippon Mektron Ltd
  • Nitto Denko Corporation
  • Shin-Etsu Polymer Co. Ltd

Key Segments of Bonding Sheet Industry Survey

By Adhesive Material:

  • Polyimides
  • Polyesters
  • Acrylics
  • Modified Epoxies
  • Others

By End Use:

  • Automotive
  • Construction
  • Telecommunication
  • Electronics
  • Others

By Region:

  • North America
  • Latin America
  • Western Europe
  • Eastern Europe
  • South Asia and Pacific
  • East Asia
  • Middle East and Africa

Frequently Asked Questions

What is the expected value of the bonding sheet market in 2024?

By 2024, the bonding sheet landscape is estimated to be valued at US$ 447.7 million.

What is the projected forecast CAGR for the bonding sheet market from 2024 to 2034?

The bonding sheet market is projected to flourish at a CAGR of 7.6% from 2024 to 2034.

At what value the bonding sheet market is expected to conclude in 2034?

By 2034, the bonding sheet market will generate US$ 930 million in value terms.

Based on adhesive material, which segment dominates the bonding sheet market?

The polyimides segment is anticipated to expand at 7.5% CAGR by 2034.

Which country dominates the bonding sheet market?

With a CAGR of 8.8%, South Korea is expected to dominate the market for bonding sheets.

Table of Content

1. Executive Summary

    1.1. Global Market Outlook

    1.2. Demand-side Trends

    1.3. Supply-side Trends

    1.4. Technology Roadmap Analysis

    1.5. Analysis and Recommendations

2. Market Overview

    2.1. Market Coverage / Taxonomy

    2.2. Market Definition / Scope / Limitations

3. Market Background

    3.1. Market Dynamics

        3.1.1. Drivers

        3.1.2. Restraints

        3.1.3. Opportunity

        3.1.4. Trends

    3.2. Scenario Forecast

        3.2.1. Demand in Optimistic Scenario

        3.2.2. Demand in Likely Scenario

        3.2.3. Demand in Conservative Scenario

    3.3. Opportunity Map Analysis

    3.4. Product Life Cycle Analysis

    3.5. Supply Chain Analysis

        3.5.1. Supply Side Participants and their Roles

            3.5.1.1. Producers

            3.5.1.2. Mid-Level Participants (Traders/ Agents/ Brokers)

            3.5.1.3. Wholesalers and Distributors

        3.5.2. Value Added and Value Created at Node in the Supply Chain

        3.5.3. List of Raw Material Suppliers

        3.5.4. List of Existing and Potential Buyer’s

    3.6. Investment Feasibility Matrix

    3.7. Value Chain Analysis

        3.7.1. Profit Margin Analysis

        3.7.2. Wholesalers and Distributors

        3.7.3. Retailers

    3.8. PESTLE and Porter’s Analysis

    3.9. Regulatory Landscape

        3.9.1. By Key Regions

        3.9.2. By Key Countries

    3.10. Regional Parent Market Outlook

    3.11. Production and Consumption Statistics

    3.12. Import and Export Statistics

4. Global Market Analysis 2019 to 2023 and Forecast, 2024 to 2034

    4.1. Historical Market Size Value (US$ Million) & Volume (Square Meter) Analysis, 2019 to 2023

    4.2. Current and Future Market Size Value (US$ Million) & Volume (Square Meter) Projections, 2024 to 2034

        4.2.1. Y-o-Y Growth Trend Analysis

        4.2.2. Absolute $ Opportunity Analysis

5. Global Market Analysis 2019 to 2023 and Forecast 2024 to 2034, By Adhesive Material

    5.1. Introduction / Key Findings

    5.2. Historical Market Size Value (US$ Million) & Volume (Square Meter) Analysis By Adhesive Material, 2019 to 2023

    5.3. Current and Future Market Size Value (US$ Million) & Volume (Square Meter) Analysis and Forecast By Adhesive Material, 2024 to 2034

        5.3.1. Polyimides

        5.3.2. Polyesters

        5.3.3. Acrylics

        5.3.4. Modified Epoxies

        5.3.5. Others

    5.4. Y-o-Y Growth Trend Analysis By Adhesive Material, 2019 to 2023

    5.5. Absolute $ Opportunity Analysis By Adhesive Material, 2024 to 2034

6. Global Market Analysis 2019 to 2023 and Forecast 2024 to 2034, By End-Use

    6.1. Introduction / Key Findings

    6.2. Historical Market Size Value (US$ Million) & Volume (Square Meter) Analysis By End-Use, 2019 to 2023

    6.3. Current and Future Market Size Value (US$ Million) & Volume (Square Meter) Analysis and Forecast By End-Use, 2024 to 2034

        6.3.1. Automotive

        6.3.2. Construction

        6.3.3. Telecommunication

        6.3.4. Electronics

        6.3.5. Others

    6.4. Y-o-Y Growth Trend Analysis By End-Use, 2019 to 2023

    6.5. Absolute $ Opportunity Analysis By End-Use, 2024 to 2034

7. Global Market Analysis 2019 to 2023 and Forecast 2024 to 2034, By Region

    7.1. Introduction

    7.2. Historical Market Size Value (US$ Million) & Volume (Square Meter) Analysis By Region, 2019 to 2023

    7.3. Current Market Size Value (US$ Million) & Volume (Square Meter) Analysis and Forecast By Region, 2024 to 2034

        7.3.1. North America

        7.3.2. Latin America

        7.3.3. Western Europe

        7.3.4. Eastern Europe

        7.3.5. South Asia and Pacific

        7.3.6. East Asia

        7.3.7. Middle East and Africa

    7.4. Market Attractiveness Analysis By Region

8. North America Market Analysis 2019 to 2023 and Forecast 2024 to 2034, By Country

    8.1. Historical Market Size Value (US$ Million) & Volume (Square Meter) Trend Analysis By Market Taxonomy, 2019 to 2023

    8.2. Market Size Value (US$ Million) & Volume (Square Meter) Forecast By Market Taxonomy, 2024 to 2034

        8.2.1. By Country

            8.2.1.1. USA

            8.2.1.2. Canada

        8.2.2. By Adhesive Material

        8.2.3. By End-Use

    8.3. Market Attractiveness Analysis

        8.3.1. By Country

        8.3.2. By Adhesive Material

        8.3.3. By End-Use

    8.4. Key Takeaways

9. Latin America Market Analysis 2019 to 2023 and Forecast 2024 to 2034, By Country

    9.1. Historical Market Size Value (US$ Million) & Volume (Square Meter) Trend Analysis By Market Taxonomy, 2019 to 2023

    9.2. Market Size Value (US$ Million) & Volume (Square Meter) Forecast By Market Taxonomy, 2024 to 2034

        9.2.1. By Country

            9.2.1.1. Brazil

            9.2.1.2. Mexico

            9.2.1.3. Rest of Latin America

        9.2.2. By Adhesive Material

        9.2.3. By End-Use

    9.3. Market Attractiveness Analysis

        9.3.1. By Country

        9.3.2. By Adhesive Material

        9.3.3. By End-Use

    9.4. Key Takeaways

10. Western Europe Market Analysis 2019 to 2023 and Forecast 2024 to 2034, By Country

    10.1. Historical Market Size Value (US$ Million) & Volume (Square Meter) Trend Analysis By Market Taxonomy, 2019 to 2023

    10.2. Market Size Value (US$ Million) & Volume (Square Meter) Forecast By Market Taxonomy, 2024 to 2034

        10.2.1. By Country

            10.2.1.1. Germany

            10.2.1.2. UK

            10.2.1.3. France

            10.2.1.4. Spain

            10.2.1.5. Italy

            10.2.1.6. Rest of Western Europe

        10.2.2. By Adhesive Material

        10.2.3. By End-Use

    10.3. Market Attractiveness Analysis

        10.3.1. By Country

        10.3.2. By Adhesive Material

        10.3.3. By End-Use

    10.4. Key Takeaways

11. Eastern Europe Market Analysis 2019 to 2023 and Forecast 2024 to 2034, By Country

    11.1. Historical Market Size Value (US$ Million) & Volume (Square Meter) Trend Analysis By Market Taxonomy, 2019 to 2023

    11.2. Market Size Value (US$ Million) & Volume (Square Meter) Forecast By Market Taxonomy, 2024 to 2034

        11.2.1. By Country

            11.2.1.1. Poland

            11.2.1.2. Russia

            11.2.1.3. Czech Republic

            11.2.1.4. Romania

            11.2.1.5. Rest of Eastern Europe

        11.2.2. By Adhesive Material

        11.2.3. By End-Use

    11.3. Market Attractiveness Analysis

        11.3.1. By Country

        11.3.2. By Adhesive Material

        11.3.3. By End-Use

    11.4. Key Takeaways

12. South Asia and Pacific Market Analysis 2019 to 2023 and Forecast 2024 to 2034, By Country

    12.1. Historical Market Size Value (US$ Million) & Volume (Square Meter) Trend Analysis By Market Taxonomy, 2019 to 2023

    12.2. Market Size Value (US$ Million) & Volume (Square Meter) Forecast By Market Taxonomy, 2024 to 2034

        12.2.1. By Country

            12.2.1.1. India

            12.2.1.2. Bangladesh

            12.2.1.3. Australia

            12.2.1.4. New Zealand

            12.2.1.5. Rest of South Asia and Pacific

        12.2.2. By Adhesive Material

        12.2.3. By End-Use

    12.3. Market Attractiveness Analysis

        12.3.1. By Country

        12.3.2. By Adhesive Material

        12.3.3. By End-Use

    12.4. Key Takeaways

13. East Asia Market Analysis 2019 to 2023 and Forecast 2024 to 2034, By Country

    13.1. Historical Market Size Value (US$ Million) & Volume (Square Meter) Trend Analysis By Market Taxonomy, 2019 to 2023

    13.2. Market Size Value (US$ Million) & Volume (Square Meter) Forecast By Market Taxonomy, 2024 to 2034

        13.2.1. By Country

            13.2.1.1. China

            13.2.1.2. Japan

            13.2.1.3. South Korea

        13.2.2. By Adhesive Material

        13.2.3. By End-Use

    13.3. Market Attractiveness Analysis

        13.3.1. By Country

        13.3.2. By Adhesive Material

        13.3.3. By End-Use

    13.4. Key Takeaways

14. Middle East and Africa Market Analysis 2019 to 2023 and Forecast 2024 to 2034, By Country

    14.1. Historical Market Size Value (US$ Million) & Volume (Square Meter) Trend Analysis By Market Taxonomy, 2019 to 2023

    14.2. Market Size Value (US$ Million) & Volume (Square Meter) Forecast By Market Taxonomy, 2024 to 2034

        14.2.1. By Country

            14.2.1.1. GCC Countries

            14.2.1.2. South Africa

            14.2.1.3. Israel

            14.2.1.4. Rest of MEA

        14.2.2. By Adhesive Material

        14.2.3. By End-Use

    14.3. Market Attractiveness Analysis

        14.3.1. By Country

        14.3.2. By Adhesive Material

        14.3.3. By End-Use

    14.4. Key Takeaways

15. Key Countries Market Analysis

    15.1. USA

        15.1.1. Pricing Analysis

        15.1.2. Market Share Analysis, 2023

            15.1.2.1. By Adhesive Material

            15.1.2.2. By End-Use

    15.2. Canada

        15.2.1. Pricing Analysis

        15.2.2. Market Share Analysis, 2023

            15.2.2.1. By Adhesive Material

            15.2.2.2. By End-Use

    15.3. Brazil

        15.3.1. Pricing Analysis

        15.3.2. Market Share Analysis, 2023

            15.3.2.1. By Adhesive Material

            15.3.2.2. By End-Use

    15.4. Mexico

        15.4.1. Pricing Analysis

        15.4.2. Market Share Analysis, 2023

            15.4.2.1. By Adhesive Material

            15.4.2.2. By End-Use

    15.5. Germany

        15.5.1. Pricing Analysis

        15.5.2. Market Share Analysis, 2023

            15.5.2.1. By Adhesive Material

            15.5.2.2. By End-Use

    15.6. UK

        15.6.1. Pricing Analysis

        15.6.2. Market Share Analysis, 2023

            15.6.2.1. By Adhesive Material

            15.6.2.2. By End-Use

    15.7. France

        15.7.1. Pricing Analysis

        15.7.2. Market Share Analysis, 2023

            15.7.2.1. By Adhesive Material

            15.7.2.2. By End-Use

    15.8. Spain

        15.8.1. Pricing Analysis

        15.8.2. Market Share Analysis, 2023

            15.8.2.1. By Adhesive Material

            15.8.2.2. By End-Use

    15.9. Italy

        15.9.1. Pricing Analysis

        15.9.2. Market Share Analysis, 2023

            15.9.2.1. By Adhesive Material

            15.9.2.2. By End-Use

    15.10. Poland

        15.10.1. Pricing Analysis

        15.10.2. Market Share Analysis, 2023

            15.10.2.1. By Adhesive Material

            15.10.2.2. By End-Use

    15.11. Russia

        15.11.1. Pricing Analysis

        15.11.2. Market Share Analysis, 2023

            15.11.2.1. By Adhesive Material

            15.11.2.2. By End-Use

    15.12. Czech Republic

        15.12.1. Pricing Analysis

        15.12.2. Market Share Analysis, 2023

            15.12.2.1. By Adhesive Material

            15.12.2.2. By End-Use

    15.13. Romania

        15.13.1. Pricing Analysis

        15.13.2. Market Share Analysis, 2023

            15.13.2.1. By Adhesive Material

            15.13.2.2. By End-Use

    15.14. India

        15.14.1. Pricing Analysis

        15.14.2. Market Share Analysis, 2023

            15.14.2.1. By Adhesive Material

            15.14.2.2. By End-Use

    15.15. Bangladesh

        15.15.1. Pricing Analysis

        15.15.2. Market Share Analysis, 2023

            15.15.2.1. By Adhesive Material

            15.15.2.2. By End-Use

    15.16. Australia

        15.16.1. Pricing Analysis

        15.16.2. Market Share Analysis, 2023

            15.16.2.1. By Adhesive Material

            15.16.2.2. By End-Use

    15.17. New Zealand

        15.17.1. Pricing Analysis

        15.17.2. Market Share Analysis, 2023

            15.17.2.1. By Adhesive Material

            15.17.2.2. By End-Use

    15.18. China

        15.18.1. Pricing Analysis

        15.18.2. Market Share Analysis, 2023

            15.18.2.1. By Adhesive Material

            15.18.2.2. By End-Use

    15.19. Japan

        15.19.1. Pricing Analysis

        15.19.2. Market Share Analysis, 2023

            15.19.2.1. By Adhesive Material

            15.19.2.2. By End-Use

    15.20. South Korea

        15.20.1. Pricing Analysis

        15.20.2. Market Share Analysis, 2023

            15.20.2.1. By Adhesive Material

            15.20.2.2. By End-Use

    15.21. GCC Countries

        15.21.1. Pricing Analysis

        15.21.2. Market Share Analysis, 2023

            15.21.2.1. By Adhesive Material

            15.21.2.2. By End-Use

    15.22. South Africa

        15.22.1. Pricing Analysis

        15.22.2. Market Share Analysis, 2023

            15.22.2.1. By Adhesive Material

            15.22.2.2. By End-Use

    15.23. Israel

        15.23.1. Pricing Analysis

        15.23.2. Market Share Analysis, 2023

            15.23.2.1. By Adhesive Material

            15.23.2.2. By End-Use

16. Market Structure Analysis

    16.1. Competition Dashboard

    16.2. Competition Benchmarking

    16.3. Market Share Analysis of Top Players

        16.3.1. By Regional

        16.3.2. By Adhesive Material

        16.3.3. By End-Use

17. Competition Analysis

    17.1. Competition Deep Dive

        17.1.1. Arisawa Manufacturing Co.

            17.1.1.1. Overview

            17.1.1.2. Product Portfolio

            17.1.1.3. Profitability by Market Segments

            17.1.1.4. Sales Footprint

            17.1.1.5. Strategy Overview

                17.1.1.5.1. Marketing Strategy

                17.1.1.5.2. Product Strategy

                17.1.1.5.3. Channel Strategy

        17.1.2. Dexerials Corporation

            17.1.2.1. Overview

            17.1.2.2. Product Portfolio

            17.1.2.3. Profitability by Market Segments

            17.1.2.4. Sales Footprint

            17.1.2.5. Strategy Overview

                17.1.2.5.1. Marketing Strategy

                17.1.2.5.2. Product Strategy

                17.1.2.5.3. Channel Strategy

        17.1.3. DuPont, Fujikura Ltd.

            17.1.3.1. Overview

            17.1.3.2. Product Portfolio

            17.1.3.3. Profitability by Market Segments

            17.1.3.4. Sales Footprint

            17.1.3.5. Strategy Overview

                17.1.3.5.1. Marketing Strategy

                17.1.3.5.2. Product Strategy

                17.1.3.5.3. Channel Strategy

        17.1.4. Hanwha Solutions Advanced Materials Division

            17.1.4.1. Overview

            17.1.4.2. Product Portfolio

            17.1.4.3. Profitability by Market Segments

            17.1.4.4. Sales Footprint

            17.1.4.5. Strategy Overview

                17.1.4.5.1. Marketing Strategy

                17.1.4.5.2. Product Strategy

                17.1.4.5.3. Channel Strategy

        17.1.5. Microcosm Technology Co., Ltd

            17.1.5.1. Overview

            17.1.5.2. Product Portfolio

            17.1.5.3. Profitability by Market Segments

            17.1.5.4. Sales Footprint

            17.1.5.5. Strategy Overview

                17.1.5.5.1. Marketing Strategy

                17.1.5.5.2. Product Strategy

                17.1.5.5.3. Channel Strategy

        17.1.6. Namics Corporation

            17.1.6.1. Overview

            17.1.6.2. Product Portfolio

            17.1.6.3. Profitability by Market Segments

            17.1.6.4. Sales Footprint

            17.1.6.5. Strategy Overview

                17.1.6.5.1. Marketing Strategy

                17.1.6.5.2. Product Strategy

                17.1.6.5.3. Channel Strategy

        17.1.7. Nikkan Industries Co.,Ltd

            17.1.7.1. Overview

            17.1.7.2. Product Portfolio

            17.1.7.3. Profitability by Market Segments

            17.1.7.4. Sales Footprint

            17.1.7.5. Strategy Overview

                17.1.7.5.1. Marketing Strategy

                17.1.7.5.2. Product Strategy

                17.1.7.5.3. Channel Strategy

        17.1.8. Nippon Mektron Ltd

            17.1.8.1. Overview

            17.1.8.2. Product Portfolio

            17.1.8.3. Profitability by Market Segments

            17.1.8.4. Sales Footprint

            17.1.8.5. Strategy Overview

                17.1.8.5.1. Marketing Strategy

                17.1.8.5.2. Product Strategy

                17.1.8.5.3. Channel Strategy

        17.1.9. Nitto Denko Corporation

            17.1.9.1. Overview

            17.1.9.2. Product Portfolio

            17.1.9.3. Profitability by Market Segments

            17.1.9.4. Sales Footprint

            17.1.9.5. Strategy Overview

                17.1.9.5.1. Marketing Strategy

                17.1.9.5.2. Product Strategy

                17.1.9.5.3. Channel Strategy

        17.1.10. Shin-Etsu Polymer Co., Ltd

            17.1.10.1. Overview

            17.1.10.2. Product Portfolio

            17.1.10.3. Profitability by Market Segments

            17.1.10.4. Sales Footprint

            17.1.10.5. Strategy Overview

                17.1.10.5.1. Marketing Strategy

                17.1.10.5.2. Product Strategy

                17.1.10.5.3. Channel Strategy

18. Assumptions & Acronyms Used

19. Research Methodology

List of Tables

Table 1: Global Market Value (US$ Million) Forecast by Region, 2019 to 2034

Table 2: Global Market Volume (Square Meter) Forecast by Region, 2019 to 2034

Table 3: Global Market Value (US$ Million) Forecast by Adhesive Material, 2019 to 2034

Table 4: Global Market Volume (Square Meter) Forecast by Adhesive Material, 2019 to 2034

Table 5: Global Market Value (US$ Million) Forecast by End-Use, 2019 to 2034

Table 6: Global Market Volume (Square Meter) Forecast by End-Use, 2019 to 2034

Table 7: North America Market Value (US$ Million) Forecast by Country, 2019 to 2034

Table 8: North America Market Volume (Square Meter) Forecast by Country, 2019 to 2034

Table 9: North America Market Value (US$ Million) Forecast by Adhesive Material, 2019 to 2034

Table 10: North America Market Volume (Square Meter) Forecast by Adhesive Material, 2019 to 2034

Table 11: North America Market Value (US$ Million) Forecast by End-Use, 2019 to 2034

Table 12: North America Market Volume (Square Meter) Forecast by End-Use, 2019 to 2034

Table 13: Latin America Market Value (US$ Million) Forecast by Country, 2019 to 2034

Table 14: Latin America Market Volume (Square Meter) Forecast by Country, 2019 to 2034

Table 15: Latin America Market Value (US$ Million) Forecast by Adhesive Material, 2019 to 2034

Table 16: Latin America Market Volume (Square Meter) Forecast by Adhesive Material, 2019 to 2034

Table 17: Latin America Market Value (US$ Million) Forecast by End-Use, 2019 to 2034

Table 18: Latin America Market Volume (Square Meter) Forecast by End-Use, 2019 to 2034

Table 19: Western Europe Market Value (US$ Million) Forecast by Country, 2019 to 2034

Table 20: Western Europe Market Volume (Square Meter) Forecast by Country, 2019 to 2034

Table 21: Western Europe Market Value (US$ Million) Forecast by Adhesive Material, 2019 to 2034

Table 22: Western Europe Market Volume (Square Meter) Forecast by Adhesive Material, 2019 to 2034

Table 23: Western Europe Market Value (US$ Million) Forecast by End-Use, 2019 to 2034

Table 24: Western Europe Market Volume (Square Meter) Forecast by End-Use, 2019 to 2034

Table 25: Eastern Europe Market Value (US$ Million) Forecast by Country, 2019 to 2034

Table 26: Eastern Europe Market Volume (Square Meter) Forecast by Country, 2019 to 2034

Table 27: Eastern Europe Market Value (US$ Million) Forecast by Adhesive Material, 2019 to 2034

Table 28: Eastern Europe Market Volume (Square Meter) Forecast by Adhesive Material, 2019 to 2034

Table 29: Eastern Europe Market Value (US$ Million) Forecast by End-Use, 2019 to 2034

Table 30: Eastern Europe Market Volume (Square Meter) Forecast by End-Use, 2019 to 2034

Table 31: South Asia and Pacific Market Value (US$ Million) Forecast by Country, 2019 to 2034

Table 32: South Asia and Pacific Market Volume (Square Meter) Forecast by Country, 2019 to 2034

Table 33: South Asia and Pacific Market Value (US$ Million) Forecast by Adhesive Material, 2019 to 2034

Table 34: South Asia and Pacific Market Volume (Square Meter) Forecast by Adhesive Material, 2019 to 2034

Table 35: South Asia and Pacific Market Value (US$ Million) Forecast by End-Use, 2019 to 2034

Table 36: South Asia and Pacific Market Volume (Square Meter) Forecast by End-Use, 2019 to 2034

Table 37: East Asia Market Value (US$ Million) Forecast by Country, 2019 to 2034

Table 38: East Asia Market Volume (Square Meter) Forecast by Country, 2019 to 2034

Table 39: East Asia Market Value (US$ Million) Forecast by Adhesive Material, 2019 to 2034

Table 40: East Asia Market Volume (Square Meter) Forecast by Adhesive Material, 2019 to 2034

Table 41: East Asia Market Value (US$ Million) Forecast by End-Use, 2019 to 2034

Table 42: East Asia Market Volume (Square Meter) Forecast by End-Use, 2019 to 2034

Table 43: Middle East and Africa Market Value (US$ Million) Forecast by Country, 2019 to 2034

Table 44: Middle East and Africa Market Volume (Square Meter) Forecast by Country, 2019 to 2034

Table 45: Middle East and Africa Market Value (US$ Million) Forecast by Adhesive Material, 2019 to 2034

Table 46: Middle East and Africa Market Volume (Square Meter) Forecast by Adhesive Material, 2019 to 2034

Table 47: Middle East and Africa Market Value (US$ Million) Forecast by End-Use, 2019 to 2034

Table 48: Middle East and Africa Market Volume (Square Meter) Forecast by End-Use, 2019 to 2034

List of Charts

Figure 1: Global Market Value (US$ Million) by Adhesive Material, 2024 to 2034

Figure 2: Global Market Value (US$ Million) by End-Use, 2024 to 2034

Figure 3: Global Market Value (US$ Million) by Region, 2024 to 2034

Figure 4: Global Market Value (US$ Million) Analysis by Region, 2019 to 2034

Figure 5: Global Market Volume (Square Meter) Analysis by Region, 2019 to 2034

Figure 6: Global Market Value Share (%) and BPS Analysis by Region, 2024 to 2034

Figure 7: Global Market Y-o-Y Growth (%) Projections by Region, 2024 to 2034

Figure 8: Global Market Value (US$ Million) Analysis by Adhesive Material, 2019 to 2034

Figure 9: Global Market Volume (Square Meter) Analysis by Adhesive Material, 2019 to 2034

Figure 10: Global Market Value Share (%) and BPS Analysis by Adhesive Material, 2024 to 2034

Figure 11: Global Market Y-o-Y Growth (%) Projections by Adhesive Material, 2024 to 2034

Figure 12: Global Market Value (US$ Million) Analysis by End-Use, 2019 to 2034

Figure 13: Global Market Volume (Square Meter) Analysis by End-Use, 2019 to 2034

Figure 14: Global Market Value Share (%) and BPS Analysis by End-Use, 2024 to 2034

Figure 15: Global Market Y-o-Y Growth (%) Projections by End-Use, 2024 to 2034

Figure 16: Global Market Attractiveness by Adhesive Material, 2024 to 2034

Figure 17: Global Market Attractiveness by End-Use, 2024 to 2034

Figure 18: Global Market Attractiveness by Region, 2024 to 2034

Figure 19: North America Market Value (US$ Million) by Adhesive Material, 2024 to 2034

Figure 20: North America Market Value (US$ Million) by End-Use, 2024 to 2034

Figure 21: North America Market Value (US$ Million) by Country, 2024 to 2034

Figure 22: North America Market Value (US$ Million) Analysis by Country, 2019 to 2034

Figure 23: North America Market Volume (Square Meter) Analysis by Country, 2019 to 2034

Figure 24: North America Market Value Share (%) and BPS Analysis by Country, 2024 to 2034

Figure 25: North America Market Y-o-Y Growth (%) Projections by Country, 2024 to 2034

Figure 26: North America Market Value (US$ Million) Analysis by Adhesive Material, 2019 to 2034

Figure 27: North America Market Volume (Square Meter) Analysis by Adhesive Material, 2019 to 2034

Figure 28: North America Market Value Share (%) and BPS Analysis by Adhesive Material, 2024 to 2034

Figure 29: North America Market Y-o-Y Growth (%) Projections by Adhesive Material, 2024 to 2034

Figure 30: North America Market Value (US$ Million) Analysis by End-Use, 2019 to 2034

Figure 31: North America Market Volume (Square Meter) Analysis by End-Use, 2019 to 2034

Figure 32: North America Market Value Share (%) and BPS Analysis by End-Use, 2024 to 2034

Figure 33: North America Market Y-o-Y Growth (%) Projections by End-Use, 2024 to 2034

Figure 34: North America Market Attractiveness by Adhesive Material, 2024 to 2034

Figure 35: North America Market Attractiveness by End-Use, 2024 to 2034

Figure 36: North America Market Attractiveness by Country, 2024 to 2034

Figure 37: Latin America Market Value (US$ Million) by Adhesive Material, 2024 to 2034

Figure 38: Latin America Market Value (US$ Million) by End-Use, 2024 to 2034

Figure 39: Latin America Market Value (US$ Million) by Country, 2024 to 2034

Figure 40: Latin America Market Value (US$ Million) Analysis by Country, 2019 to 2034

Figure 41: Latin America Market Volume (Square Meter) Analysis by Country, 2019 to 2034

Figure 42: Latin America Market Value Share (%) and BPS Analysis by Country, 2024 to 2034

Figure 43: Latin America Market Y-o-Y Growth (%) Projections by Country, 2024 to 2034

Figure 44: Latin America Market Value (US$ Million) Analysis by Adhesive Material, 2019 to 2034

Figure 45: Latin America Market Volume (Square Meter) Analysis by Adhesive Material, 2019 to 2034

Figure 46: Latin America Market Value Share (%) and BPS Analysis by Adhesive Material, 2024 to 2034

Figure 47: Latin America Market Y-o-Y Growth (%) Projections by Adhesive Material, 2024 to 2034

Figure 48: Latin America Market Value (US$ Million) Analysis by End-Use, 2019 to 2034

Figure 49: Latin America Market Volume (Square Meter) Analysis by End-Use, 2019 to 2034

Figure 50: Latin America Market Value Share (%) and BPS Analysis by End-Use, 2024 to 2034

Figure 51: Latin America Market Y-o-Y Growth (%) Projections by End-Use, 2024 to 2034

Figure 52: Latin America Market Attractiveness by Adhesive Material, 2024 to 2034

Figure 53: Latin America Market Attractiveness by End-Use, 2024 to 2034

Figure 54: Latin America Market Attractiveness by Country, 2024 to 2034

Figure 55: Western Europe Market Value (US$ Million) by Adhesive Material, 2024 to 2034

Figure 56: Western Europe Market Value (US$ Million) by End-Use, 2024 to 2034

Figure 57: Western Europe Market Value (US$ Million) by Country, 2024 to 2034

Figure 58: Western Europe Market Value (US$ Million) Analysis by Country, 2019 to 2034

Figure 59: Western Europe Market Volume (Square Meter) Analysis by Country, 2019 to 2034

Figure 60: Western Europe Market Value Share (%) and BPS Analysis by Country, 2024 to 2034

Figure 61: Western Europe Market Y-o-Y Growth (%) Projections by Country, 2024 to 2034

Figure 62: Western Europe Market Value (US$ Million) Analysis by Adhesive Material, 2019 to 2034

Figure 63: Western Europe Market Volume (Square Meter) Analysis by Adhesive Material, 2019 to 2034

Figure 64: Western Europe Market Value Share (%) and BPS Analysis by Adhesive Material, 2024 to 2034

Figure 65: Western Europe Market Y-o-Y Growth (%) Projections by Adhesive Material, 2024 to 2034

Figure 66: Western Europe Market Value (US$ Million) Analysis by End-Use, 2019 to 2034

Figure 67: Western Europe Market Volume (Square Meter) Analysis by End-Use, 2019 to 2034

Figure 68: Western Europe Market Value Share (%) and BPS Analysis by End-Use, 2024 to 2034

Figure 69: Western Europe Market Y-o-Y Growth (%) Projections by End-Use, 2024 to 2034

Figure 70: Western Europe Market Attractiveness by Adhesive Material, 2024 to 2034

Figure 71: Western Europe Market Attractiveness by End-Use, 2024 to 2034

Figure 72: Western Europe Market Attractiveness by Country, 2024 to 2034

Figure 73: Eastern Europe Market Value (US$ Million) by Adhesive Material, 2024 to 2034

Figure 74: Eastern Europe Market Value (US$ Million) by End-Use, 2024 to 2034

Figure 75: Eastern Europe Market Value (US$ Million) by Country, 2024 to 2034

Figure 76: Eastern Europe Market Value (US$ Million) Analysis by Country, 2019 to 2034

Figure 77: Eastern Europe Market Volume (Square Meter) Analysis by Country, 2019 to 2034

Figure 78: Eastern Europe Market Value Share (%) and BPS Analysis by Country, 2024 to 2034

Figure 79: Eastern Europe Market Y-o-Y Growth (%) Projections by Country, 2024 to 2034

Figure 80: Eastern Europe Market Value (US$ Million) Analysis by Adhesive Material, 2019 to 2034

Figure 81: Eastern Europe Market Volume (Square Meter) Analysis by Adhesive Material, 2019 to 2034

Figure 82: Eastern Europe Market Value Share (%) and BPS Analysis by Adhesive Material, 2024 to 2034

Figure 83: Eastern Europe Market Y-o-Y Growth (%) Projections by Adhesive Material, 2024 to 2034

Figure 84: Eastern Europe Market Value (US$ Million) Analysis by End-Use, 2019 to 2034

Figure 85: Eastern Europe Market Volume (Square Meter) Analysis by End-Use, 2019 to 2034

Figure 86: Eastern Europe Market Value Share (%) and BPS Analysis by End-Use, 2024 to 2034

Figure 87: Eastern Europe Market Y-o-Y Growth (%) Projections by End-Use, 2024 to 2034

Figure 88: Eastern Europe Market Attractiveness by Adhesive Material, 2024 to 2034

Figure 89: Eastern Europe Market Attractiveness by End-Use, 2024 to 2034

Figure 90: Eastern Europe Market Attractiveness by Country, 2024 to 2034

Figure 91: South Asia and Pacific Market Value (US$ Million) by Adhesive Material, 2024 to 2034

Figure 92: South Asia and Pacific Market Value (US$ Million) by End-Use, 2024 to 2034

Figure 93: South Asia and Pacific Market Value (US$ Million) by Country, 2024 to 2034

Figure 94: South Asia and Pacific Market Value (US$ Million) Analysis by Country, 2019 to 2034

Figure 95: South Asia and Pacific Market Volume (Square Meter) Analysis by Country, 2019 to 2034

Figure 96: South Asia and Pacific Market Value Share (%) and BPS Analysis by Country, 2024 to 2034

Figure 97: South Asia and Pacific Market Y-o-Y Growth (%) Projections by Country, 2024 to 2034

Figure 98: South Asia and Pacific Market Value (US$ Million) Analysis by Adhesive Material, 2019 to 2034

Figure 99: South Asia and Pacific Market Volume (Square Meter) Analysis by Adhesive Material, 2019 to 2034

Figure 100: South Asia and Pacific Market Value Share (%) and BPS Analysis by Adhesive Material, 2024 to 2034

Figure 101: South Asia and Pacific Market Y-o-Y Growth (%) Projections by Adhesive Material, 2024 to 2034

Figure 102: South Asia and Pacific Market Value (US$ Million) Analysis by End-Use, 2019 to 2034

Figure 103: South Asia and Pacific Market Volume (Square Meter) Analysis by End-Use, 2019 to 2034

Figure 104: South Asia and Pacific Market Value Share (%) and BPS Analysis by End-Use, 2024 to 2034

Figure 105: South Asia and Pacific Market Y-o-Y Growth (%) Projections by End-Use, 2024 to 2034

Figure 106: South Asia and Pacific Market Attractiveness by Adhesive Material, 2024 to 2034

Figure 107: South Asia and Pacific Market Attractiveness by End-Use, 2024 to 2034

Figure 108: South Asia and Pacific Market Attractiveness by Country, 2024 to 2034

Figure 109: East Asia Market Value (US$ Million) by Adhesive Material, 2024 to 2034

Figure 110: East Asia Market Value (US$ Million) by End-Use, 2024 to 2034

Figure 111: East Asia Market Value (US$ Million) by Country, 2024 to 2034

Figure 112: East Asia Market Value (US$ Million) Analysis by Country, 2019 to 2034

Figure 113: East Asia Market Volume (Square Meter) Analysis by Country, 2019 to 2034

Figure 114: East Asia Market Value Share (%) and BPS Analysis by Country, 2024 to 2034

Figure 115: East Asia Market Y-o-Y Growth (%) Projections by Country, 2024 to 2034

Figure 116: East Asia Market Value (US$ Million) Analysis by Adhesive Material, 2019 to 2034

Figure 117: East Asia Market Volume (Square Meter) Analysis by Adhesive Material, 2019 to 2034

Figure 118: East Asia Market Value Share (%) and BPS Analysis by Adhesive Material, 2024 to 2034

Figure 119: East Asia Market Y-o-Y Growth (%) Projections by Adhesive Material, 2024 to 2034

Figure 120: East Asia Market Value (US$ Million) Analysis by End-Use, 2019 to 2034

Figure 121: East Asia Market Volume (Square Meter) Analysis by End-Use, 2019 to 2034

Figure 122: East Asia Market Value Share (%) and BPS Analysis by End-Use, 2024 to 2034

Figure 123: East Asia Market Y-o-Y Growth (%) Projections by End-Use, 2024 to 2034

Figure 124: East Asia Market Attractiveness by Adhesive Material, 2024 to 2034

Figure 125: East Asia Market Attractiveness by End-Use, 2024 to 2034

Figure 126: East Asia Market Attractiveness by Country, 2024 to 2034

Figure 127: Middle East and Africa Market Value (US$ Million) by Adhesive Material, 2024 to 2034

Figure 128: Middle East and Africa Market Value (US$ Million) by End-Use, 2024 to 2034

Figure 129: Middle East and Africa Market Value (US$ Million) by Country, 2024 to 2034

Figure 130: Middle East and Africa Market Value (US$ Million) Analysis by Country, 2019 to 2034

Figure 131: Middle East and Africa Market Volume (Square Meter) Analysis by Country, 2019 to 2034

Figure 132: Middle East and Africa Market Value Share (%) and BPS Analysis by Country, 2024 to 2034

Figure 133: Middle East and Africa Market Y-o-Y Growth (%) Projections by Country, 2024 to 2034

Figure 134: Middle East and Africa Market Value (US$ Million) Analysis by Adhesive Material, 2019 to 2034

Figure 135: Middle East and Africa Market Volume (Square Meter) Analysis by Adhesive Material, 2019 to 2034

Figure 136: Middle East and Africa Market Value Share (%) and BPS Analysis by Adhesive Material, 2024 to 2034

Figure 137: Middle East and Africa Market Y-o-Y Growth (%) Projections by Adhesive Material, 2024 to 2034

Figure 138: Middle East and Africa Market Value (US$ Million) Analysis by End-Use, 2019 to 2034

Figure 139: Middle East and Africa Market Volume (Square Meter) Analysis by End-Use, 2019 to 2034

Figure 140: Middle East and Africa Market Value Share (%) and BPS Analysis by End-Use, 2024 to 2034

Figure 141: Middle East and Africa Market Y-o-Y Growth (%) Projections by End-Use, 2024 to 2034

Figure 142: Middle East and Africa Market Attractiveness by Adhesive Material, 2024 to 2034

Figure 143: Middle East and Africa Market Attractiveness by End-Use, 2024 to 2034

Figure 144: Middle East and Africa Market Attractiveness by Country, 2024 to 2034

Recommendations

Chemicals & Materials

Veneer Sheets Market

Published : June 2023

Chemicals & Materials

Sheet Metal Market

Published : February 2023

Explore Chemicals & Materials Insights

View Reports