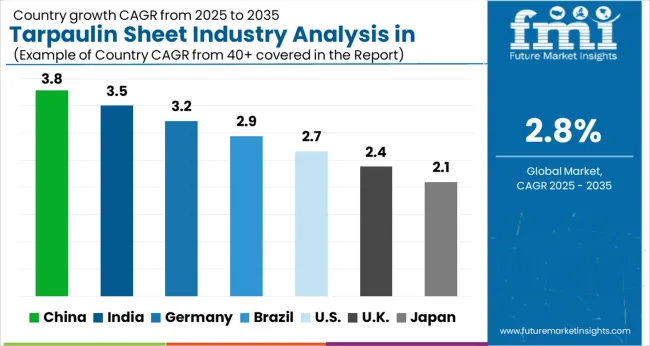
Tarpaulin Sheet Market Size and Share Forecast Outlook in Western Europe (2023 to 2033)

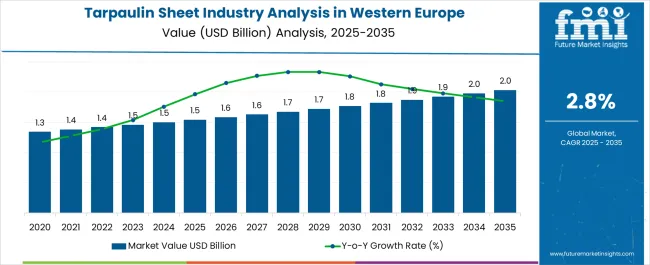
The demand for tarpaulin sheet is predicted to rise from USD 1,459.0 million in 2023 to USD 1,915.6 million by 2033. Sales of tarpaulin sheet in Western Europe are anticipated to soar at a CAGR of 2.8% between 2023 and 2033.

The industry is primarily driven by the expanding demand for tarpaulin sheet from the agriculture, building and construction, logistics, consumer products, and automotive industries.

Pivotal Motivators of Tarpaulin Sheet Sales

  • Western Europe's fluctuating and frequently severe weather promotes a considerable demand for tarpaulin sheets.
  • Ongoing restorations, infrastructure growth, and building projects contribute to the demand for tarpaulin sheet.
  • Sustainability and environmentally friendly products are becoming increasingly important. In response to the trend, tarpaulin sheet manufacturers are creating recyclable, ecologically friendly tarpaulin sheets that appeal to customers and companies who prioritize environmental concerns.
  • The industry's accessibility and reach have been widened through the ease of purchasing tarpaulin sheets online. This convenience leads to increased tarpaulin sheet sales and industry expansion.
  • As customers seek more sophisticated and long-lasting solutions, innovations in tarpaulin materials with improved durability, UV resistance, and use are likely to fuel industry expansion further.
Attributes Details
Industry Size in Western Europe (2023) USD 1,459.0 million
Forecasted Industry Size in Western Europe (2033) USD 1,915.6 million
CAGR Estimation (2023 to 2033) 2.8%

Restrictive Factors Impacting the Tarpaulin Sheets Sector in Western Europe

  • Economic issues, such as a recession, could limit industrial and building activity, lowering the demand for tarpaulin sheet in Western Europe.
  • Companies could encounter difficulties with price and industry share due to the competitive nature of the tarpaulin sheet business. Profit margins could be under pressure from heightened competition.
  • Tarpaulin sheet materials may need to adapt to strict environmental restrictions and requirements. This could lead to increased costs and potentially hinder product innovation to meet these standards in Western Europe.

Country-wise Outlook for Tarpaulin Sheet Utilization in Western Europe

The table below demonstrates the anticipated demand for tarpaulin sheet in Western Europe, with an eye on the United Kingdom, France, the Netherlands, Italy, and Germany. Based on quantitative and qualitative analysis, the United Kingdom has a lucrative opportunity with strong tarpaulin sheet producers.
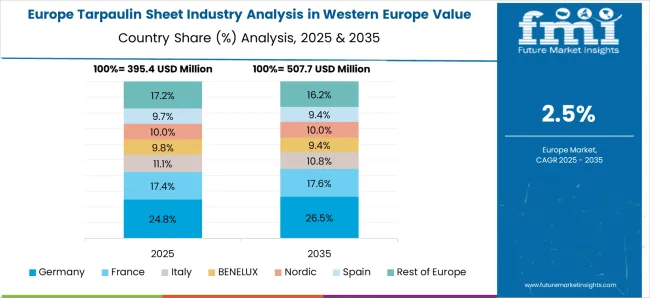
Country CAGR
United Kingdom 3.4%
France 2.7%
Netherlands 2.9%
Italy 2.5%
Germany 2.1%

Resilient Tarpaulin Products in the United Kingdom Market

  • Due to its numerous applications in outdoor activities, agriculture, and construction, the United Kingdom market has shown consistent growth.
  • In the United Kingdom, demand for eco-friendly tarpaulin materials has increased due to environmental concerns.
  • Intense rivalry and innovation in long-lasting, weather-resistant tarpaulin goods define the industry.

Agriculture and Transportation Dominate the France Tarpaulin Materials Market

  • The tarpaulin sheet industry in France is primarily driven by the agriculture and transportation sectors
  • The demand for tarpaulins sheets that are waterproof and resistant to ultraviolet (UV) rays is growing across France.
  • High-quality, lightweight materials are flooding the industry, improving performance and convenience.

Netherlands Market for Tarpaulin Sheet Cater to the Specialized Needs of Outdoor Storage

  • Due to the enormous port network in the Netherlands, tarpaulin sheets are essential for the logistics and shipping sectors of the economy.
  • Heavy-duty and tailored tarpaulins are in high demand, particularly in the transportation and outdoor storage industries.

Growing Affinity for Innovative Tarpaulin Sheet Solutions in Italy

  • The robust agricultural and construction sectors in Italy have an impact on the industry.
  • The demand for tarpaulin sheets that are both flame- and tear-resistant has grown in the construction industry.
  • The industry is seeing an increase in the adoption of innovative tarpaulin materials for temporary buildings and shelter options.

Robust Trade Networks and the Evolution of High-tech Tarpaulin Sheet in Germany

  • The industrial industry in Germany is resilient, and there are enormous trading networks.
  • Smart tarpaulin sheets with capabilities like weather monitoring and remote control have been created due to technological improvements.
  • High-strength tarpaulin sheets are becoming popular in the logistics and automotive sectors in Germany.

Category-wise Insights into Western Europe’s Tarpaulin Sheet Sector

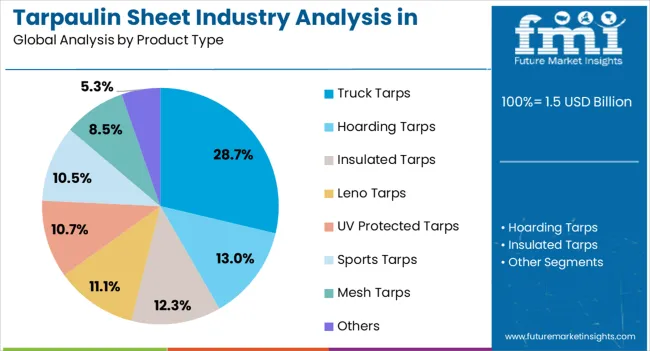
Hoarding Tarps Segment Lead Tarpaulin Sheet in Western Europe Market

Due to their adaptability and variety of uses, the hoarding tarps segment dominates the industry for tarpaulin sheet in Western Europe. Hoarding tarps are a popular choice across various industries, providing coverage and protection in event management, construction, and advertising due to their adaptability.

Product Type Hoarding Tarps
Share 35.8%

Hoarding tarps is the industry leader due to their versatility in diverse industries, as well as their strength and affordability. Hoarding tarps are a top alternative for tarpaulin sheet manufacturers looking for durable tarpaulin solutions due to their extensive usage and capacity to satisfy various purposes.

Agricultural Demand Propels Market Supremacy in Tarpaulin Sheet

Agriculture dominates the demand for tarpaulin sheets because of their extensive use in protecting crops and equipment. The long-lasting tarpaulin sheets protect agricultural produce from bad weather, preserving its quality.

End Use Agriculture
Share 27.1%

The agriculture sector is the leading end use segment shareholder due to its high reliance on tarpaulin sheets for various uses such as crop protection, hay storage, and equipment cover. With the ongoing demand for agricultural preservation and expansion, tarpaulin sheets are essential, ensuring their industry supremacy.
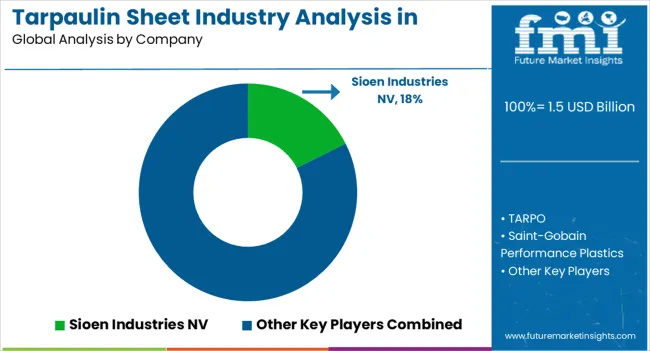
Competitive Landscape in Western Europe

Intense competition between several key manufacturers dominates the tarpaulin sheet in Western Europe. The leading tarpaulin sheet businesses prioritize innovation, quality, and sustainability to keep their competitive edge.

Local tarpaulin sheet producers and small-scale competitors influence the diversity in Western Europe. Tarpaulin sheet demand is rising, increasing competition and propelling product development across various industries.

Key Companies Observed in Tarpaulin Sheet in ­­­Western Europe

Company Name Details
Sioen Industries NV Tarpaulin sheets are one of the several technical textiles produced by Sioen Industries, a firm headquartered in Belgium. They are well-known for their high-quality items and have a significant presence in Western Europe.
TARPO TARPO is a well-known producer of tarpaulin sheets and other industrial textiles. They offer a range of goods for various purposes and are well-established in Western Europe.
Saint-Gobain Performance Plastics Western Europe is home to the international corporation Saint-Gobain Performance Plastics. They provide creative answers for many industries, including tarpaulin sheets used in construction and other industrial settings.
Sattler AG The Sattler AG brand is well-known for its superior tarpaulin products. They are well-established in Western Europe and offer tarpaulin solutions for various uses, such as transportation and agriculture.

Key Players Operating in the Western Europe Tarpaulin Sheet Market

  • Sioen Industries NV
  • TARPO
  • Saint-Gobain Performance Plastics
  • Sattler AG
  • Valmex (Mehler Texnologies)
  • Low and Bonar (Now part of Freudenberg Group)
  • Röder Zelt GmbH
  • Tarpaflex
  • Italian Technical Fabrics Srl
  • Döcke Extrusion GmbH and Co. KG

Scope of the Report

Attribute Details
Estimated Valuation (2023) USD 1,459.0 million
Projected Valuation (2033) USD 1,915.6 million
Anticipated CAGR (2023 to 2033) 2.8%
Historical Analysis of Tarpaulin Sheet in Western Europe 2018 to 2022
Demand Forecast for Tarpaulin Sheet in Western Europe 2023 to 2033
Quantitative Units Revenue in USD million and CAGR from 2023 to 2033
Report Coverage Revenue Forecast, Company Ranking, Competitive Landscape, Growth Factors, Trends and Pricing Analysis
Key Countries Analyzed while Studying Opportunities in Western Europe United Kingdom, Italy, France, Spain, Germany
Key Companies Profiled for Tarpaulin Sheet in Western Europe Sioen Industries NV; TARPO; Saint-Gobain Performance Plastics; Sattler AG; Valmex (Mehler Texnologies); Low and Bonar (Now part of Freudenberg Group); Röder Zelt GmbH; Tarpaflex; Italian Technical Fabrics Srl; Döcke Extrusion GmbH and Co. KG

Top Segments in Western Europe Tarpaulin Sheet Market

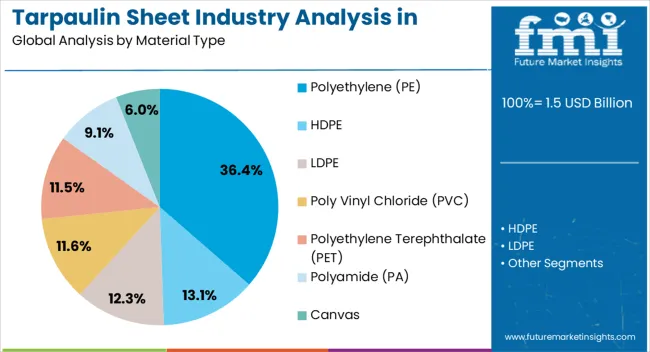
By Material Type:

  • Polyethylene (PE)
  • HDPE
  • LDPE
  • Poly Vinyl Chloride (PVC)
  • Polyethylene Terephthalate (PET)
  • Polyamide (PA)
  • Canvas

By Product Type:

  • Hoarding Tarps
  • Insulated Tarps
  • Leno Tarps
  • Truck Tarps
  • UV Protected Tarps
  • Sports Tarps
  • Mesh Tarps
  • Others

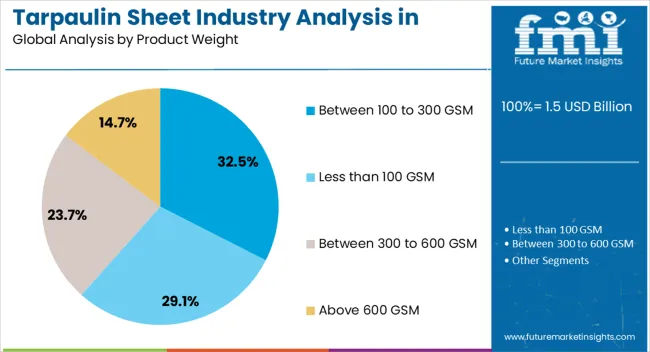
By Product Weight:

  • Less than 100 GSM
  • Between 100 to 300 GSM
  • Between 300 to 600 GSM
  • Above 600 GSM

By Lamination Type:

  • Up to 2 Layers
  • 3 Layers Laminate
  • 4 Layers Laminate
  • Above 4 Layers

By End-use:

  • Agriculture
  • Building and Construction
  • Scaffolding Industry
  • Automobiles
  • Storage, Warehousing, and Logistics
  • Transport
  • Consumer Goods
  • Others

By Country:

  • Germany
  • Italy
  • France
  • United Kingdom
  • Spain

Table of Content

  • 1. Executive Summary
  • 2. Market Overview
  • 3. Market Background
  • 4. Western Europe Industry Analysis and Outlook 2018 to 2022 and Forecast, 2023 to 2033
  • 5. Western Europe Industry Analysis and Outlook 2018 to 2022 and Forecast 2023 to 2033, By Lamination Type
    • 5.1. Upto 2 Layers
    • 5.2. 3 Layers Laminate
    • 5.3. 4 Layers Laminate
    • 5.4. Above 4 Layers
  • 6. Western Europe Industry Analysis and Outlook 2018 to 2022 and Forecast 2023 to 2033, By Material Type
    • 6.1. Canvas
    • 6.2. PET
    • 6.3. Poly Vinyl Chloride (PVC)
    • 6.4. Polyamide (PA)
    • 6.5. Polyethylene (PE)
  • 7. Western Europe Industry Analysis and Outlook 2018 to 2022 and Forecast 2023 to 2033, By Product Type
    • 7.1. Hoarding Tarps
    • 7.2. Insulated Tarps
    • 7.3. Mesh Tarps
    • 7.4. Sports Tarps
    • 7.5. Truck Tarps
    • 7.6. UV Protected Tarps
    • 7.7. Others
  • 8. Western Europe Industry Analysis and Outlook 2018 to 2022 and Forecast 2023 to 2033, By Product Weight
    • 8.1. Less than 100 GSM
    • 8.2. Between 100 to 300 GSM
    • 8.3. Between 300 to 600 GSM
    • 8.4. Above 600 GSM
  • 9. Western Europe Industry Analysis and Outlook 2018 to 2022 and Forecast 2023 to 2033, By End Use
    • 9.1. Agriculture
    • 9.2. Automobiles
    • 9.3. Building & Construction
    • 9.4. Consumer Goods
    • 9.5. Storage, Warehousing & Logistics
    • 9.6. Others
  • 10. Western Europe Industry Analysis and Outlook 2018 to 2022 and Forecast 2023 to 2033, By Country
    • 10.1. UK
    • 10.2. Germany
    • 10.3. Italy
    • 10.4. France
    • 10.5. Spain
    • 10.6. Rest of Western Europe
  • 11. UK Industry Analysis and Outlook 2018 to 2022 and Forecast 2023 to 2033, By Region
  • 12. Germany Industry Analysis and Outlook 2018 to 2022 and Forecast 2023 to 2033, By Region
  • 13. Italy Industry Analysis and Outlook 2018 to 2022 and Forecast 2023 to 2033, By Region
  • 14. France Industry Analysis and Outlook 2018 to 2022 and Forecast 2023 to 2033, By Region
  • 15. Spain Industry Analysis and Outlook 2018 to 2022 and Forecast 2023 to 2033, By Region
  • 16. Rest of Western Europe Industry Analysis and Outlook 2018 to 2022 and Forecast 2023 to 2033
  • 17. Market Structure Analysis
  • 18. Competition Analysis
    • 18.1. Rhino United Kingdom
    • 18.2. J Clemishaw Ltd.
    • 18.3. Del Tarpaulins Ltd.
    • 18.4. Cunningham Covers
    • 18.5. C&H Vina Co., Ltd.
    • 18.6. Puyoung Industrial Corporation, Ltd
    • 18.7. Bag Poly International Pvt. Ltd
    • 18.8. Qingdao SG Global Packaging Co., Ltd
    • 18.9. Telford Tarpaulins
    • 18.10. Darling Downs Tarpaulins
    • 18.11. Marson Industries Pty Ltd
    • 18.12. Canadian Tarpaulin Manufacturers Ltd.
    • 18.13. Cunningham Covers
  • 19. Assumptions & Acronyms Used
  • 20. Research Methodology

List of Tables

Table 1: Western Europe Industry Analysis and Outlook Value (US$ Million) Forecast by Country, 2018 to 2033

Table 2: Western Europe Industry Analysis and Outlook Volume (Sq. Meter) Forecast by Country, 2018 to 2033

Table 3: Western Europe Industry Analysis and Outlook Value (US$ Million) Forecast by Lamination Type, 2018 to 2033

Table 4: Western Europe Industry Analysis and Outlook Volume (Sq. Meter) Forecast by Lamination Type, 2018 to 2033

Table 5: Western Europe Industry Analysis and Outlook Value (US$ Million) Forecast by Material Type, 2018 to 2033

Table 6: Western Europe Industry Analysis and Outlook Volume (Sq. Meter) Forecast by Material Type, 2018 to 2033

Table 7: Western Europe Industry Analysis and Outlook Value (US$ Million) Forecast by Product Type, 2018 to 2033

Table 8: Western Europe Industry Analysis and Outlook Volume (Sq. Meter) Forecast by Product Type, 2018 to 2033

Table 9: Western Europe Industry Analysis and Outlook Value (US$ Million) Forecast by Product Weight, 2018 to 2033

Table 10: Western Europe Industry Analysis and Outlook Volume (Sq. Meter) Forecast by Product Weight, 2018 to 2033

Table 11: Western Europe Industry Analysis and Outlook Value (US$ Million) Forecast by End Use, 2018 to 2033

Table 12: Western Europe Industry Analysis and Outlook Volume (Sq. Meter) Forecast by End Use, 2018 to 2033

Table 13: UK Industry Analysis and Outlook Value (US$ Million) Forecast By Region, 2018 to 2033

Table 14: UK Industry Analysis and Outlook Volume (Sq. Meter) Forecast By Region, 2018 to 2033

Table 15: UK Industry Analysis and Outlook Value (US$ Million) Forecast by Lamination Type, 2018 to 2033

Table 16: UK Industry Analysis and Outlook Volume (Sq. Meter) Forecast by Lamination Type, 2018 to 2033

Table 17: UK Industry Analysis and Outlook Value (US$ Million) Forecast by Material Type, 2018 to 2033

Table 18: UK Industry Analysis and Outlook Volume (Sq. Meter) Forecast by Material Type, 2018 to 2033

Table 19: UK Industry Analysis and Outlook Value (US$ Million) Forecast by Product Type, 2018 to 2033

Table 20: UK Industry Analysis and Outlook Volume (Sq. Meter) Forecast by Product Type, 2018 to 2033

Table 21: UK Industry Analysis and Outlook Value (US$ Million) Forecast by Product Weight, 2018 to 2033

Table 22: UK Industry Analysis and Outlook Volume (Sq. Meter) Forecast by Product Weight, 2018 to 2033

Table 23: UK Industry Analysis and Outlook Value (US$ Million) Forecast by End Use, 2018 to 2033

Table 24: UK Industry Analysis and Outlook Volume (Sq. Meter) Forecast by End Use, 2018 to 2033

Table 25: Germany Industry Analysis and Outlook Value (US$ Million) Forecast By Region, 2018 to 2033

Table 26: Germany Industry Analysis and Outlook Volume (Sq. Meter) Forecast By Region, 2018 to 2033

Table 27: Germany Industry Analysis and Outlook Value (US$ Million) Forecast by Lamination Type, 2018 to 2033

Table 28: Germany Industry Analysis and Outlook Volume (Sq. Meter) Forecast by Lamination Type, 2018 to 2033

Table 29: Germany Industry Analysis and Outlook Value (US$ Million) Forecast by Material Type, 2018 to 2033

Table 30: Germany Industry Analysis and Outlook Volume (Sq. Meter) Forecast by Material Type, 2018 to 2033

Table 31: Germany Industry Analysis and Outlook Value (US$ Million) Forecast by Product Type, 2018 to 2033

Table 32: Germany Industry Analysis and Outlook Volume (Sq. Meter) Forecast by Product Type, 2018 to 2033

Table 33: Germany Industry Analysis and Outlook Value (US$ Million) Forecast by Product Weight, 2018 to 2033

Table 34: Germany Industry Analysis and Outlook Volume (Sq. Meter) Forecast by Product Weight, 2018 to 2033

Table 35: Germany Industry Analysis and Outlook Value (US$ Million) Forecast by End Use, 2018 to 2033

Table 36: Germany Industry Analysis and Outlook Volume (Sq. Meter) Forecast by End Use, 2018 to 2033

Table 37: Italy Industry Analysis and Outlook Value (US$ Million) Forecast By Region, 2018 to 2033

Table 38: Italy Industry Analysis and Outlook Volume (Sq. Meter) Forecast By Region, 2018 to 2033

Table 39: Italy Industry Analysis and Outlook Value (US$ Million) Forecast by Lamination Type, 2018 to 2033

Table 40: Italy Industry Analysis and Outlook Volume (Sq. Meter) Forecast by Lamination Type, 2018 to 2033

Table 41: Italy Industry Analysis and Outlook Value (US$ Million) Forecast by Material Type, 2018 to 2033

Table 42: Italy Industry Analysis and Outlook Volume (Sq. Meter) Forecast by Material Type, 2018 to 2033

Table 43: Italy Industry Analysis and Outlook Value (US$ Million) Forecast by Product Type, 2018 to 2033

Table 44: Italy Industry Analysis and Outlook Volume (Sq. Meter) Forecast by Product Type, 2018 to 2033

Table 45: Italy Industry Analysis and Outlook Value (US$ Million) Forecast by Product Weight, 2018 to 2033

Table 46: Italy Industry Analysis and Outlook Volume (Sq. Meter) Forecast by Product Weight, 2018 to 2033

Table 47: Italy Industry Analysis and Outlook Value (US$ Million) Forecast by End Use, 2018 to 2033

Table 48: Italy Industry Analysis and Outlook Volume (Sq. Meter) Forecast by End Use, 2018 to 2033

Table 49: France Industry Analysis and Outlook Value (US$ Million) Forecast By Region, 2018 to 2033

Table 50: France Industry Analysis and Outlook Volume (Sq. Meter) Forecast By Region, 2018 to 2033

Table 51: France Industry Analysis and Outlook Value (US$ Million) Forecast by Lamination Type, 2018 to 2033

Table 52: France Industry Analysis and Outlook Volume (Sq. Meter) Forecast by Lamination Type, 2018 to 2033

Table 53: France Industry Analysis and Outlook Value (US$ Million) Forecast by Material Type, 2018 to 2033

Table 54: France Industry Analysis and Outlook Volume (Sq. Meter) Forecast by Material Type, 2018 to 2033

Table 55: France Industry Analysis and Outlook Value (US$ Million) Forecast by Product Type, 2018 to 2033

Table 56: France Industry Analysis and Outlook Volume (Sq. Meter) Forecast by Product Type, 2018 to 2033

Table 57: France Industry Analysis and Outlook Value (US$ Million) Forecast by Product Weight, 2018 to 2033

Table 58: France Industry Analysis and Outlook Volume (Sq. Meter) Forecast by Product Weight, 2018 to 2033

Table 59: France Industry Analysis and Outlook Value (US$ Million) Forecast by End Use, 2018 to 2033

Table 60: France Industry Analysis and Outlook Volume (Sq. Meter) Forecast by End Use, 2018 to 2033

Table 61: Spain Industry Analysis and Outlook Value (US$ Million) Forecast By Region, 2018 to 2033

Table 62: Spain Industry Analysis and Outlook Volume (Sq. Meter) Forecast By Region, 2018 to 2033

Table 63: Spain Industry Analysis and Outlook Value (US$ Million) Forecast by Lamination Type, 2018 to 2033

Table 64: Spain Industry Analysis and Outlook Volume (Sq. Meter) Forecast by Lamination Type, 2018 to 2033

Table 65: Spain Industry Analysis and Outlook Value (US$ Million) Forecast by Material Type, 2018 to 2033

Table 66: Spain Industry Analysis and Outlook Volume (Sq. Meter) Forecast by Material Type, 2018 to 2033

Table 67: Spain Industry Analysis and Outlook Value (US$ Million) Forecast by Product Type, 2018 to 2033

Table 68: Spain Industry Analysis and Outlook Volume (Sq. Meter) Forecast by Product Type, 2018 to 2033

Table 69: Spain Industry Analysis and Outlook Value (US$ Million) Forecast by Product Weight, 2018 to 2033

Table 70: Spain Industry Analysis and Outlook Volume (Sq. Meter) Forecast by Product Weight, 2018 to 2033

Table 71: Spain Industry Analysis and Outlook Value (US$ Million) Forecast by End Use, 2018 to 2033

Table 72: Spain Industry Analysis and Outlook Volume (Sq. Meter) Forecast by End Use, 2018 to 2033

Table 73: Rest of Western Europe Industry Analysis and Outlook Value (US$ Million) Forecast by Lamination Type, 2018 to 2033

Table 74: Rest of Western Europe Industry Analysis and Outlook Volume (Sq. Meter) Forecast by Lamination Type, 2018 to 2033

Table 75: Rest of Western Europe Industry Analysis and Outlook Value (US$ Million) Forecast by Material Type, 2018 to 2033

Table 76: Rest of Western Europe Industry Analysis and Outlook Volume (Sq. Meter) Forecast by Material Type, 2018 to 2033

Table 77: Rest of Western Europe Industry Analysis and Outlook Value (US$ Million) Forecast by Product Type, 2018 to 2033

Table 78: Rest of Western Europe Industry Analysis and Outlook Volume (Sq. Meter) Forecast by Product Type, 2018 to 2033

Table 79: Rest of Western Europe Industry Analysis and Outlook Value (US$ Million) Forecast by Product Weight, 2018 to 2033

Table 80: Rest of Western Europe Industry Analysis and Outlook Volume (Sq. Meter) Forecast by Product Weight, 2018 to 2033

Table 81: Rest of Western Europe Industry Analysis and Outlook Value (US$ Million) Forecast by End Use, 2018 to 2033

Table 82: Rest of Western Europe Industry Analysis and Outlook Volume (Sq. Meter) Forecast by End Use, 2018 to 2033

List of Figures

Figure 1: Western Europe Industry Analysis and Outlook Value (US$ Million) by Lamination Type, 2023 to 2033

Figure 2: Western Europe Industry Analysis and Outlook Value (US$ Million) by Material Type, 2023 to 2033

Figure 3: Western Europe Industry Analysis and Outlook Value (US$ Million) by Product Type, 2023 to 2033

Figure 4: Western Europe Industry Analysis and Outlook Value (US$ Million) by Product Weight, 2023 to 2033

Figure 5: Western Europe Industry Analysis and Outlook Value (US$ Million) by End Use, 2023 to 2033

Figure 6: Western Europe Industry Analysis and Outlook Value (US$ Million) by Country, 2023 to 2033

Figure 7: Western Europe Industry Analysis and Outlook Value (US$ Million) Analysis by Country, 2018 to 2033

Figure 8: Western Europe Industry Analysis and Outlook Volume (Sq. Meter) Analysis by Country, 2018 to 2033

Figure 9: Western Europe Industry Analysis and Outlook Value Share (%) and BPS Analysis by Country, 2023 to 2033

Figure 10: Western Europe Industry Analysis and Outlook Y-o-Y Growth (%) Projections by Country, 2023 to 2033

Figure 11: Western Europe Industry Analysis and Outlook Value (US$ Million) Analysis by Lamination Type, 2018 to 2033

Figure 12: Western Europe Industry Analysis and Outlook Volume (Sq. Meter) Analysis by Lamination Type, 2018 to 2033

Figure 13: Western Europe Industry Analysis and Outlook Value Share (%) and BPS Analysis by Lamination Type, 2023 to 2033

Figure 14: Western Europe Industry Analysis and Outlook Y-o-Y Growth (%) Projections by Lamination Type, 2023 to 2033

Figure 15: Western Europe Industry Analysis and Outlook Value (US$ Million) Analysis by Material Type, 2018 to 2033

Figure 16: Western Europe Industry Analysis and Outlook Volume (Sq. Meter) Analysis by Material Type, 2018 to 2033

Figure 17: Western Europe Industry Analysis and Outlook Value Share (%) and BPS Analysis by Material Type, 2023 to 2033

Figure 18: Western Europe Industry Analysis and Outlook Y-o-Y Growth (%) Projections by Material Type, 2023 to 2033

Figure 19: Western Europe Industry Analysis and Outlook Value (US$ Million) Analysis by Product Type, 2018 to 2033

Figure 20: Western Europe Industry Analysis and Outlook Volume (Sq. Meter) Analysis by Product Type, 2018 to 2033

Figure 21: Western Europe Industry Analysis and Outlook Value Share (%) and BPS Analysis by Product Type, 2023 to 2033

Figure 22: Western Europe Industry Analysis and Outlook Y-o-Y Growth (%) Projections by Product Type, 2023 to 2033

Figure 23: Western Europe Industry Analysis and Outlook Value (US$ Million) Analysis by Product Weight, 2018 to 2033

Figure 24: Western Europe Industry Analysis and Outlook Volume (Sq. Meter) Analysis by Product Weight, 2018 to 2033

Figure 25: Western Europe Industry Analysis and Outlook Value Share (%) and BPS Analysis by Product Weight, 2023 to 2033

Figure 26: Western Europe Industry Analysis and Outlook Y-o-Y Growth (%) Projections by Product Weight, 2023 to 2033

Figure 27: Western Europe Industry Analysis and Outlook Value (US$ Million) Analysis by End Use, 2018 to 2033

Figure 28: Western Europe Industry Analysis and Outlook Volume (Sq. Meter) Analysis by End Use, 2018 to 2033

Figure 29: Western Europe Industry Analysis and Outlook Value Share (%) and BPS Analysis by End Use, 2023 to 2033

Figure 30: Western Europe Industry Analysis and Outlook Y-o-Y Growth (%) Projections by End Use, 2023 to 2033

Figure 31: Western Europe Industry Analysis and Outlook Attractiveness by Lamination Type, 2023 to 2033

Figure 32: Western Europe Industry Analysis and Outlook Attractiveness by Material Type, 2023 to 2033

Figure 33: Western Europe Industry Analysis and Outlook Attractiveness by Product Type, 2023 to 2033

Figure 34: Western Europe Industry Analysis and Outlook Attractiveness by Product Weight, 2023 to 2033

Figure 35: Western Europe Industry Analysis and Outlook Attractiveness by End Use, 2023 to 2033

Figure 36: Western Europe Industry Analysis and Outlook Attractiveness by Region, 2023 to 2033

Figure 37: UK Industry Analysis and Outlook Value (US$ Million) by Lamination Type, 2023 to 2033

Figure 38: UK Industry Analysis and Outlook Value (US$ Million) by Material Type, 2023 to 2033

Figure 39: UK Industry Analysis and Outlook Value (US$ Million) by Product Type, 2023 to 2033

Figure 40: UK Industry Analysis and Outlook Value (US$ Million) by Product Weight, 2023 to 2033

Figure 41: UK Industry Analysis and Outlook Value (US$ Million) by End Use, 2023 to 2033

Figure 42: UK Industry Analysis and Outlook Value (US$ Million) By Region, 2023 to 2033

Figure 43: UK Industry Analysis and Outlook Value (US$ Million) Analysis By Region, 2018 to 2033

Figure 44: UK Industry Analysis and Outlook Volume (Sq. Meter) Analysis By Region, 2018 to 2033

Figure 45: UK Industry Analysis and Outlook Value Share (%) and BPS Analysis By Region, 2023 to 2033

Figure 46: UK Industry Analysis and Outlook Y-o-Y Growth (%) Projections By Region, 2023 to 2033

Figure 47: UK Industry Analysis and Outlook Value (US$ Million) Analysis by Lamination Type, 2018 to 2033

Figure 48: UK Industry Analysis and Outlook Volume (Sq. Meter) Analysis by Lamination Type, 2018 to 2033

Figure 49: UK Industry Analysis and Outlook Value Share (%) and BPS Analysis by Lamination Type, 2023 to 2033

Figure 50: UK Industry Analysis and Outlook Y-o-Y Growth (%) Projections by Lamination Type, 2023 to 2033

Figure 51: UK Industry Analysis and Outlook Value (US$ Million) Analysis by Material Type, 2018 to 2033

Figure 52: UK Industry Analysis and Outlook Volume (Sq. Meter) Analysis by Material Type, 2018 to 2033

Figure 53: UK Industry Analysis and Outlook Value Share (%) and BPS Analysis by Material Type, 2023 to 2033

Figure 54: UK Industry Analysis and Outlook Y-o-Y Growth (%) Projections by Material Type, 2023 to 2033

Figure 55: UK Industry Analysis and Outlook Value (US$ Million) Analysis by Product Type, 2018 to 2033

Figure 56: UK Industry Analysis and Outlook Volume (Sq. Meter) Analysis by Product Type, 2018 to 2033

Figure 57: UK Industry Analysis and Outlook Value Share (%) and BPS Analysis by Product Type, 2023 to 2033

Figure 58: UK Industry Analysis and Outlook Y-o-Y Growth (%) Projections by Product Type, 2023 to 2033

Figure 59: UK Industry Analysis and Outlook Value (US$ Million) Analysis by Product Weight, 2018 to 2033

Figure 60: UK Industry Analysis and Outlook Volume (Sq. Meter) Analysis by Product Weight, 2018 to 2033

Figure 61: UK Industry Analysis and Outlook Value Share (%) and BPS Analysis by Product Weight, 2023 to 2033

Figure 62: UK Industry Analysis and Outlook Y-o-Y Growth (%) Projections by Product Weight, 2023 to 2033

Figure 63: UK Industry Analysis and Outlook Value (US$ Million) Analysis by End Use, 2018 to 2033

Figure 64: UK Industry Analysis and Outlook Volume (Sq. Meter) Analysis by End Use, 2018 to 2033

Figure 65: UK Industry Analysis and Outlook Value Share (%) and BPS Analysis by End Use, 2023 to 2033

Figure 66: UK Industry Analysis and Outlook Y-o-Y Growth (%) Projections by End Use, 2023 to 2033

Figure 67: UK Industry Analysis and Outlook Attractiveness by Lamination Type, 2023 to 2033

Figure 68: UK Industry Analysis and Outlook Attractiveness by Material Type, 2023 to 2033

Figure 69: UK Industry Analysis and Outlook Attractiveness by Product Type, 2023 to 2033

Figure 70: UK Industry Analysis and Outlook Attractiveness by Product Weight, 2023 to 2033

Figure 71: UK Industry Analysis and Outlook Attractiveness by End Use, 2023 to 2033

Figure 72: UK Industry Analysis and Outlook Attractiveness By Region, 2023 to 2033

Figure 73: Germany Industry Analysis and Outlook Value (US$ Million) by Lamination Type, 2023 to 2033

Figure 74: Germany Industry Analysis and Outlook Value (US$ Million) by Material Type, 2023 to 2033

Figure 75: Germany Industry Analysis and Outlook Value (US$ Million) by Product Type, 2023 to 2033

Figure 76: Germany Industry Analysis and Outlook Value (US$ Million) by Product Weight, 2023 to 2033

Figure 77: Germany Industry Analysis and Outlook Value (US$ Million) by End Use, 2023 to 2033

Figure 78: Germany Industry Analysis and Outlook Value (US$ Million) By Region, 2023 to 2033

Figure 79: Germany Industry Analysis and Outlook Value (US$ Million) Analysis By Region, 2018 to 2033

Figure 80: Germany Industry Analysis and Outlook Volume (Sq. Meter) Analysis By Region, 2018 to 2033

Figure 81: Germany Industry Analysis and Outlook Value Share (%) and BPS Analysis By Region, 2023 to 2033

Figure 82: Germany Industry Analysis and Outlook Y-o-Y Growth (%) Projections By Region, 2023 to 2033

Figure 83: Germany Industry Analysis and Outlook Value (US$ Million) Analysis by Lamination Type, 2018 to 2033

Figure 84: Germany Industry Analysis and Outlook Volume (Sq. Meter) Analysis by Lamination Type, 2018 to 2033

Figure 85: Germany Industry Analysis and Outlook Value Share (%) and BPS Analysis by Lamination Type, 2023 to 2033

Figure 86: Germany Industry Analysis and Outlook Y-o-Y Growth (%) Projections by Lamination Type, 2023 to 2033

Figure 87: Germany Industry Analysis and Outlook Value (US$ Million) Analysis by Material Type, 2018 to 2033

Figure 88: Germany Industry Analysis and Outlook Volume (Sq. Meter) Analysis by Material Type, 2018 to 2033

Figure 89: Germany Industry Analysis and Outlook Value Share (%) and BPS Analysis by Material Type, 2023 to 2033

Figure 90: Germany Industry Analysis and Outlook Y-o-Y Growth (%) Projections by Material Type, 2023 to 2033

Figure 91: Germany Industry Analysis and Outlook Value (US$ Million) Analysis by Product Type, 2018 to 2033

Figure 92: Germany Industry Analysis and Outlook Volume (Sq. Meter) Analysis by Product Type, 2018 to 2033

Figure 93: Germany Industry Analysis and Outlook Value Share (%) and BPS Analysis by Product Type, 2023 to 2033

Figure 94: Germany Industry Analysis and Outlook Y-o-Y Growth (%) Projections by Product Type, 2023 to 2033

Figure 95: Germany Industry Analysis and Outlook Value (US$ Million) Analysis by Product Weight, 2018 to 2033

Figure 96: Germany Industry Analysis and Outlook Volume (Sq. Meter) Analysis by Product Weight, 2018 to 2033

Figure 97: Germany Industry Analysis and Outlook Value Share (%) and BPS Analysis by Product Weight, 2023 to 2033

Figure 98: Germany Industry Analysis and Outlook Y-o-Y Growth (%) Projections by Product Weight, 2023 to 2033

Figure 99: Germany Industry Analysis and Outlook Value (US$ Million) Analysis by End Use, 2018 to 2033

Figure 100: Germany Industry Analysis and Outlook Volume (Sq. Meter) Analysis by End Use, 2018 to 2033

Figure 101: Germany Industry Analysis and Outlook Value Share (%) and BPS Analysis by End Use, 2023 to 2033

Figure 102: Germany Industry Analysis and Outlook Y-o-Y Growth (%) Projections by End Use, 2023 to 2033

Figure 103: Germany Industry Analysis and Outlook Attractiveness by Lamination Type, 2023 to 2033

Figure 104: Germany Industry Analysis and Outlook Attractiveness by Material Type, 2023 to 2033

Figure 105: Germany Industry Analysis and Outlook Attractiveness by Product Type, 2023 to 2033

Figure 106: Germany Industry Analysis and Outlook Attractiveness by Product Weight, 2023 to 2033

Figure 107: Germany Industry Analysis and Outlook Attractiveness by End Use, 2023 to 2033

Figure 108: Germany Industry Analysis and Outlook Attractiveness By Region, 2023 to 2033

Figure 109: Italy Industry Analysis and Outlook Value (US$ Million) by Lamination Type, 2023 to 2033

Figure 110: Italy Industry Analysis and Outlook Value (US$ Million) by Material Type, 2023 to 2033

Figure 111: Italy Industry Analysis and Outlook Value (US$ Million) by Product Type, 2023 to 2033

Figure 112: Italy Industry Analysis and Outlook Value (US$ Million) by Product Weight, 2023 to 2033

Figure 113: Italy Industry Analysis and Outlook Value (US$ Million) by End Use, 2023 to 2033

Figure 114: Italy Industry Analysis and Outlook Value (US$ Million) By Region, 2023 to 2033

Figure 115: Italy Industry Analysis and Outlook Value (US$ Million) Analysis By Region, 2018 to 2033

Figure 116: Italy Industry Analysis and Outlook Volume (Sq. Meter) Analysis By Region, 2018 to 2033

Figure 117: Italy Industry Analysis and Outlook Value Share (%) and BPS Analysis By Region, 2023 to 2033

Figure 118: Italy Industry Analysis and Outlook Y-o-Y Growth (%) Projections By Region, 2023 to 2033

Figure 119: Italy Industry Analysis and Outlook Value (US$ Million) Analysis by Lamination Type, 2018 to 2033

Figure 120: Italy Industry Analysis and Outlook Volume (Sq. Meter) Analysis by Lamination Type, 2018 to 2033

Figure 121: Italy Industry Analysis and Outlook Value Share (%) and BPS Analysis by Lamination Type, 2023 to 2033

Figure 122: Italy Industry Analysis and Outlook Y-o-Y Growth (%) Projections by Lamination Type, 2023 to 2033

Figure 123: Italy Industry Analysis and Outlook Value (US$ Million) Analysis by Material Type, 2018 to 2033

Figure 124: Italy Industry Analysis and Outlook Volume (Sq. Meter) Analysis by Material Type, 2018 to 2033

Figure 125: Italy Industry Analysis and Outlook Value Share (%) and BPS Analysis by Material Type, 2023 to 2033

Figure 126: Italy Industry Analysis and Outlook Y-o-Y Growth (%) Projections by Material Type, 2023 to 2033

Figure 127: Italy Industry Analysis and Outlook Value (US$ Million) Analysis by Product Type, 2018 to 2033

Figure 128: Italy Industry Analysis and Outlook Volume (Sq. Meter) Analysis by Product Type, 2018 to 2033

Figure 129: Italy Industry Analysis and Outlook Value Share (%) and BPS Analysis by Product Type, 2023 to 2033

Figure 130: Italy Industry Analysis and Outlook Y-o-Y Growth (%) Projections by Product Type, 2023 to 2033

Figure 131: Italy Industry Analysis and Outlook Value (US$ Million) Analysis by Product Weight, 2018 to 2033

Figure 132: Italy Industry Analysis and Outlook Volume (Sq. Meter) Analysis by Product Weight, 2018 to 2033

Figure 133: Italy Industry Analysis and Outlook Value Share (%) and BPS Analysis by Product Weight, 2023 to 2033

Figure 134: Italy Industry Analysis and Outlook Y-o-Y Growth (%) Projections by Product Weight, 2023 to 2033

Figure 135: Italy Industry Analysis and Outlook Value (US$ Million) Analysis by End Use, 2018 to 2033

Figure 136: Italy Industry Analysis and Outlook Volume (Sq. Meter) Analysis by End Use, 2018 to 2033

Figure 137: Italy Industry Analysis and Outlook Value Share (%) and BPS Analysis by End Use, 2023 to 2033

Figure 138: Italy Industry Analysis and Outlook Y-o-Y Growth (%) Projections by End Use, 2023 to 2033

Figure 139: Italy Industry Analysis and Outlook Attractiveness by Lamination Type, 2023 to 2033

Figure 140: Italy Industry Analysis and Outlook Attractiveness by Material Type, 2023 to 2033

Figure 141: Italy Industry Analysis and Outlook Attractiveness by Product Type, 2023 to 2033

Figure 142: Italy Industry Analysis and Outlook Attractiveness by Product Weight, 2023 to 2033

Figure 143: Italy Industry Analysis and Outlook Attractiveness by End Use, 2023 to 2033

Figure 144: Italy Industry Analysis and Outlook Attractiveness By Region, 2023 to 2033

Figure 145: France Industry Analysis and Outlook Value (US$ Million) by Lamination Type, 2023 to 2033

Figure 146: France Industry Analysis and Outlook Value (US$ Million) by Material Type, 2023 to 2033

Figure 147: France Industry Analysis and Outlook Value (US$ Million) by Product Type, 2023 to 2033

Figure 148: France Industry Analysis and Outlook Value (US$ Million) by Product Weight, 2023 to 2033

Figure 149: France Industry Analysis and Outlook Value (US$ Million) by End Use, 2023 to 2033

Figure 150: France Industry Analysis and Outlook Value (US$ Million) By Region, 2023 to 2033

Figure 151: France Industry Analysis and Outlook Value (US$ Million) Analysis By Region, 2018 to 2033

Figure 152: France Industry Analysis and Outlook Volume (Sq. Meter) Analysis By Region, 2018 to 2033

Figure 153: France Industry Analysis and Outlook Value Share (%) and BPS Analysis By Region, 2023 to 2033

Figure 154: France Industry Analysis and Outlook Y-o-Y Growth (%) Projections By Region, 2023 to 2033

Figure 155: France Industry Analysis and Outlook Value (US$ Million) Analysis by Lamination Type, 2018 to 2033

Figure 156: France Industry Analysis and Outlook Volume (Sq. Meter) Analysis by Lamination Type, 2018 to 2033

Figure 157: France Industry Analysis and Outlook Value Share (%) and BPS Analysis by Lamination Type, 2023 to 2033

Figure 158: France Industry Analysis and Outlook Y-o-Y Growth (%) Projections by Lamination Type, 2023 to 2033

Figure 159: France Industry Analysis and Outlook Value (US$ Million) Analysis by Material Type, 2018 to 2033

Figure 160: France Industry Analysis and Outlook Volume (Sq. Meter) Analysis by Material Type, 2018 to 2033

Figure 161: France Industry Analysis and Outlook Value Share (%) and BPS Analysis by Material Type, 2023 to 2033

Figure 162: France Industry Analysis and Outlook Y-o-Y Growth (%) Projections by Material Type, 2023 to 2033

Figure 163: France Industry Analysis and Outlook Value (US$ Million) Analysis by Product Type, 2018 to 2033

Figure 164: France Industry Analysis and Outlook Volume (Sq. Meter) Analysis by Product Type, 2018 to 2033

Figure 165: France Industry Analysis and Outlook Value Share (%) and BPS Analysis by Product Type, 2023 to 2033

Figure 166: France Industry Analysis and Outlook Y-o-Y Growth (%) Projections by Product Type, 2023 to 2033

Figure 167: France Industry Analysis and Outlook Value (US$ Million) Analysis by Product Weight, 2018 to 2033

Figure 168: France Industry Analysis and Outlook Volume (Sq. Meter) Analysis by Product Weight, 2018 to 2033

Figure 169: France Industry Analysis and Outlook Value Share (%) and BPS Analysis by Product Weight, 2023 to 2033

Figure 170: France Industry Analysis and Outlook Y-o-Y Growth (%) Projections by Product Weight, 2023 to 2033

Figure 171: France Industry Analysis and Outlook Value (US$ Million) Analysis by End Use, 2018 to 2033

Figure 172: France Industry Analysis and Outlook Volume (Sq. Meter) Analysis by End Use, 2018 to 2033

Figure 173: France Industry Analysis and Outlook Value Share (%) and BPS Analysis by End Use, 2023 to 2033

Figure 174: France Industry Analysis and Outlook Y-o-Y Growth (%) Projections by End Use, 2023 to 2033

Figure 175: France Industry Analysis and Outlook Attractiveness by Lamination Type, 2023 to 2033

Figure 176: France Industry Analysis and Outlook Attractiveness by Material Type, 2023 to 2033

Figure 177: France Industry Analysis and Outlook Attractiveness by Product Type, 2023 to 2033

Figure 178: France Industry Analysis and Outlook Attractiveness by Product Weight, 2023 to 2033

Figure 179: France Industry Analysis and Outlook Attractiveness by End Use, 2023 to 2033

Figure 180: France Industry Analysis and Outlook Attractiveness By Region, 2023 to 2033

Figure 181: Spain Industry Analysis and Outlook Value (US$ Million) by Lamination Type, 2023 to 2033

Figure 182: Spain Industry Analysis and Outlook Value (US$ Million) by Material Type, 2023 to 2033

Figure 183: Spain Industry Analysis and Outlook Value (US$ Million) by Product Type, 2023 to 2033

Figure 184: Spain Industry Analysis and Outlook Value (US$ Million) by Product Weight, 2023 to 2033

Figure 185: Spain Industry Analysis and Outlook Value (US$ Million) by End Use, 2023 to 2033

Figure 186: Spain Industry Analysis and Outlook Value (US$ Million) By Region, 2023 to 2033

Figure 187: Spain Industry Analysis and Outlook Value (US$ Million) Analysis By Region, 2018 to 2033

Figure 188: Spain Industry Analysis and Outlook Volume (Sq. Meter) Analysis By Region, 2018 to 2033

Figure 189: Spain Industry Analysis and Outlook Value Share (%) and BPS Analysis By Region, 2023 to 2033

Figure 190: Spain Industry Analysis and Outlook Y-o-Y Growth (%) Projections By Region, 2023 to 2033

Figure 191: Spain Industry Analysis and Outlook Value (US$ Million) Analysis by Lamination Type, 2018 to 2033

Figure 192: Spain Industry Analysis and Outlook Volume (Sq. Meter) Analysis by Lamination Type, 2018 to 2033

Figure 193: Spain Industry Analysis and Outlook Value Share (%) and BPS Analysis by Lamination Type, 2023 to 2033

Figure 194: Spain Industry Analysis and Outlook Y-o-Y Growth (%) Projections by Lamination Type, 2023 to 2033

Figure 195: Spain Industry Analysis and Outlook Value (US$ Million) Analysis by Material Type, 2018 to 2033

Figure 196: Spain Industry Analysis and Outlook Volume (Sq. Meter) Analysis by Material Type, 2018 to 2033

Figure 197: Spain Industry Analysis and Outlook Value Share (%) and BPS Analysis by Material Type, 2023 to 2033

Figure 198: Spain Industry Analysis and Outlook Y-o-Y Growth (%) Projections by Material Type, 2023 to 2033

Figure 199: Spain Industry Analysis and Outlook Value (US$ Million) Analysis by Product Type, 2018 to 2033

Figure 200: Spain Industry Analysis and Outlook Volume (Sq. Meter) Analysis by Product Type, 2018 to 2033

Figure 201: Spain Industry Analysis and Outlook Value Share (%) and BPS Analysis by Product Type, 2023 to 2033

Figure 202: Spain Industry Analysis and Outlook Y-o-Y Growth (%) Projections by Product Type, 2023 to 2033

Figure 203: Spain Industry Analysis and Outlook Value (US$ Million) Analysis by Product Weight, 2018 to 2033

Figure 204: Spain Industry Analysis and Outlook Volume (Sq. Meter) Analysis by Product Weight, 2018 to 2033

Figure 205: Spain Industry Analysis and Outlook Value Share (%) and BPS Analysis by Product Weight, 2023 to 2033

Figure 206: Spain Industry Analysis and Outlook Y-o-Y Growth (%) Projections by Product Weight, 2023 to 2033

Figure 207: Spain Industry Analysis and Outlook Value (US$ Million) Analysis by End Use, 2018 to 2033

Figure 208: Spain Industry Analysis and Outlook Volume (Sq. Meter) Analysis by End Use, 2018 to 2033

Figure 209: Spain Industry Analysis and Outlook Value Share (%) and BPS Analysis by End Use, 2023 to 2033

Figure 210: Spain Industry Analysis and Outlook Y-o-Y Growth (%) Projections by End Use, 2023 to 2033

Figure 211: Spain Industry Analysis and Outlook Attractiveness by Lamination Type, 2023 to 2033

Figure 212: Spain Industry Analysis and Outlook Attractiveness by Material Type, 2023 to 2033

Figure 213: Spain Industry Analysis and Outlook Attractiveness by Product Type, 2023 to 2033

Figure 214: Spain Industry Analysis and Outlook Attractiveness by Product Weight, 2023 to 2033

Figure 215: Spain Industry Analysis and Outlook Attractiveness by End Use, 2023 to 2033

Figure 216: Spain Industry Analysis and Outlook Attractiveness By Region, 2023 to 2033

Figure 217: Rest of Western Europe Industry Analysis and Outlook Value (US$ Million) by Lamination Type, 2023 to 2033

Figure 218: Rest of Western Europe Industry Analysis and Outlook Value (US$ Million) by Material Type, 2023 to 2033

Figure 219: Rest of Western Europe Industry Analysis and Outlook Value (US$ Million) by Product Type, 2023 to 2033

Figure 220: Rest of Western Europe Industry Analysis and Outlook Value (US$ Million) by Product Weight, 2023 to 2033

Figure 221: Rest of Western Europe Industry Analysis and Outlook Value (US$ Million) by End Use, 2023 to 2033

Figure 222: Rest of Western Europe Industry Analysis and Outlook Value (US$ Million) Analysis by Lamination Type, 2018 to 2033

Figure 223: Rest of Western Europe Industry Analysis and Outlook Volume (Sq. Meter) Analysis by Lamination Type, 2018 to 2033

Figure 224: Rest of Western Europe Industry Analysis and Outlook Value Share (%) and BPS Analysis by Lamination Type, 2023 to 2033

Figure 225: Rest of Western Europe Industry Analysis and Outlook Y-o-Y Growth (%) Projections by Lamination Type, 2023 to 2033

Figure 226: Rest of Western Europe Industry Analysis and Outlook Value (US$ Million) Analysis by Material Type, 2018 to 2033

Figure 227: Rest of Western Europe Industry Analysis and Outlook Volume (Sq. Meter) Analysis by Material Type, 2018 to 2033

Figure 228: Rest of Western Europe Industry Analysis and Outlook Value Share (%) and BPS Analysis by Material Type, 2023 to 2033

Figure 229: Rest of Western Europe Industry Analysis and Outlook Y-o-Y Growth (%) Projections by Material Type, 2023 to 2033

Figure 230: Rest of Western Europe Industry Analysis and Outlook Value (US$ Million) Analysis by Product Type, 2018 to 2033

Figure 231: Rest of Western Europe Industry Analysis and Outlook Volume (Sq. Meter) Analysis by Product Type, 2018 to 2033

Figure 232: Rest of Western Europe Industry Analysis and Outlook Value Share (%) and BPS Analysis by Product Type, 2023 to 2033

Figure 233: Rest of Western Europe Industry Analysis and Outlook Y-o-Y Growth (%) Projections by Product Type, 2023 to 2033

Figure 234: Rest of Western Europe Industry Analysis and Outlook Value (US$ Million) Analysis by Product Weight, 2018 to 2033

Figure 235: Rest of Western Europe Industry Analysis and Outlook Volume (Sq. Meter) Analysis by Product Weight, 2018 to 2033

Figure 236: Rest of Western Europe Industry Analysis and Outlook Value Share (%) and BPS Analysis by Product Weight, 2023 to 2033

Figure 237: Rest of Western Europe Industry Analysis and Outlook Y-o-Y Growth (%) Projections by Product Weight, 2023 to 2033

Figure 238: Rest of Western Europe Industry Analysis and Outlook Value (US$ Million) Analysis by End Use, 2018 to 2033

Figure 239: Rest of Western Europe Industry Analysis and Outlook Volume (Sq. Meter) Analysis by End Use, 2018 to 2033

Figure 240: Rest of Western Europe Industry Analysis and Outlook Value Share (%) and BPS Analysis by End Use, 2023 to 2033

Figure 241: Rest of Western Europe Industry Analysis and Outlook Y-o-Y Growth (%) Projections by End Use, 2023 to 2033

Figure 242: Rest of Western Europe Industry Analysis and Outlook Attractiveness by Lamination Type, 2023 to 2033

Figure 243: Rest of Western Europe Industry Analysis and Outlook Attractiveness by Material Type, 2023 to 2033

Figure 244: Rest of Western Europe Industry Analysis and Outlook Attractiveness by Product Type, 2023 to 2033

Figure 245: Rest of Western Europe Industry Analysis and Outlook Attractiveness by Product Weight, 2023 to 2033

Figure 246: Rest of Western Europe Industry Analysis and Outlook Attractiveness by End Use, 2023 to 2033

Frequently Asked Questions

At What Rate is the Tarpaulin Sheet Sector Growing in Western Europe?

The anticipated CAGR of tarpaulin sheet sales in Western Europe through 2033 is 2.8%.

How Big Will the Tarpaulin Sheets Industry be in Western Europe?

Demand for tarpaulin sheet in Western Europe countries is likely to be USD 1,915.6 million by 2033.

What are the Key Strategies Providers Adopt in the Tarpaulin Sheets Industry in Western Europe?

Tarpaulin sheet providers customize their product offerings to cater to a broader range of applications.

Which is the Leading Product Type for Tarpaulin Sheet in Western Europe Countries?

The hoarding tarps segment leads the industry acquiring a share of 35.8% in 2023.

Which End Use Contributes Significantly in the Tarpaulin Sheet Industry in Western Europe?

The contribution of the agriculture sector to the demand for tarpaulin sheets in Western European countries is significant.

Explore Plastic Packaging Insights

Future Market Insights

Tarpaulin Sheet Industry Analysis in Western Europe