The balance sheet management software industry stands at the threshold of a decade-long expansion trajectory that promises to reshape financial reporting technology and enterprise risk management solutions. The market's journey from USD 1,207.9 million in 2025 to USD 1,704.0 million by 2035 represents substantial growth, demonstrating the accelerating adoption of automated reconciliation platforms and real-time financial analysis technology across large enterprises, financial institutions, and corporate finance sectors.
The first half of the decade (2025-2030) will witness the market climbing from USD 1,207.9 million to approximately USD 1,485.0 million, adding USD 277.1 million in value, which constitutes 56% of the total forecast growth period. This phase will be characterized by the rapid adoption of cloud-based financial platforms, driven by increasing regulatory compliance requirements and the growing need for real-time balance sheet visibility solutions worldwide. Advanced automation capabilities and AI-powered variance analysis will become standard expectations rather than premium options.
The latter half (2030-2035) will witness sustained growth from USD 1,485.0 million to USD 1,704.0 million, representing an addition of USD 219.0 million or 44% of the decade's expansion. This period will be defined by mass market penetration of intelligent financial management technologies, integration with comprehensive enterprise resource planning platforms, and seamless compatibility with existing financial system infrastructure. The market trajectory signals fundamental shifts in how finance departments approach balance sheet accuracy and financial close optimization, with participants positioned to benefit from sustained demand across multiple deployment models and enterprise segments.
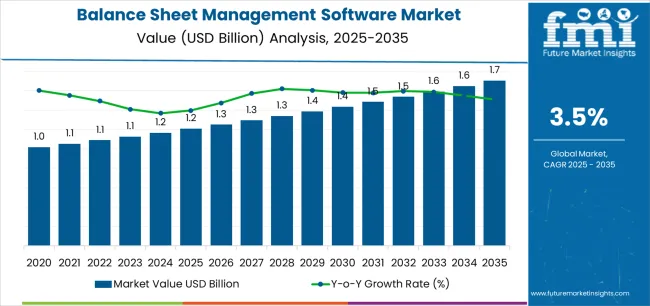
The balance sheet management software market demonstrates distinct growth phases with varying market characteristics and competitive dynamics. Between 2025 and 2030, the market progresses through its financial automation acceleration phase, expanding from USD 1,207.9 million to USD 1,485.0 million with steady annual increments averaging 3.5% growth. This period showcases the transition from manual spreadsheet processes to automated cloud platforms with enhanced reconciliation capabilities and integrated audit trail functionality becoming mainstream features.
The 2025-2030 phase adds USD 277.1 million to market value, representing 56% of total decade expansion. Market maturation factors include standardization of financial close protocols, declining implementation costs for cloud platforms, and increasing finance department awareness of automation benefits reaching 96-99% reconciliation accuracy in balance sheet management. Competitive landscape evolution during this period features established financial software providers like BlackLine and Oracle expanding their balance sheet portfolios while fintech innovators focus on AI-driven exception management development and enhanced continuous accounting capabilities.
From 2030 to 2035, market dynamics shift toward predictive analytics and global financial standardization, with growth continuing from USD 1,485.0 million to USD 1,704.0 million, adding USD 219.0 million or 44% of total expansion. This phase transition centers on autonomous reconciliation systems, integration with treasury management networks, and deployment across diverse organizational scenarios, becoming standard rather than specialized finance applications. The competitive environment matures with focus shifting from basic reconciliation capability to comprehensive financial transformation enablement systems and integration with corporate performance management platforms.
| Metric | Value |
|---|---|
| Market Value (2025) | USD 1,207.9 million |
| Market Forecast (2035) | USD 1,704.0 million |
| Growth Rate | 3.5% CAGR |
| Leading Deployment Type | Cloud-based |
| Primary Application | Large Enterprises Segment |
The market demonstrates strong fundamentals with cloud-based deployment capturing a dominant share through advanced accessibility and automated update capabilities. Large enterprise applications drive primary demand, supported by increasing financial complexity management requirements and regulatory compliance modernization needs. Geographic expansion remains concentrated in developed markets with established corporate finance infrastructure, while emerging economies show accelerating adoption rates driven by financial digitization acceleration and rising accounting standards.
Market expansion rests on three fundamental shifts driving adoption across corporate finance and accounting sectors. First, regulatory compliance pressure creates compelling operational demand through balance sheet management software that provides automated reconciliation without manual intervention, enabling finance teams to meet reporting deadlines while maintaining accuracy standards and reducing compliance risks. Second, financial close acceleration requirements intensify as organizations worldwide seek automated solutions that complement traditional accounting processes, enabling faster reporting cycles and variance detection that align with stakeholder expectations and market reporting obligations.
Third, audit preparedness demands drive adoption from public companies and regulated entities requiring comprehensive documentation that enhances audit efficiency while maintaining long-term data retention during financial review operations. However, growth faces headwinds from implementation complexity challenges that vary across organizations regarding legacy system integration and data migration requirements, which may limit adoption in companies with heterogeneous financial systems. Change management obstacles also persist regarding user adoption resistance and process redesign requirements that may reduce implementation success rates in traditional finance departments, which affect ROI realization and organizational satisfaction.
The balance sheet management software market represents a critical enterprise finance opportunity driven by expanding regulatory complexity, financial close optimization, and the need for superior reconciliation accuracy in financial reporting processes. As finance departments worldwide seek to achieve 96-99% reconciliation accuracy, reduce close cycle times, and integrate advanced automation platforms with comprehensive financial systems, balance sheet management software is evolving from basic reconciliation tools to sophisticated financial transformation solutions that ensure reporting quality and operational efficiency.
The convergence of regulatory complexity growth, digital finance advancement, and automation technology development creates sustained demand drivers across multiple enterprise segments. The market's growth trajectory from USD 1,207.9 million in 2025 to USD 1,704.0 million by 2035 at a 3.5% CAGR reflects fundamental shifts in finance department requirements and financial close optimization.
Geographic expansion opportunities are particularly pronounced in Asia-Pacific markets, where China (4.7% CAGR) and India (4.4% CAGR) lead through aggressive financial digitization initiatives and corporate governance enhancement. The dominance of cloud-based deployment systems (62.0% market share) and large enterprise applications (65.0% share) provides clear strategic focus areas, while emerging continuous accounting adoption and managed finance services open new revenue streams across diverse corporate markets.
Strengthening the dominant cloud-based deployment segment (62.0% market share) through enhanced scalability, superior integration characteristics, subscription pricing optimization, and seamless compatibility with modern financial infrastructure. This pathway focuses on optimizing API connectivity, improving processing speed performance, extending ERP integration to 25-30 major platforms, and developing specialized capabilities for complex accounting scenarios. Market leadership consolidation through advanced cloud architecture, comprehensive security frameworks, and multi-entity optimization enables premium positioning while defending competitive advantages against on-premises alternatives. Expected revenue pool: USD 95-125 million
Strategic expansion within local deployment technology (38.0% market share) through enhanced data sovereignty, comprehensive customization options, and on-premises infrastructure optimization for control-focused enterprises. This pathway addresses regulatory isolation requirements, air-gapped environment support, and complete system control with advanced local processing for demanding security standards. Premium positioning reflects data governance leadership, compliance customization, and control capabilities while enabling access to government finance programs and highly-regulated financial institution networks. Expected revenue pool: USD 58-76 million
Expansion within the dominant large enterprise segment (65.0% market share) through specialized multi-entity consolidation, intercompany reconciliation automation, and comprehensive audit trail support for enterprise organizations. This pathway encompasses high-volume transaction handling, complex hierarchy management, global compliance reporting, and compatibility with diverse accounting scenarios. Premium positioning reflects superior reconciliation reliability, consistent financial outcomes, and comprehensive enterprise support that enables modern financial operations while facilitating integration with corporate governance and risk management platforms. Expected revenue pool: USD 125-163 million
Development within small and medium-sized business applications (35.0% share) addressing affordable subscription models, intuitive user interfaces, and specialized self-implementation capabilities for resource-constrained finance teams. This pathway encompasses guided setup workflows, pre-configured templates, tiered pricing structures, and automated help resources for streamlined adoption. Technology differentiation through simplified design, rapid deployment capabilities, and comprehensive online training enables competitive pricing while expanding addressable market opportunities across growing mid-market and emerging company segments. Expected revenue pool: USD 67-88 million
Rapid financial digitization acceleration across China (4.7% CAGR) and India (4.4% CAGR) creates substantial expansion opportunities through local accounting standard support, regional partner development, and comprehensive localization infrastructure. Growing corporate governance adoption, financial reporting standardization, and regulatory compliance programs drive sustained demand for balance sheet platforms. Localization strategies reduce implementation barriers, enable multi-currency support, and position companies advantageously for enterprise procurement programs while accessing growing domestic markets requiring financial management solutions. Expected revenue pool: USD 72-94 million
Integration of continuous accounting methodologies through real-time reconciliation, automated variance investigation, and comprehensive anomaly detection for progressive finance transformation. This pathway encompasses perpetual close processes, daily reconciliation automation, predictive exception identification, and extensive analytics for financial accuracy enhancement. Premium positioning through automation sophistication, accuracy optimization, and comprehensive insights creates opportunities for advisory service revenue models through technology-enabled finance advancement. Expected revenue pool: USD 48-63 million
Primary Classification: The market segments by deployment type into Cloud-based and Local Deployment categories, representing the evolution from on-premises financial systems to advanced cloud-native platforms for comprehensive balance sheet optimization.
Secondary Classification: Application segmentation divides the market into Large Enterprises and Small and Medium-sized Enterprises sectors, reflecting distinct requirements for transaction volumes, complexity management, and support level standards.
Regional Classification: Geographic distribution covers Asia Pacific, Europe, North America, Latin America, and the Middle East & Africa, with developed markets leading adoption while emerging economies show accelerating growth patterns driven by financial digitization acceleration programs.
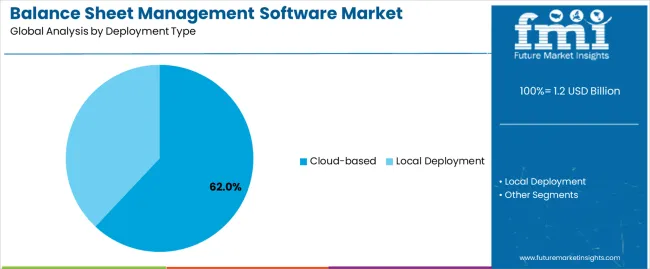
Market Position: Cloud-based deployment models command the leading position in the balance sheet management software market with approximately 62.0% market share through advanced accessibility features, including superior mobility capability, excellent collaboration characteristics, and cost efficiency that enable finance teams to achieve optimal reconciliation performance across diverse organizational environments.
Value Drivers: The segment benefits from CFO preference for subscription services that provide automatic updates, reduced IT infrastructure burden, and rapid deployment without requiring significant capital investment. Advanced platform features enable multi-user access, real-time collaboration, and integration with existing cloud ecosystems, where deployment agility and operational flexibility represent critical finance department requirements.
Competitive Advantages: Cloud-based systems differentiate through proven scalability, automatic platform enhancements, and integration with modern financial management processes that improve operational effectiveness while maintaining optimal performance suitable for diverse enterprise applications.
Key market characteristics:
Local deployment models maintain a significant 38.0% market share in the balance sheet management software market due to their exceptional data control and system customization properties. These solutions appeal to financial institutions requiring complete infrastructure sovereignty with comprehensive security capabilities for regulated banking applications. Market presence is driven by financial services adoption, emphasizing data residency and operational control through on-premises technology systems.
Why Does the Large Enterprises Segment Dominate the Balance Sheet Management Software Market?
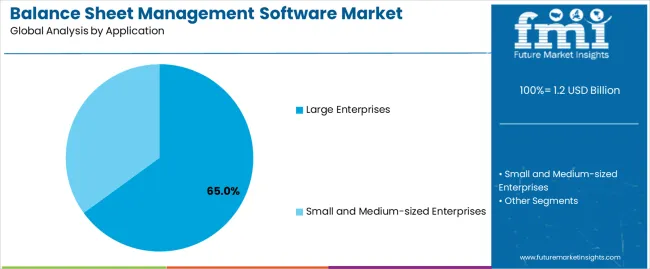
Market Context: Large enterprise applications dominate the balance sheet management software market with approximately 65.0% market share due to critical financial complexity requirements and increasing focus on multi-entity consolidation optimization, intercompany reconciliation management, and enterprise-scale financial close applications that minimize reporting delays while maintaining organizational accuracy standards.
Appeal Factors: Corporate controllers prioritize reconciliation automation, audit trail completeness, and compatibility with complex financial architectures that enable coordinated close processes across multiple business units. The segment benefits from substantial financial transformation investment and close acceleration programs that emphasize the acquisition of enterprise-grade balance sheet platforms for financial reporting applications.
Growth Drivers: Financial close acceleration initiatives incorporate balance sheet automation as standard requirements for reporting modernization, while Sarbanes-Oxley compliance continues to drive the need for comprehensive control documentation capabilities that comply with audit requirements and minimize control deficiencies.
Market Challenges: Varying chart of account structures and subsidiary reporting requirements may limit reconciliation standardization across different enterprise divisions or geographic regions.
Application dynamics include:
SMB applications capture approximately 35.0% market share through streamlined reconciliation requirements in focused financial operations, budget-conscious solution demand, and simplified implementation preferences. These applications require accessible platforms capable of operating with limited finance resources while delivering reliable reconciliation and month-end close characteristics.
Growth Accelerators: Financial close acceleration drives primary adoption as balance sheet management software provides automated reconciliation capabilities that enable finance teams to meet reporting deadlines without manual processes, supporting financial accuracy and stakeholder confidence missions that require efficient close cycles. Regulatory compliance intensification accelerates market expansion as organizations seek comprehensive documentation solutions that maximize audit preparedness while maintaining reconciliation effectiveness during financial reporting and control testing scenarios. Financial automation investment increases worldwide, creating sustained demand for cloud platforms that complement traditional accounting processes and provide operational flexibility in complex financial environments.
Growth Inhibitors: Implementation complexity challenges vary across organizations regarding legacy system integration and data standardization requirements, which may limit deployment success and market penetration in companies with fragmented financial systems or decentralized accounting operations. Change management obstacles persist regarding user adoption resistance and process transformation requirements that may reduce implementation ROI in traditional finance cultures, affecting system utilization and organizational benefits realization. Market fragmentation across multiple accounting platforms and custom integration needs creates technical barriers between different financial ecosystems and seamless automation capabilities.
Market Evolution Patterns: Adoption accelerates in large enterprises and financial services sectors where complexity justifies platform investments, with geographic concentration in developed markets transitioning toward mainstream adoption in emerging economies driven by financial infrastructure modernization and corporate governance advancement. Technology development focuses on enhanced AI automation, improved exception management intelligence, and integration with treasury platforms that optimize financial accuracy and risk management. The market could face disruption if native ERP providers significantly enhance built-in reconciliation capabilities or if blockchain technologies fundamentally change the approach to balance sheet verification in financial reporting.
The balance sheet management software market demonstrates varied regional dynamics with Growth Leaders including China (4.7% CAGR) and India (4.4% CAGR) driving expansion through financial digitization acceleration and corporate governance infrastructure development. Steady Performers encompass Germany (4.0% CAGR), Brazil (3.7% CAGR), and United States (3.3% CAGR), benefiting from established corporate finance industries and advanced financial technology adoption. Mature Markets feature United Kingdom (3.0% CAGR) and Japan (2.6% CAGR), where specialized financial services and compliance-focused solutions support consistent growth patterns.
| Country | CAGR (2025-2035) |
|---|---|
| China | 4.7% |
| India | 4.4% |
| Germany | 4.0% |
| Brazil | 3.7% |
| United States | 3.3% |
| United Kingdom | 3.0% |
| Japan | 2.6% |
Regional synthesis reveals Asia-Pacific markets leading adoption through corporate financial modernization and accounting standard enhancement, while European countries maintain steady growth supported by financial reporting regulation compliance and balance sheet technology standardization requirements. North American markets show moderate growth driven by continuous accounting adoption and financial close optimization integration trends.
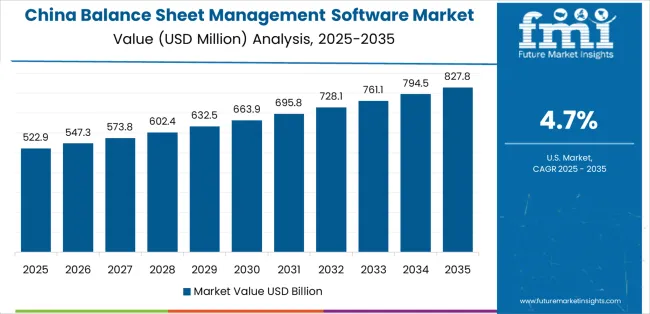
China establishes high-growth leadership through rapid corporate financial modernization and comprehensive accounting infrastructure development, integrating balance sheet management software as standard financial tools in large enterprise and state-owned company installations. The country's 4.7% CAGR reflects financial governance initiatives promoting reporting quality and accounting standardization capabilities that mandate the use of automated reconciliation platforms in corporate and financial institution operations. Growth concentrates in major financial centers, including Shanghai, Beijing, and Shenzhen, where financial automation showcases integrated balance sheet systems that appeal to public companies seeking efficient close processes and audit readiness solutions.
Chinese financial software providers are developing localized platforms that combine competitive pricing advantages with domestic accounting standard integration, including enhanced compatibility with Chinese GAAP and regulatory reporting requirements. Service channels through financial consultants and accounting firm partners expand market access, while government corporate governance programs for financial quality enhancement support adoption across diverse manufacturing enterprise and financial service segments.
Strategic Market Indicators:
In Mumbai, Bangalore, and financial centers, corporate finance departments and shared service organizations are implementing balance sheet management software as standard financial tools for close acceleration and compliance enhancement, driven by increasing corporate complexity and financial reporting programs that emphasize the importance of reconciliation automation. The market holds a 4.4% CAGR, supported by expanding business process outsourcing industry and corporate finance modernization initiatives that promote automated platforms for enterprise and outsourcing service applications. Indian organizations are adopting cloud-based deployment models that provide affordability and accessibility, particularly appealing in outsourcing hubs where service delivery efficiency and quality represent critical business differentiators.
Market expansion benefits from growing financial services expertise and international accounting standard adoption that enable technology implementation for corporate and service delivery applications. Technology adoption follows patterns established in enterprise resource planning, where process efficiency and quality control drive technology investments and capability development.
Market Intelligence Brief:
Germany's corporate market demonstrates robust financial governance capability with documented reconciliation effectiveness in manufacturing finance and corporate accounting through established control infrastructure. The country leverages accounting precision and compliance rigor to maintain a 4.0% CAGR. Corporate organizations, including Frankfurt, Munich, and Stuttgart regions, showcase balance sheet implementations where automated platforms integrate with comprehensive financial control systems and audit frameworks to optimize reporting effectiveness.
German finance departments prioritize reconciliation accuracy and audit trail completeness in platform selection, creating demand for advanced solutions with comprehensive control features, including maker-checker workflows and detailed variance analysis. The market benefits from established corporate accounting infrastructure and willingness to invest in quality-assuring financial technologies that provide governance benefits and compliance with HGB reporting standards.
Market Intelligence Brief:
Brazil's market expansion benefits from growing corporate financial sophistication, including accounting modernization in São Paulo and Rio de Janeiro, IFRS adoption advancement, and corporate governance programs that increasingly promote balance sheet automation for financial applications. The country maintains a 3.7% CAGR, driven by public company compliance growth and increasing recognition of financial close efficiency benefits, including reduced manual effort and improved accuracy capabilities.
Market dynamics focus on cost-effective solutions that balance automation capability with budget considerations important to Brazilian corporations. Growing financial governance awareness creates sustained demand for reconciliation platforms in corporate infrastructure and accounting modernization projects.
Strategic Market Considerations:
The USA market emphasizes advanced automation capabilities, including AI-powered exception management and integration with comprehensive corporate performance management platforms that handle financial planning, consolidation, and disclosure applications through unified finance ecosystems. The country holds a 3.3% CAGR, driven by continuous accounting adoption and financial close optimization that support balance sheet technology integration. American finance departments prioritize operational efficiency with platforms delivering intelligent automation through advanced machine learning and predictive analytics capabilities.
Technology deployment channels include Big Four accounting firms, finance transformation consultants, and managed service partners that support complex implementation requirements. Corporate performance management integration capabilities with established financial systems expand market appeal across diverse operational requirements seeking automation and insight benefits.
Performance Metrics:
In London, Manchester, and financial centers, British corporations and financial institutions are implementing advanced balance sheet platforms to enhance reporting capabilities and support modern finance operations that align with IFRS standards and governance requirements. The UK market holds a 3.0% CAGR, driven by financial services sophistication and accounting efficiency optimization that emphasize compliant platforms for corporate finance and regulated institution applications. British organizations are prioritizing platforms that provide comprehensive audit support while maintaining automation efficiency, particularly important in financial services and FTSE-listed companies with stringent reporting requirements.
Market expansion benefits from financial reporting quality culture that mandates comprehensive documentation in balance sheet specifications, creating sustained demand across the UK's corporate and financial sectors, where reconciliation accuracy and audit trail transparency represent critical requirements. The regulatory framework supports automated reconciliation adoption through accounting standards and financial reporting requirements that promote validated platforms aligned with FRC expectations.
Strategic Market Indicators:
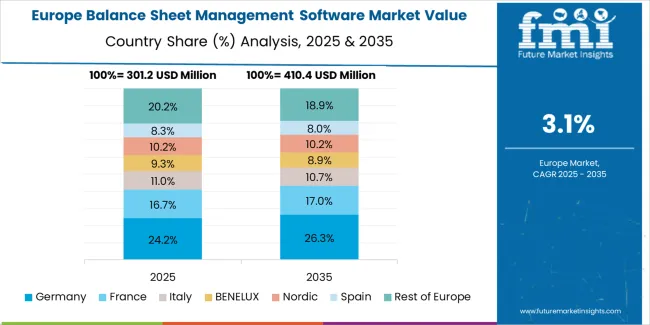
The European balance sheet management software market is projected to grow steadily over the forecast period. Germany is expected to maintain its leadership position with a 32.4% market share in 2025, supported by its advanced corporate finance infrastructure and major enterprise networks across Frankfurt, Munich, and Stuttgart regions.
France follows with a 26.8% share in 2025, driven by comprehensive financial reporting programs and corporate accounting development initiatives. Spain holds an 18.6% share in 2025 through corporate finance advancement and accounting infrastructure modernization. The United Kingdom commands a 14.2% share, while Italy accounts for 8.0% in 2025. The Rest of Europe region is anticipated to maintain momentum attributed to increasing financial automation in Nordic countries and emerging Eastern European corporations implementing accounting transformation programs.
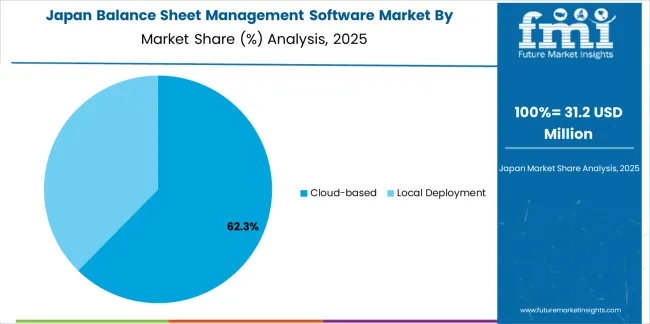
In Japan, the balance sheet management software market prioritizes cloud-based deployment models, which capture the dominant share of corporate and financial institution installations due to their advanced features, including superior accessibility and seamless integration with existing financial infrastructure. Japanese finance departments emphasize reliability, data security, and vendor stability, creating demand for cloud platforms that provide consistent reconciliation capabilities and adaptive performance based on organizational requirements and accounting complexity. Other deployment types maintain secondary positions primarily in banking applications and regulated institution installations where on-premises solutions meet data residency requirements without compromising system control.
Market Characteristics:
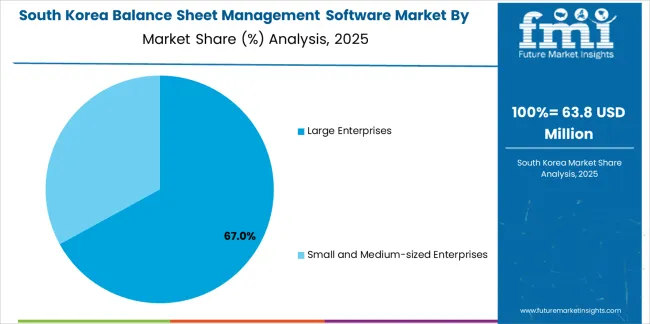
In South Korea, the market structure favors international balance sheet software providers, including BlackLine, Oracle, and Workiva, which maintain dominant positions through comprehensive product portfolios and established accounting firm networks supporting corporate finance and financial institution installations. These providers offer integrated solutions combining reconciliation automation with professional implementation services and ongoing technical support that appeal to Korean enterprises seeking reliable financial transformation enablement. Local system integrators and accounting service providers capture a moderate market share by providing localized implementation support and competitive service pricing for standard corporate installations, while domestic software companies focus on specialized applications and cost-effective solutions tailored to Korean accounting characteristics.
Channel Insights:
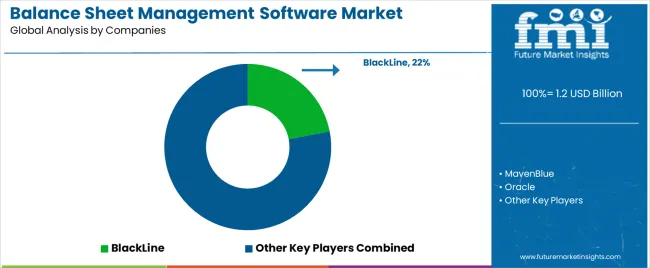
The balance sheet management software market operates with moderate concentration, featuring approximately 12-15 meaningful participants, where leading companies control roughly 58-65% of the global market share through established finance department relationships and comprehensive platform portfolios. BlackLine maintains a leading position with approximately 22.0% market share through extensive financial close expertise and global accounting firm partnerships. Competition emphasizes automation sophistication, reconciliation accuracy, and implementation support rather than price-based rivalry.
Market Leaders encompass BlackLine, Oracle, and Workiva, which maintain competitive advantages through extensive financial management expertise, global Big Four accounting networks, and comprehensive platform capabilities that create customer loyalty and support premium pricing. These companies leverage decades of enterprise financial software experience and ongoing platform investments to develop advanced balance sheet solutions with AI-powered automation and multi-entity consolidation features.
Technology Innovators include MavenBlue, HighRadius, and FIS, which compete through specialized automation focus and innovative continuous accounting approaches that appeal to progressive finance teams seeking modern reconciliation capabilities and real-time visibility. These companies differentiate through cloud-native architectures and specialized treasury integration focus.
Regional Specialists feature companies like Jedox, Phocas Software, and Prometeia, which focus on specific geographic markets and specialized applications, including analytics-driven reconciliation and risk-focused balance sheet management. Market dynamics favor participants that combine reliable automation execution with comprehensive professional services, including process redesign consulting and change management support capabilities. Competitive pressure intensifies as ERP vendors enhance native reconciliation functionality, while specialized fintech companies challenge established players through AI-powered exception management solutions and continuous accounting offerings targeting modern finance transformation segments.
| Item | Value |
|---|---|
| Quantitative Units | USD 1,207.9 million |
| Deployment Type | Cloud-based, Local Deployment |
| Application | Large Enterprises, Small and Medium-sized Enterprises |
| Regions Covered | Asia Pacific, Europe, North America, Latin America, Middle East & Africa |
| Countries Covered | China, India, Germany, Brazil, United States, United Kingdom, Japan, and 25+ additional countries |
| Key Companies Profiled | BlackLine, MavenBlue, Oracle, FIS, Workiva, HighRadius |
| Additional Attributes | Dollar sales by deployment type and application categories, regional adoption trends across Asia-Pacific, Europe, and North America, competitive landscape with financial software providers and accounting system integrators, finance department preferences for automation capability and reconciliation accuracy, integration with ERP platforms and financial governance systems, innovations in AI-powered automation and continuous accounting, and development of implementation services with enhanced process consulting and change management capabilities. |
The global balance sheet management software market is estimated to be valued at USD 1.2 billion in 2025.
The market size for the balance sheet management software market is projected to reach USD 1.7 billion by 2035.
The balance sheet management software market is expected to grow at a 3.5% CAGR between 2025 and 2035.
The key product types in balance sheet management software market are cloud-based and local deployment.
In terms of application, large enterprises segment to command 65.0% share in the balance sheet management software market in 2025.


Full Research Suite comprises of:
Market outlook & trends analysis
Interviews & case studies
Strategic recommendations
Vendor profiles & capabilities analysis
5-year forecasts
8 regions and 60+ country-level data splits
Market segment data splits
12 months of continuous data updates
DELIVERED AS:
PDF EXCEL ONLINE
Balanced Salt Solution For Cell Culture Market
Micro Balances Market Size and Share Forecast Outlook 2025 to 2035
Airflow Balancer Market Size and Share Forecast Outlook 2025 to 2035
Laboratory Balances and Scales Market Growth - Industry Forecast 2025 to 2035
Cloud Load Balancers Market Analysis by Component, Vertical, and Region Through 2025 to 2035
Automotive Balance Shaft Market Trends - Growth & Forecast 2025 to 2035
Analytical Balance Market
Sheeted Labels Market Size and Share Forecast Outlook 2025 to 2035
Sheet Metal Market Size, Growth, and Forecast 2025 to 2035
Sheet Pan Racks Market
Slip Sheets Market Insights – Growth & Demand 2025 to 2035
Dryer Sheets Market Size and Share Forecast Outlook 2025 to 2035
Metal Sheet Bending Machine Market Size, Growth, and Forecast 2025 to 2035
Veneer Sheets Market Size and Share Forecast Outlook 2025 to 2035
Mirror Sheets Market Size and Share Forecast Outlook 2025 to 2035
Bonding Sheet Market Forecast and Outlook 2025 to 2035
Aluminum Sheets and Coils Market Size and Share Forecast Outlook 2025 to 2035
Tarpaulin Sheets Market Size and Share Forecast Outlook 2025 to 2035
Tarpaulin Sheet Industry Analysis in Western Europe Size and Share Forecast Outlook 2025 to 2035
Tarpaulin Sheet Industry Analysis in Korea Size and Share Forecast Outlook 2025 to 2035

Thank you!
You will receive an email from our Business Development Manager. Please be sure to check your SPAM/JUNK folder too.
Chat With
MaRIA